

Yesterday’s ECB decision triggered a sharp decline and pushed the USD Index to an intraday low of 97.60. Although the index rebounded slightly earlier today, it is still trading under 99. Will today’s highly-anticipated report on U.S. employment support the greenback? Before we know the answer to this question, let’s check how yesterday downward move affected the short-term picture of our six currency pairs.
In our opinion the following forex trading positions are justified - summary:
EUR/USD
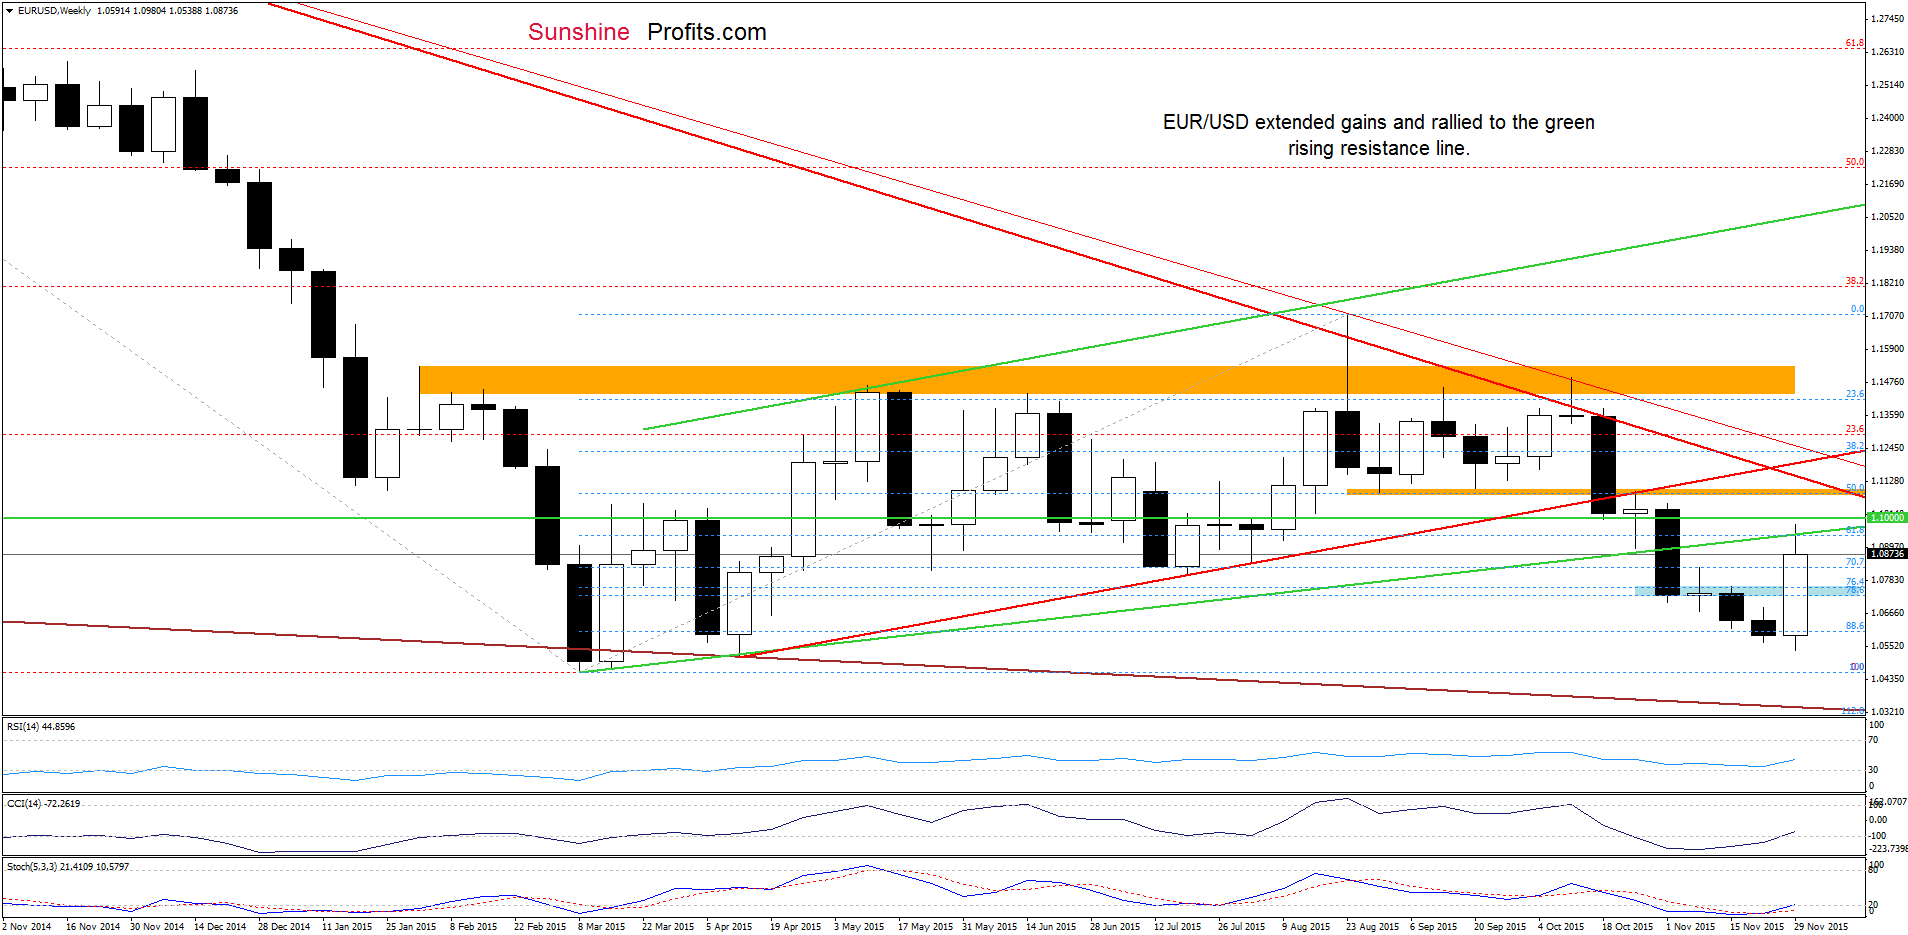
Looking at the weekly chart we see that an invalidation of the breakdown under the 88.6% Fibonacci retracement and the blue zone triggered a sharp rebound, which took the pair to the green resistance line.
What impact did this move have on the very short-term picture? Let’s check.
Quoting our previous commentary:
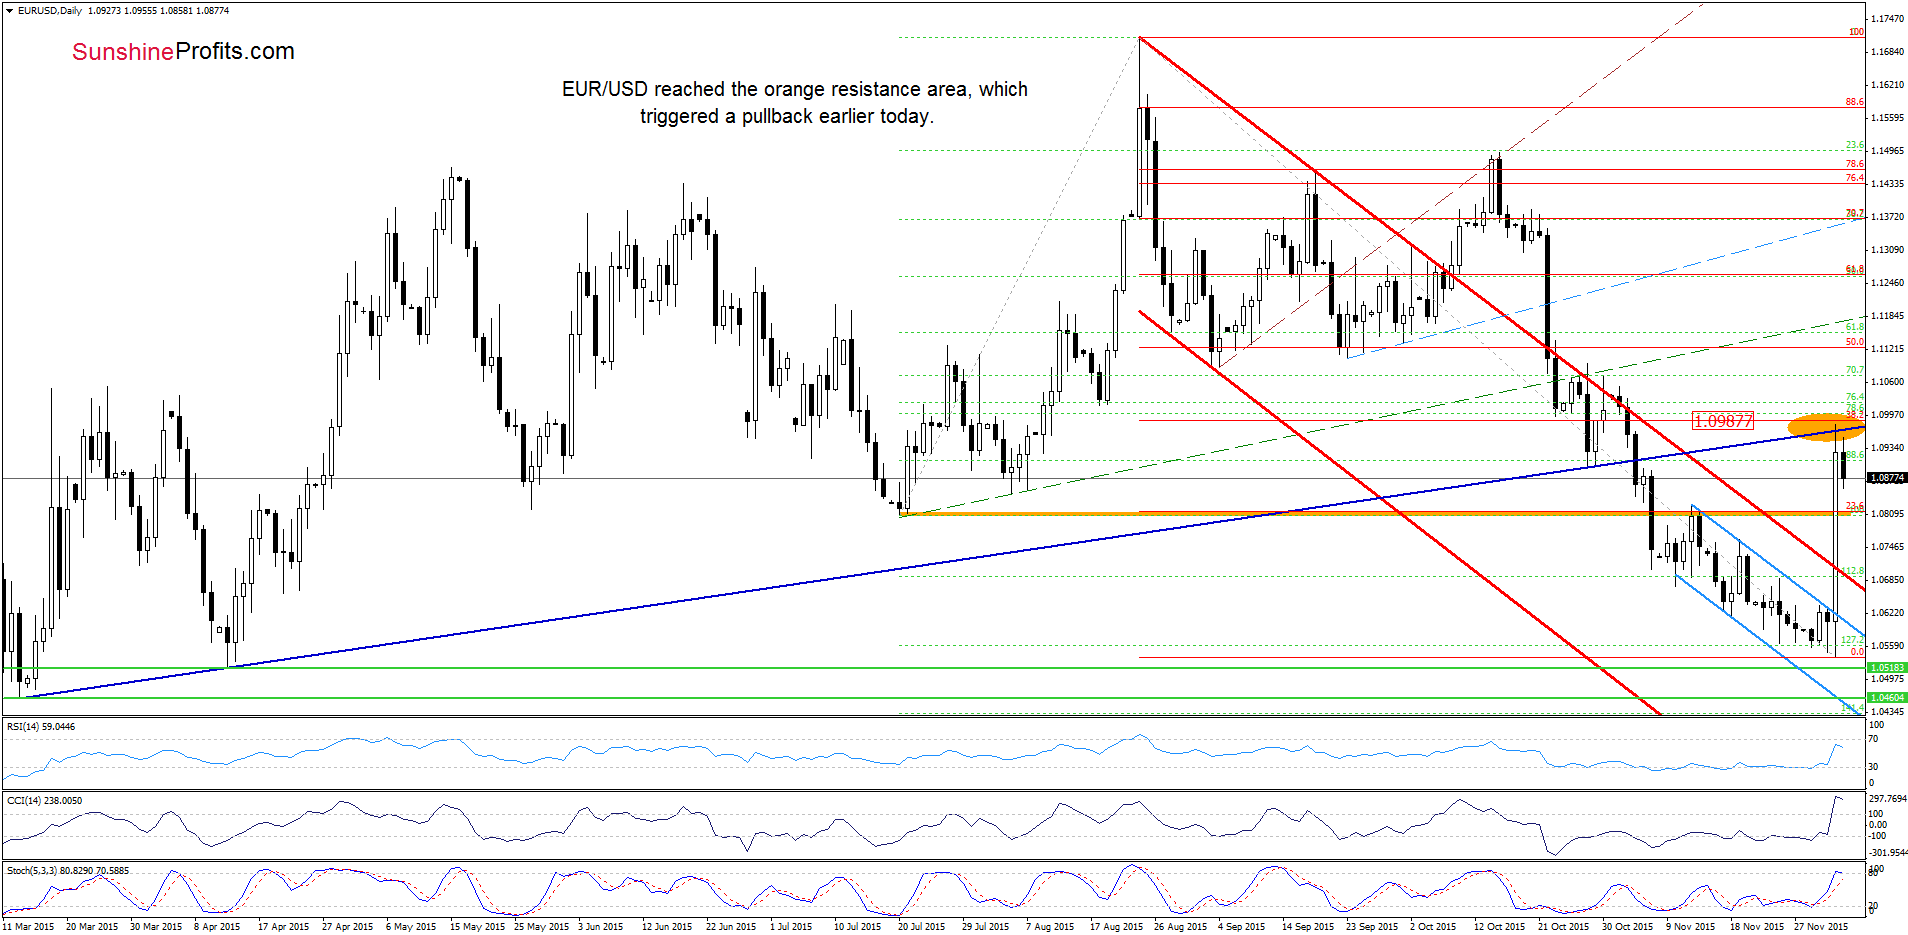
(…) With today’s upward move, the pair increased to the previously-broken resistance area (created by the Jul low and the mid-Nov high), which suggests that we may see further rally to the next resistance zone marked with the orange ellipse (created by the 38.2% Fibonacci retracement and the navy blue dashed resistance line based on the Mar and Apr lows) in the coming days.
On the daily chart we see that the situation developed in line with the above scenario and the exchange rate reached our upside target yesterday. Despite this improvement, the orange resistance area triggered a pullback, which suggests that the pair may extends losses and verified yesterday’s breakout above Jul low and the mid-Nov high in the coming day(s).
Very short-term outlook: mixed
Short-term outlook: mixed
MT outlook: mixed
LT outlook: mixed
Trading position (short-term; our opinion): No positions are justified from the risk/reward perspective at the moment. We will keep you informed should anything change, or should we see a confirmation/invalidation of the above.
GBP/USD
On Monday, w wrote the following:
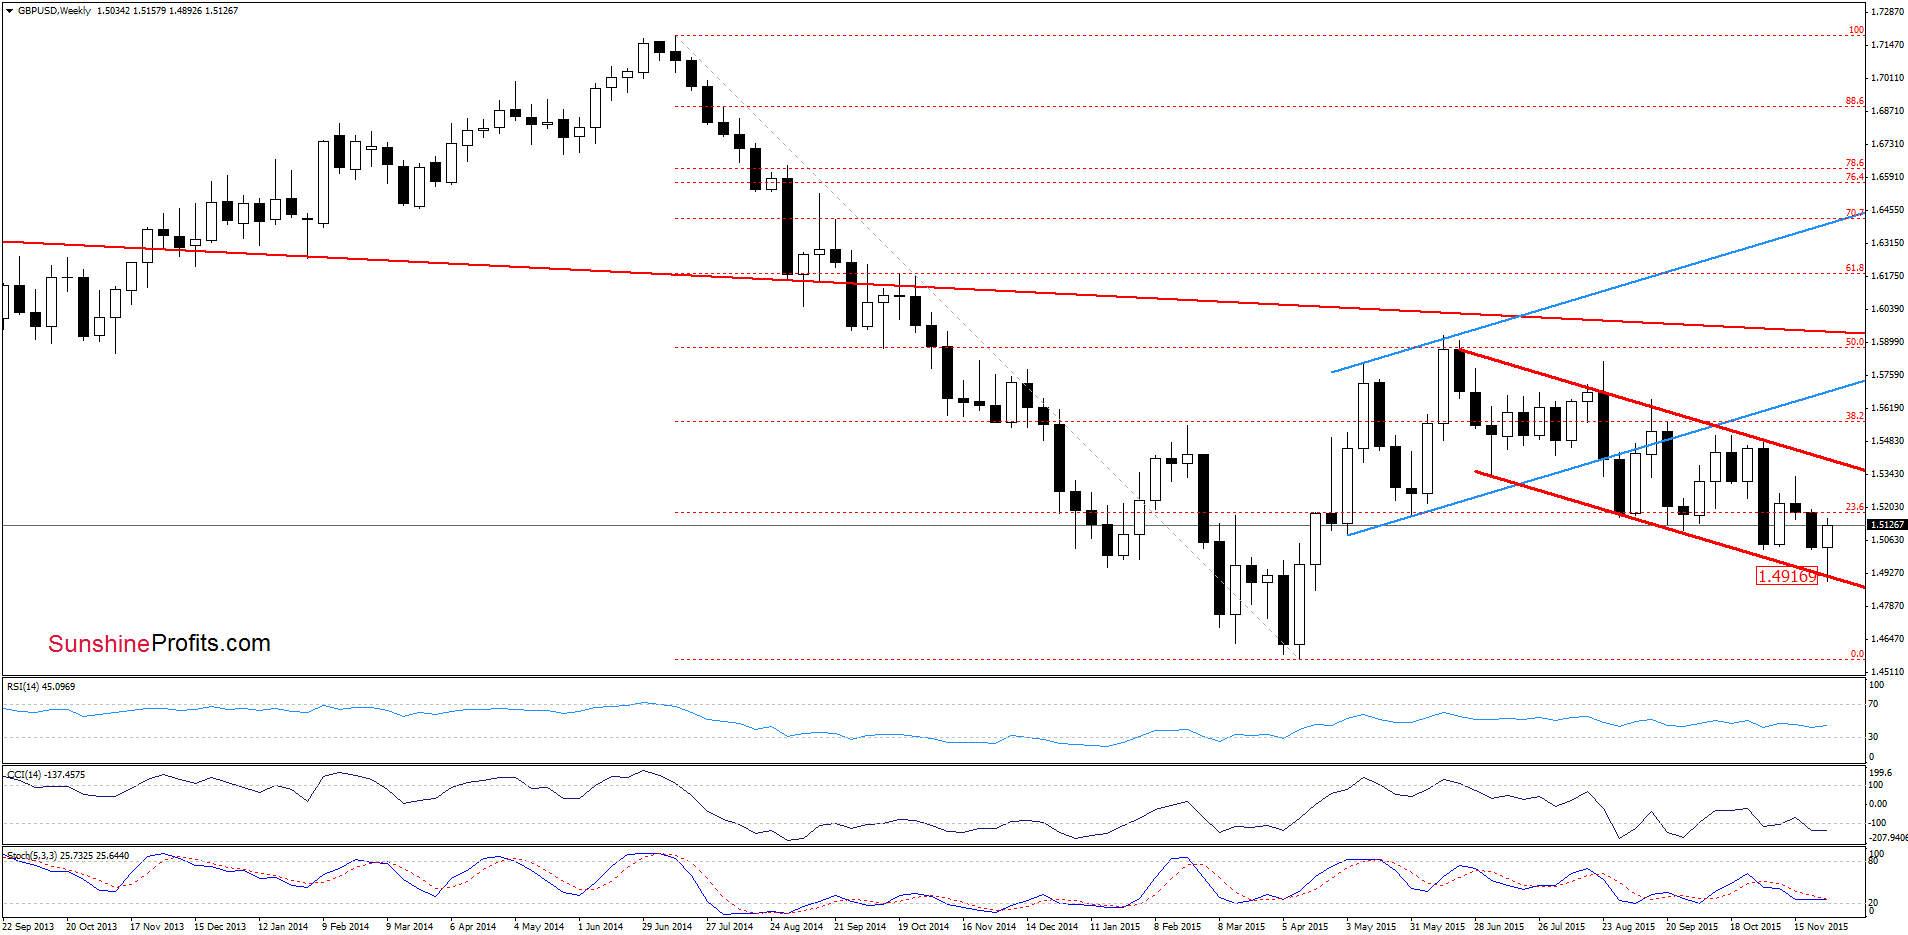
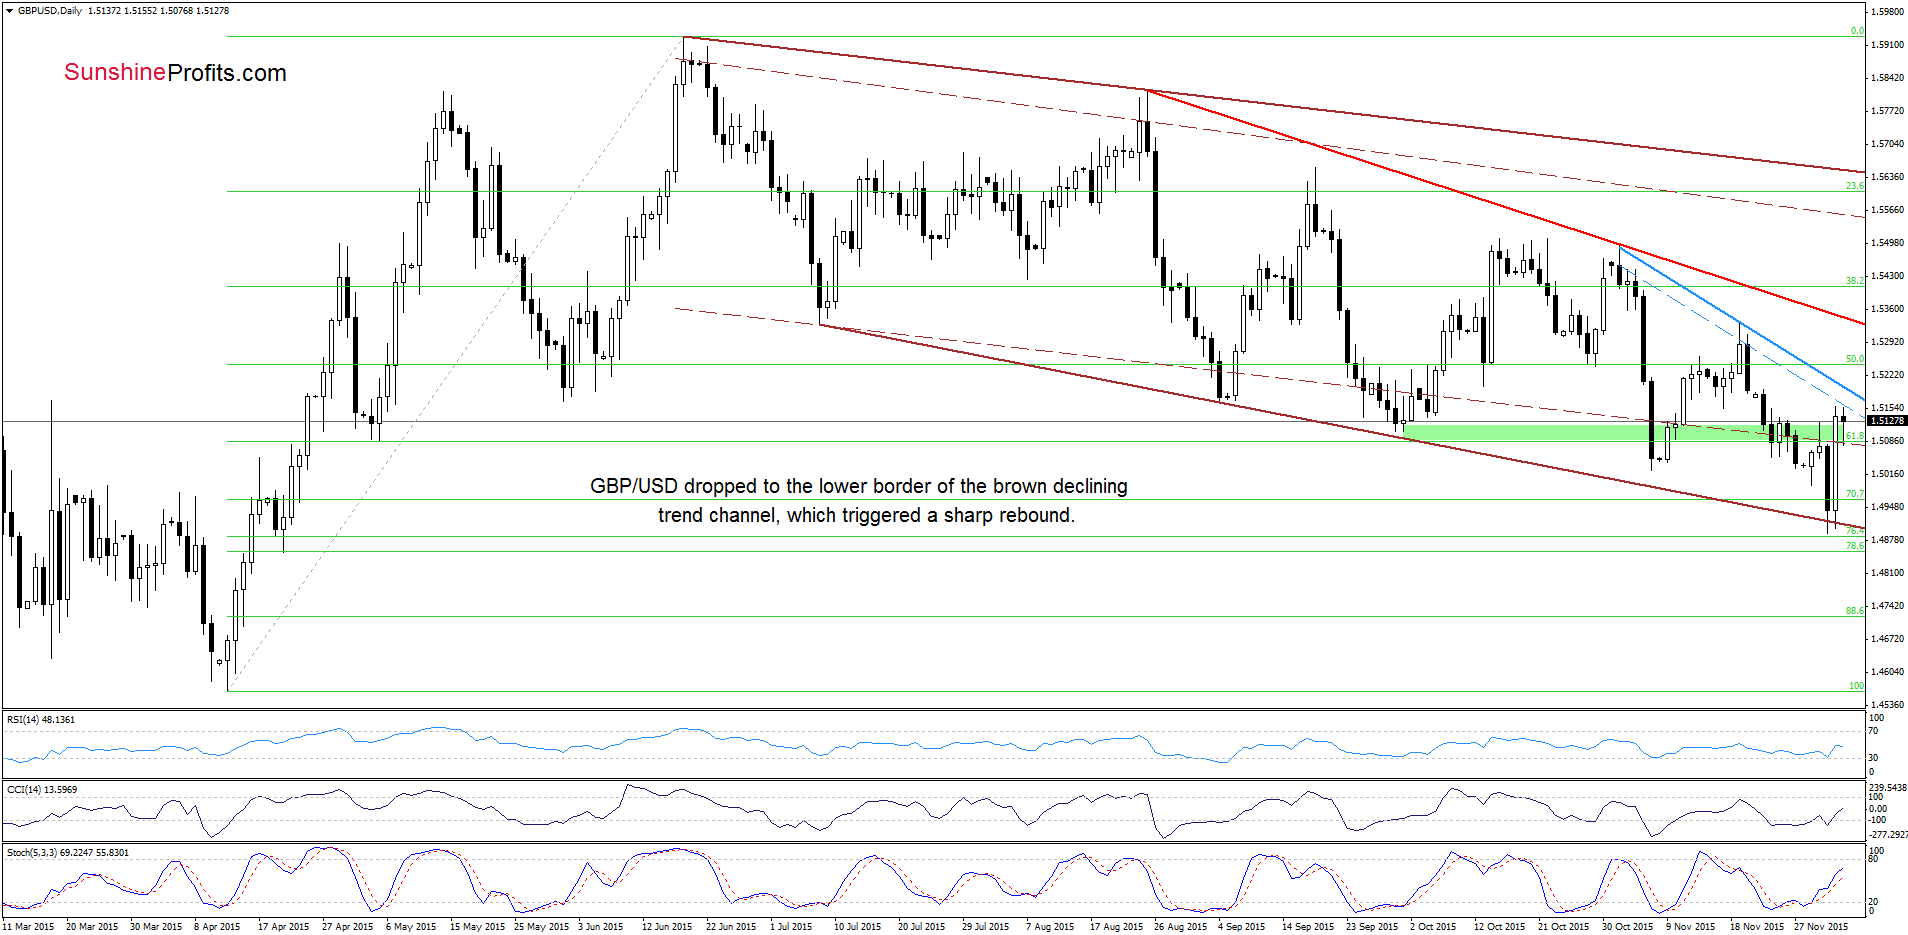
(…) we think that the pair will test the 70.7% Fibonacci retracement in the coming days. However, at this point, it s worth noting that even if the exchange rate moves lower, the space for further declines seems limited as the lower border of the red declining trend channel (marked on the weekly chart) and the brown support line based on the previous lows (marked on the daily chart) are quite close the current levels.
From today’s point of view we see that GBP/USD extended losses and dropped to the above-mentioned key support area, which triggered a sharp rebound yesterday. With this upswing, the pair invalidated earlier breakdown under the green zone, which is a positive signal that suggests a test of the blue resistance line based on the Nov highs in the coming days.
Very short-term outlook: mixed
Short-term outlook: mixed
MT outlook: mixed
LT outlook: mixed
Trading position (short-term; our opinion): No positions are justified from the risk/reward perspective at the moment. We will keep you informed should anything change, or should we see a confirmation/invalidation of the above.
USD/JPY
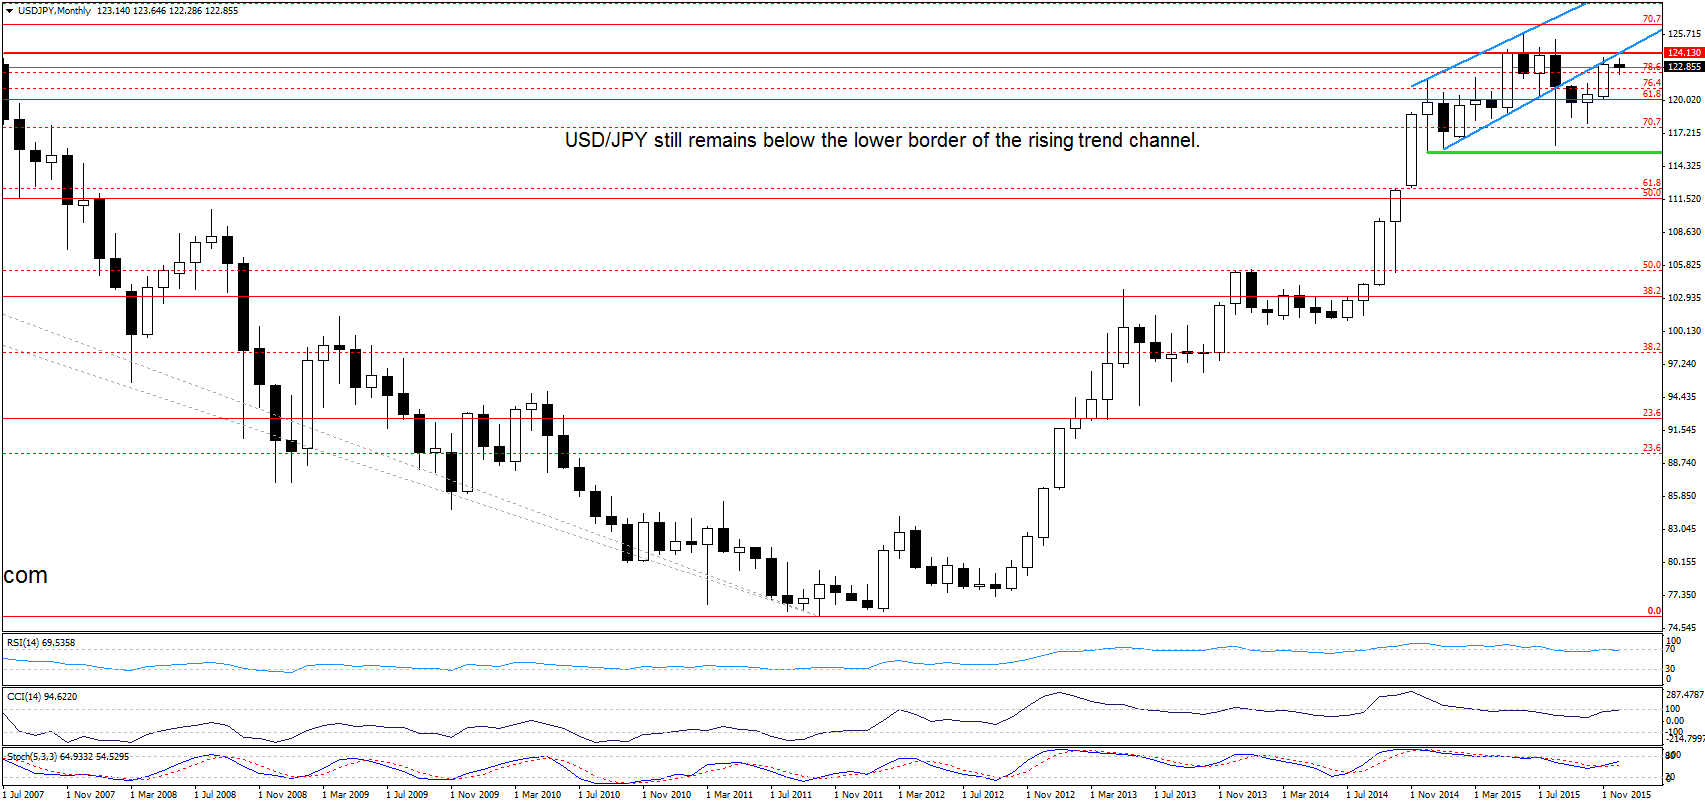
On the above chart, we see that USD/JPY is still trading under the lower border of the blue rising trend channel, which means that as long as there is no comeback above this key resistance line a sizable upward move is not likely to be seen and another downswing is likely.
Will the very short-term chart confirm this pro bearish scenario? Let’s check.
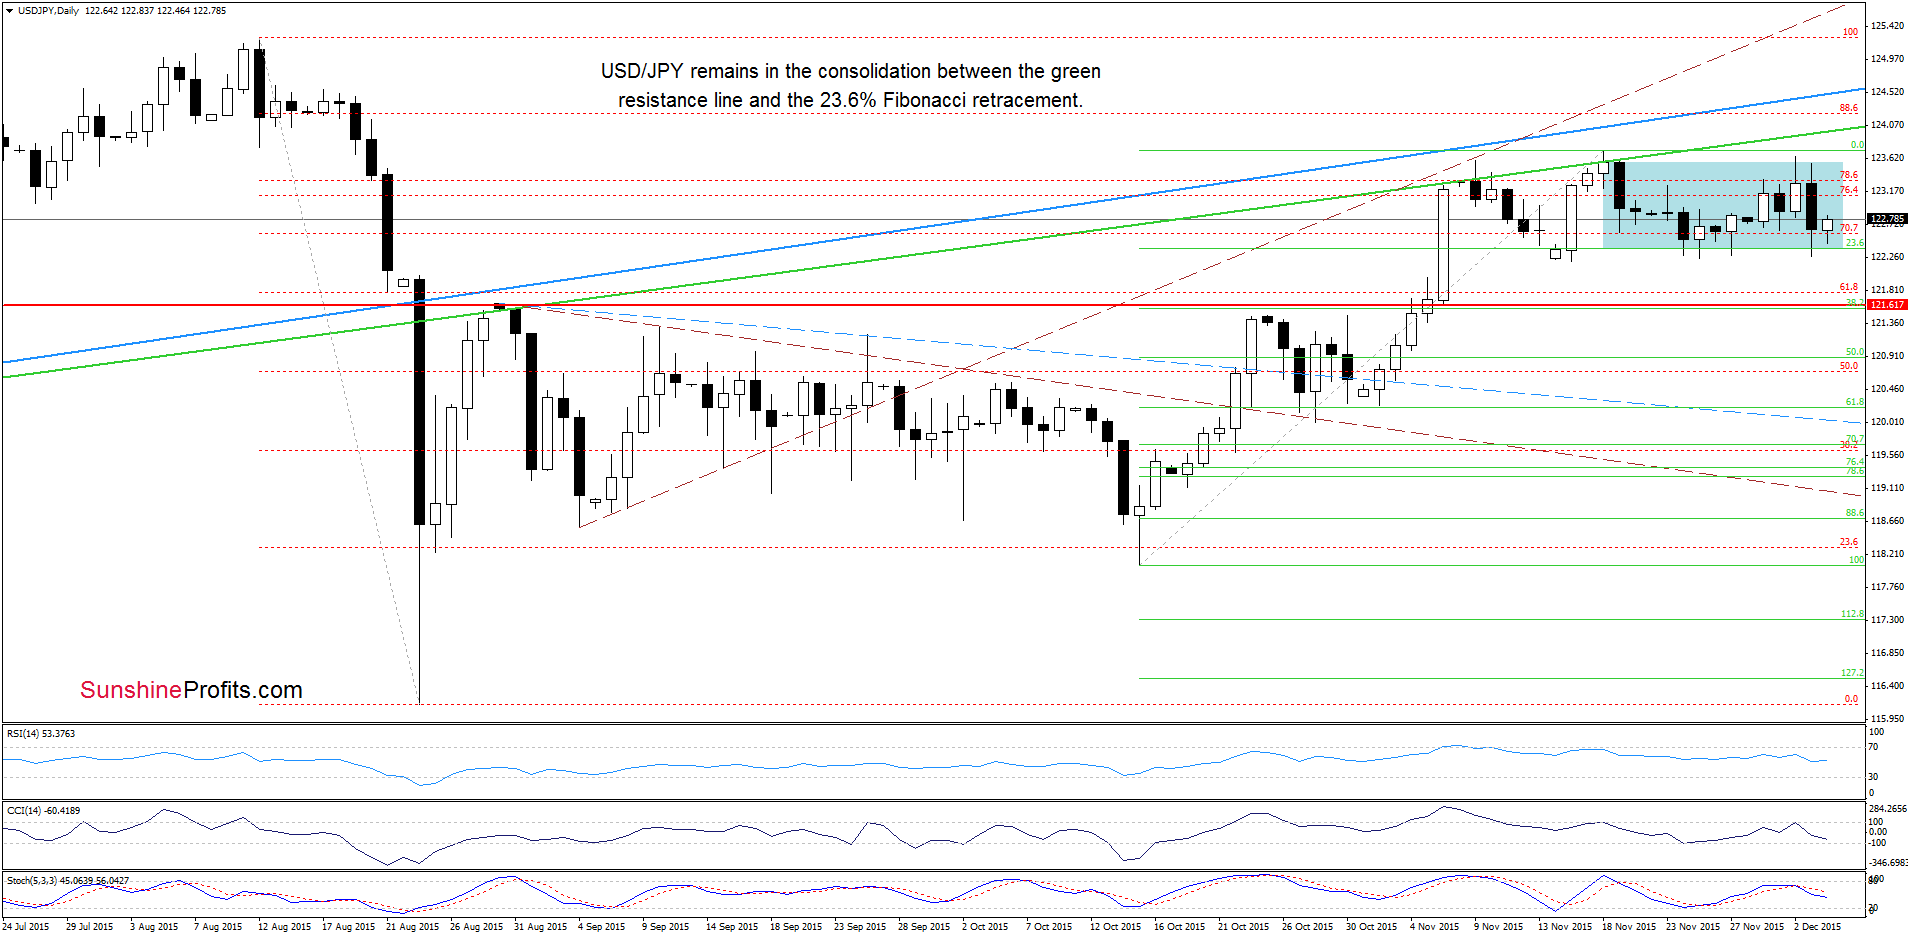
From this perspective we see the very short-term picture hasn’t changed much since our last commentary was posted as USD/JPY is consolidating between the green resistance line and the 23.6% Fibonacci retracement, which makes the situation a bit unclear. Yesterday, the exchange rate declined and reached the lower border of the formation, but in our opinion, further deterioration will be more likely if we see a breakdown under the recent lows. If we see such price action and the pair extends losses and the initial downside target would be around 121.61, where the red horizontal support line based on the Aug high is.
Very short-term outlook: mixed
Short-term outlook: mixed
MT outlook: mixed
LT outlook: mixed
Trading position (short-term; our opinion): No positions are justified from the risk/reward perspective at the moment. We will keep you informed should anything change, or should we see a confirmation/invalidation of the above.
USD/CAD
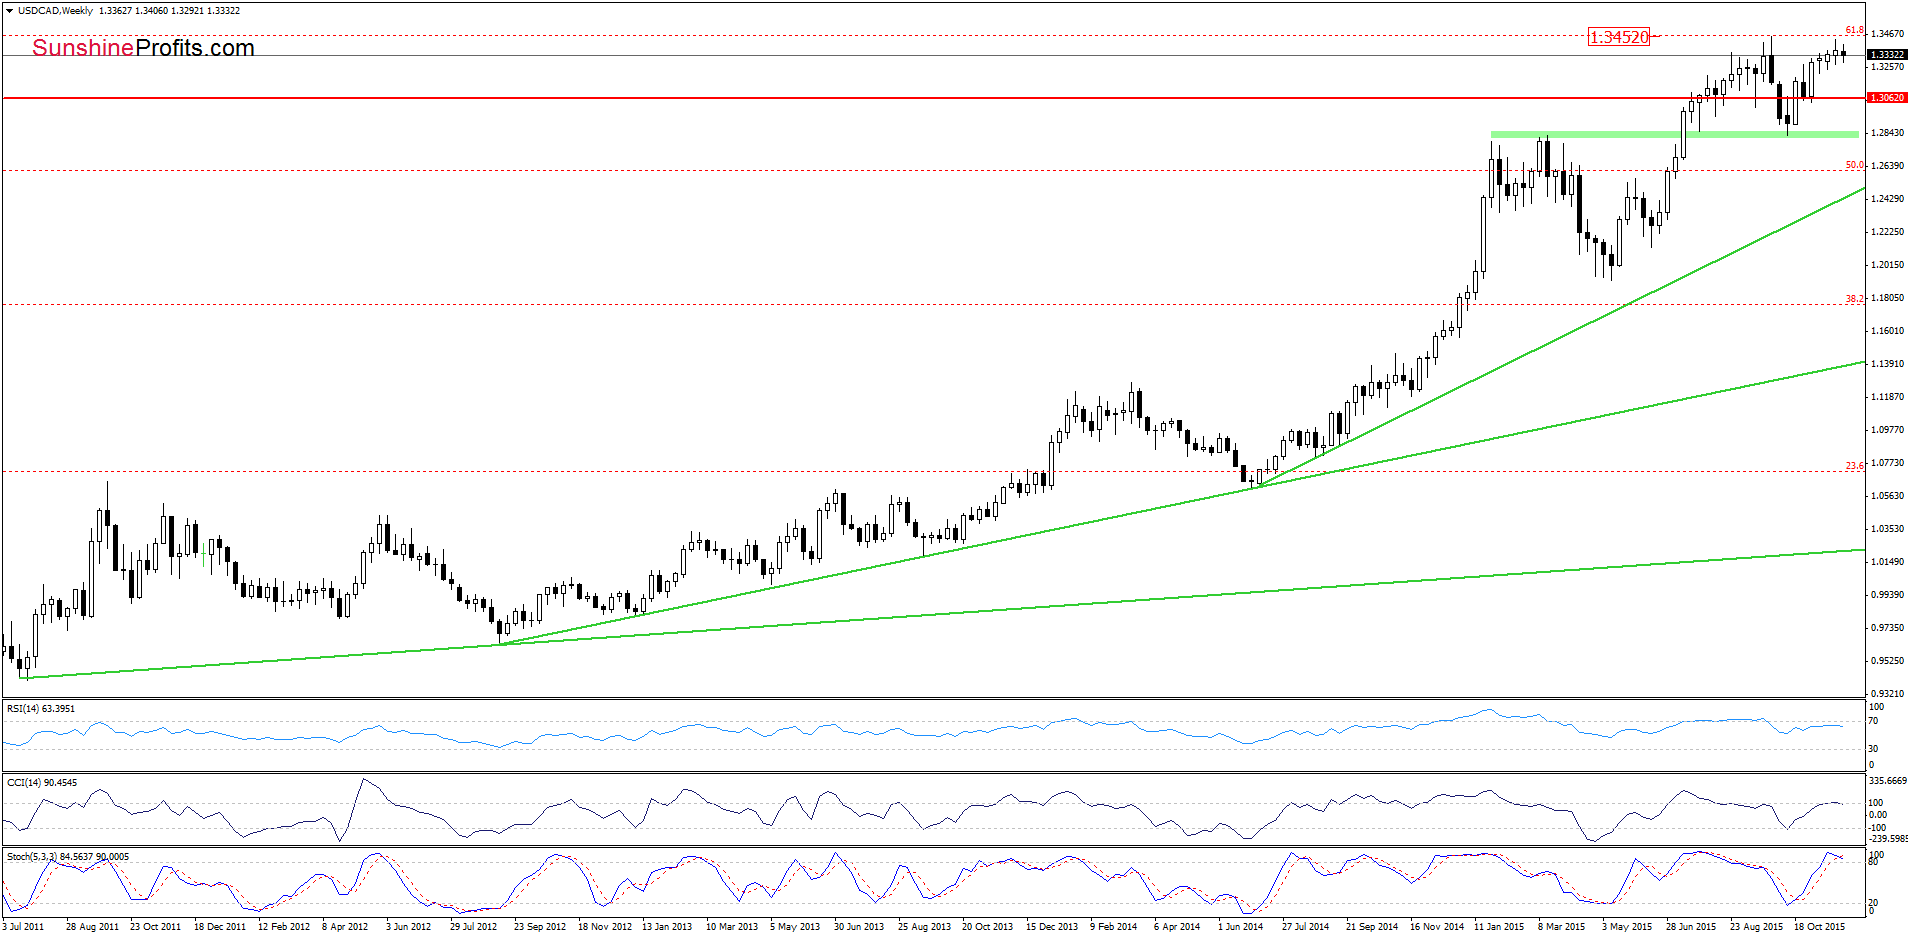
Although the medium-term picture has improved, the proximity to the 61.8% Fibonacci retracement and the previous high encouraged currency bears to act, which resulted in a pullback.
How did this drop affect the very short-term picture? Let’s check.
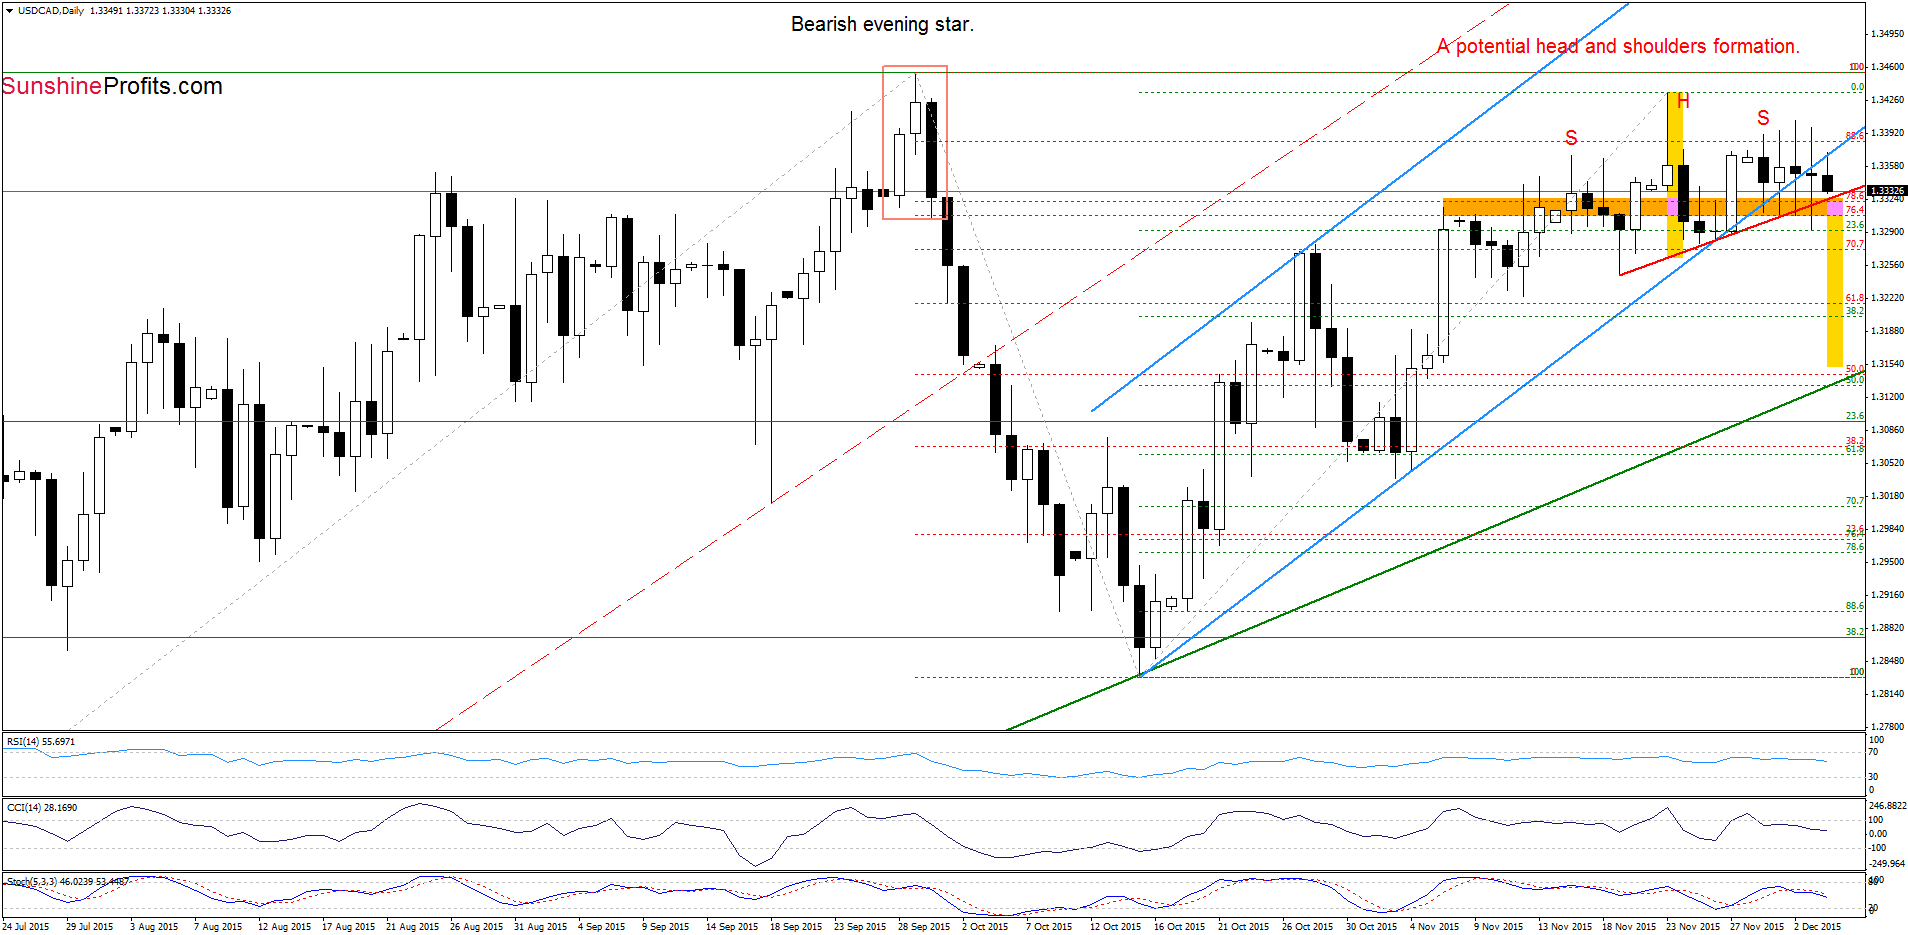
On the daily chart, we see that although USD/CAD moved little higher yesterday, the pair reversed once again and declined below the blue line (the lower border of the rising trend channel), which suggests another re-test of the strength of the orange zone. If this area withstands the selling pressure, we’ll see a rebound from here and another attempt to climb to the recent high. Nevertheless, sell signals generated by the indicators remain in place, suggesting further deterioration. But will we see such price action? In our opinion as long as there is no daily closure below the red support line based on the Nov 19 and Nov 25 lows (the neck line of a potential head and shoulders formation) a sizable downward move is not likely to be seen and another attempt to move higher should not surprise us (similarly to what we saw in recent days).
Very short-term outlook: mixed
Short-term outlook: mixed
MT outlook: mixed
LT outlook: mixed
Trading position (short-term; our opinion): No positions are justified from the risk/reward perspective at the moment. We will keep you informed should anything change, or should we see a confirmation/invalidation of the above.
USD/CHF
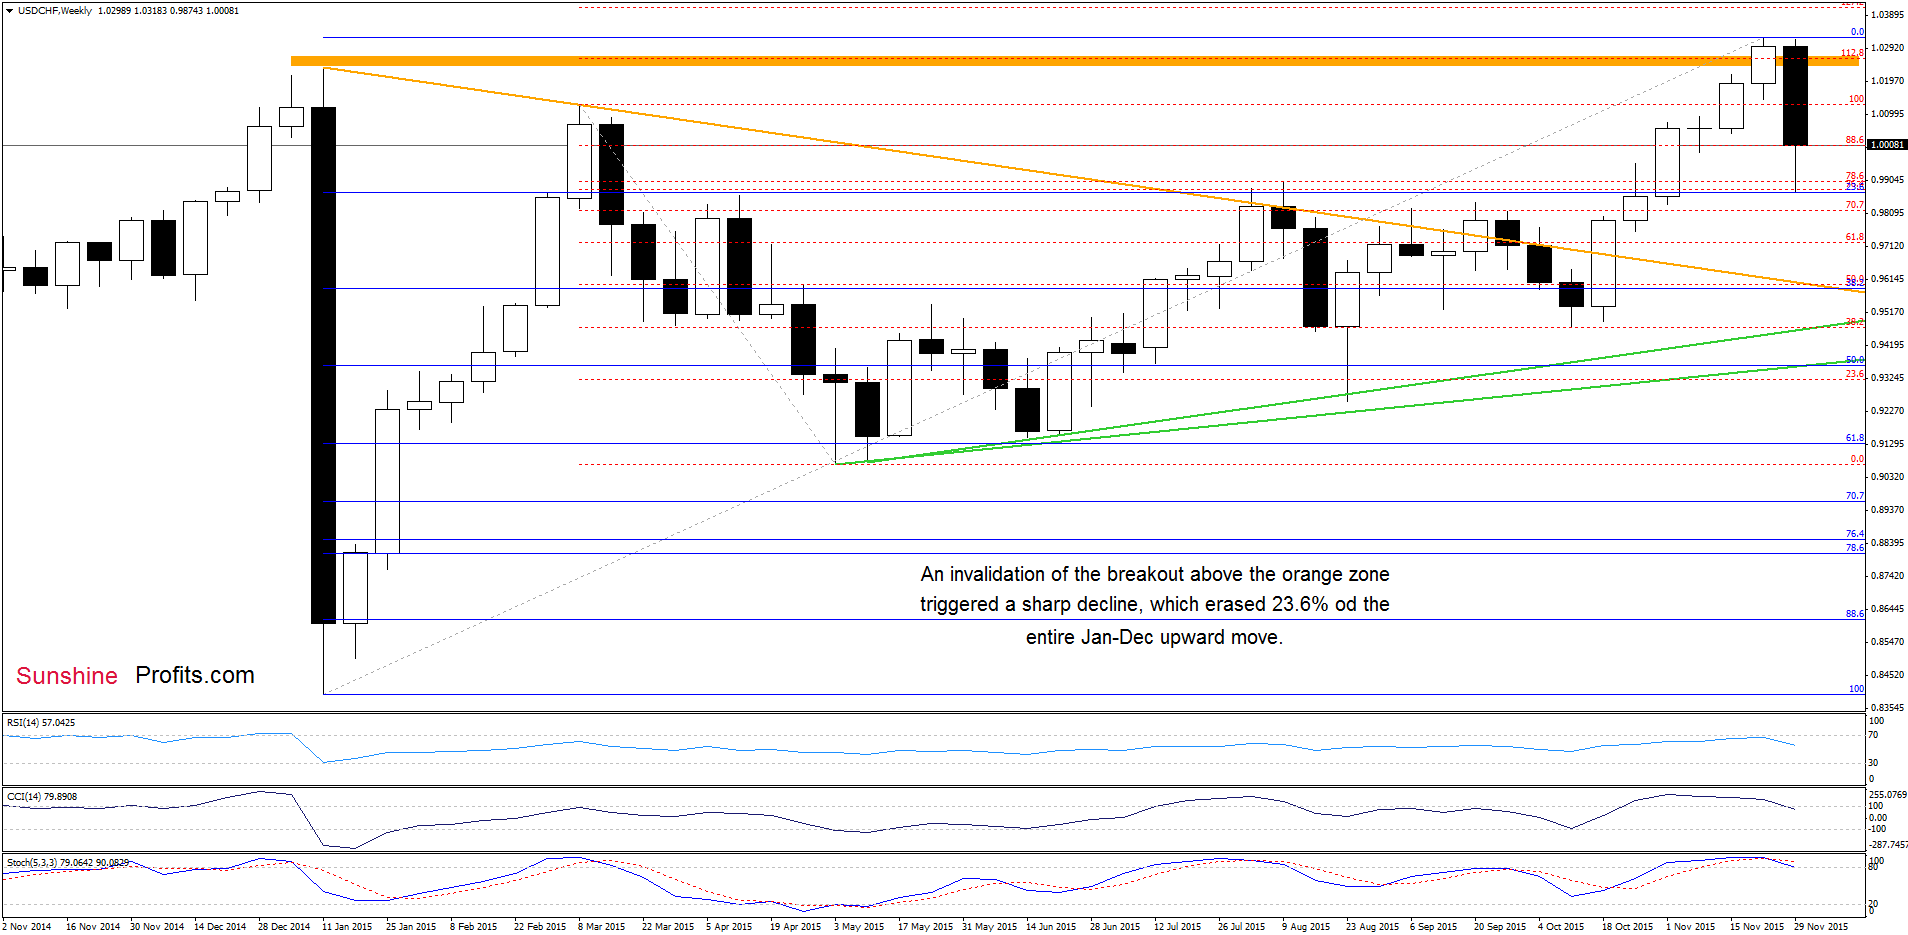
On the weekly chart, we see that USD/CHD invalidated earlier breakout above the orange zone, which triggered a sharp decline. With this downward move the pair reached 23.6% Fibonacci retracement (based on the entire Jan-Dec upward move) which triggered a rebound earlier today.
How did this sharp decline affect the very short-term picture? Let’s check.
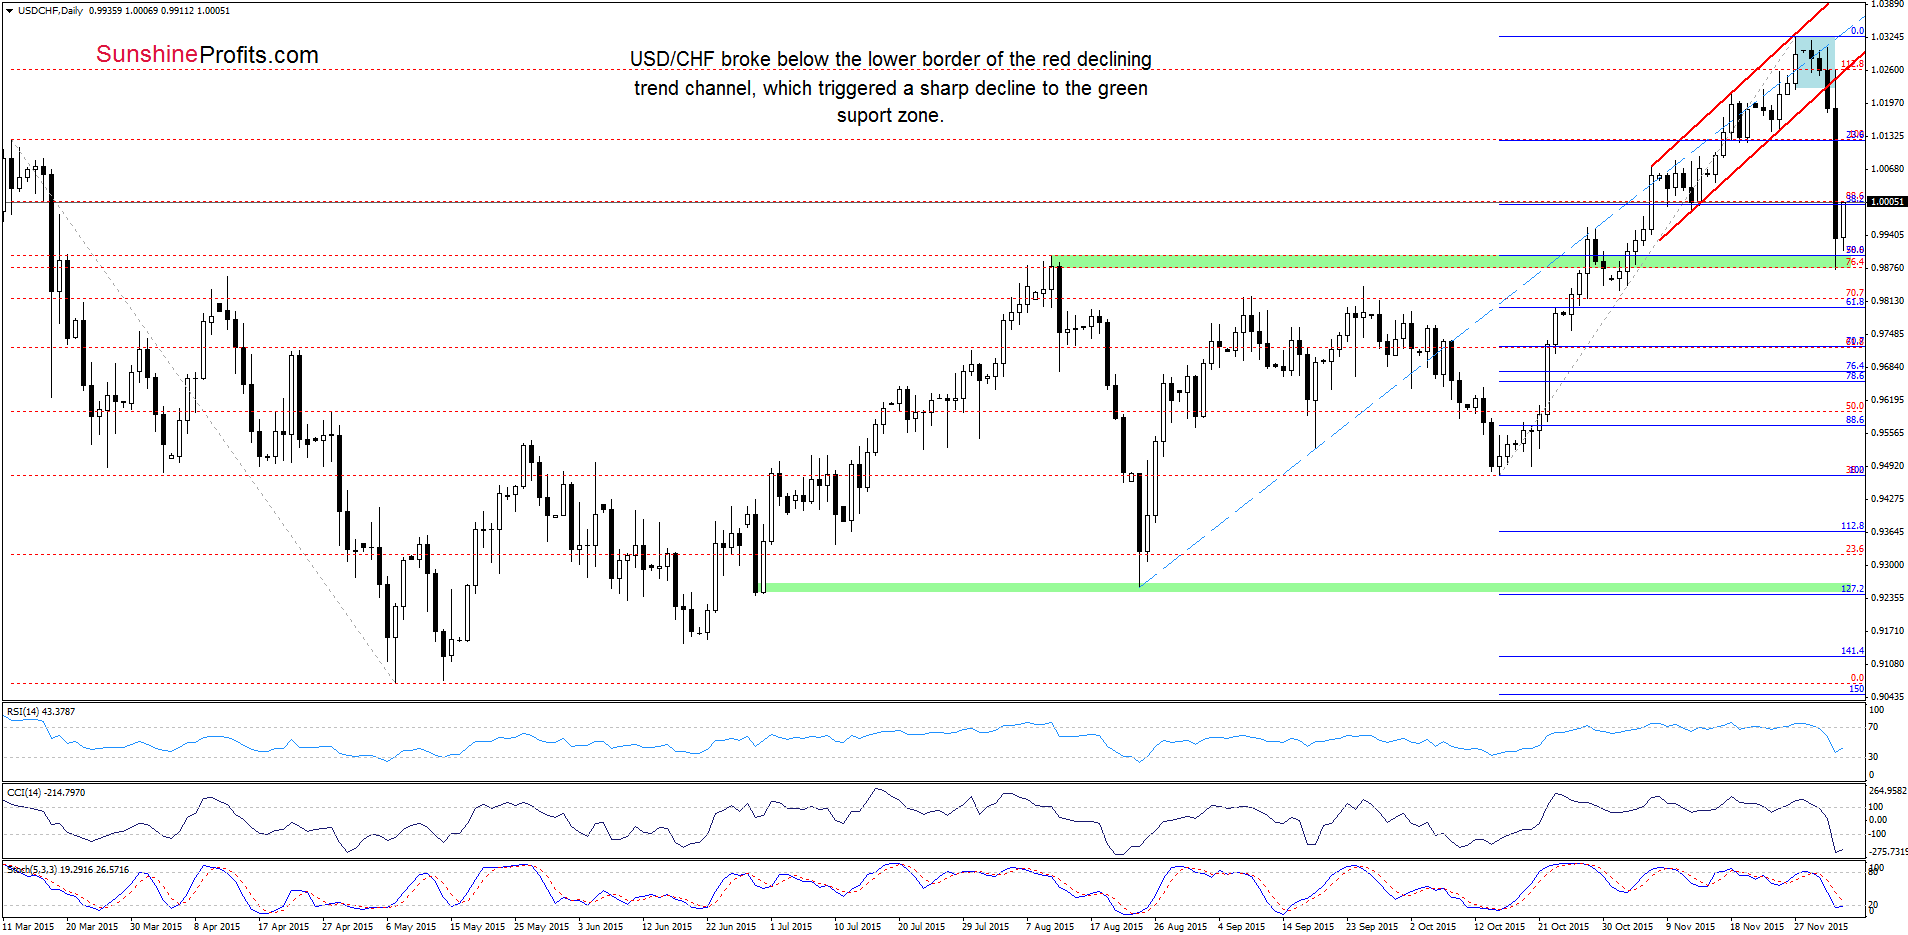
Quoting our last commentary:
(…) please keep in mind sell signals generated by the daily indicators, which could encourage currency bears to act in the coming day(s) – especially when we factor in the current position of the weekly indicators (they are overbought and very close to generating sell signals). In other words, a reversal in the coming days should not surprise us. If this is the case, and the exchange rate drops under 1.0224 (the lower border of the blue consolidation), the initial downside target would be around 1.0127, where the previously-broken March high is. If this support is broken, the next target for currency bears would be around 0.9988, where the bottom of the mid-Nov pullback is.
As you see on the daily chart, the situation developed in line with the above scenario and USD/CHF reversed and declined. With yesterday’s downswing currency bears not only took the pair to our initial downside targets, but also pushed the exchange rate to the green support zone based on the mid-Aug high and the 50% Fibonacci retracement (based on the mid-Oct-De rally). This support area triggered a rebound earlier today, which suggests that we may see an increase to around 1.0046, where the 38.2% Fibonacci retracement (based on the recent decline) is.
Very short-term outlook: mixed
Short-term outlook: mixed
MT outlook: mixed
LT outlook: mixed
Trading position (short-term; our opinion): No positions are justified from the risk/reward perspective at the moment. We will keep you informed should anything change, or should we see a confirmation/invalidation of the above.
AUD/USD
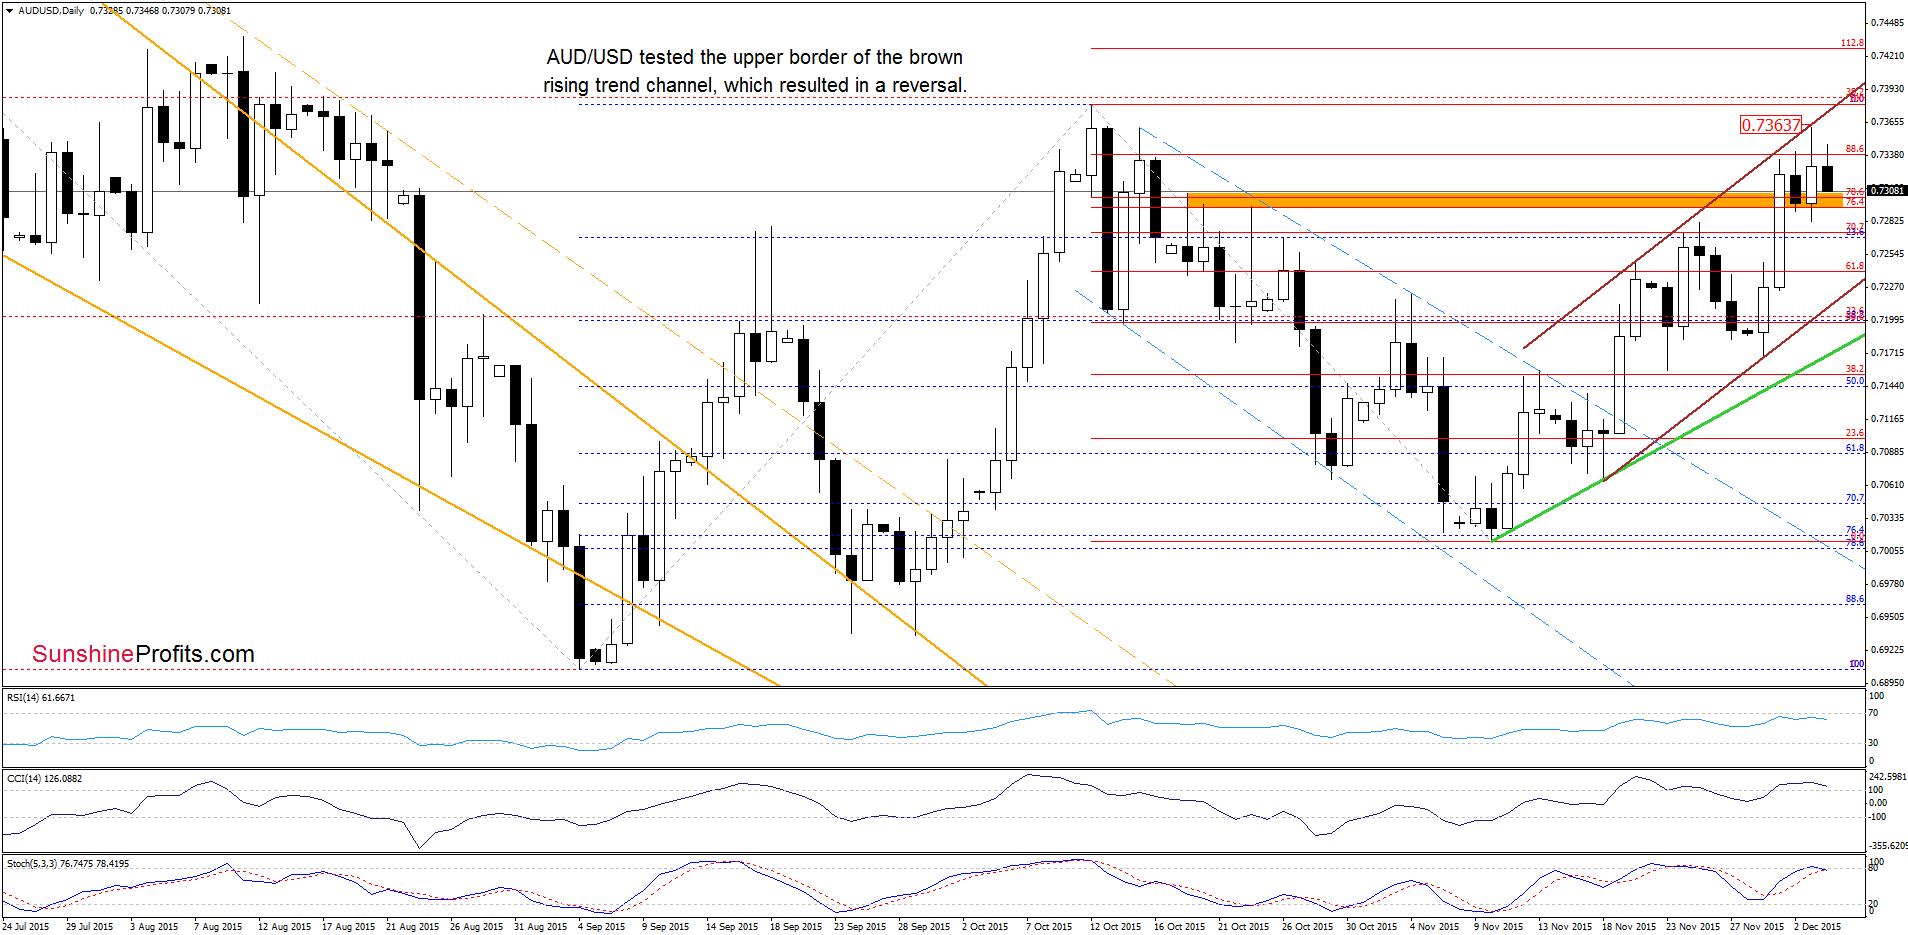
Yesterday, we wrote:
(…) AUD/USD moved higher and broke above the orange resistance zone (created by the Fibonacci retracements, the Oct 19, Oct 20 and Oct 23 highs), which is a positive signal that suggests further improvement and a test of the upper border of the brown rising trend channel (currently around 0.7363) in the coming days (please note that this scenario is supported by buy signals generated by the indicators).
Looking at the daily chart, we see that currency bulls pushed the pair to the upper border of the brown rising trend channel as we had expected. Despite this improvement, the proximity to the mid-Oct high in combination with the resistance line triggered a pullback earlier today. Taking this fact into account and the current position of the indicators (they are very close to generating sell signals), we think that further deterioration is just around the corner. Nevertheless, such price action will be more likely if we see an invalidation of the breakout above the orange zone.
Very short-term outlook: mixed
Short-term outlook: mixed
MT outlook: mixed
LT outlook: mixed
Trading position (short-term; our opinion): No positions are justified from the risk/reward perspective at the moment. We will keep you informed should anything change, or should we see a confirmation/invalidation of the above.
Thank you.
Nadia Simmons
Forex & Oil Trading Strategist
Forex Trading Alerts
Oil Investment Updates
Oil Trading Alerts

