

Earlier today, the U.S. Bureau of Economic Analysis showed that personal spending rose 0.4% in August, beating expectations for an increase of 0.3%, while U.S. personal income rose by 0.3%. Thanks to these bullish numbers, the USD Index moved higher once again, approaching Friday’s high, but did it change anything in the short-term picture of USD/JPY?
In our opinion the following forex trading positions are justified - summary:
- EUR/USD: short (a stop-loss order at 1.1887; the downside target around 1.0938)
- GBP/USD: none
- USD/JPY: none
- USD/CAD: none
- USD/CHF: none
- AUD/USD: none
EUR/USD
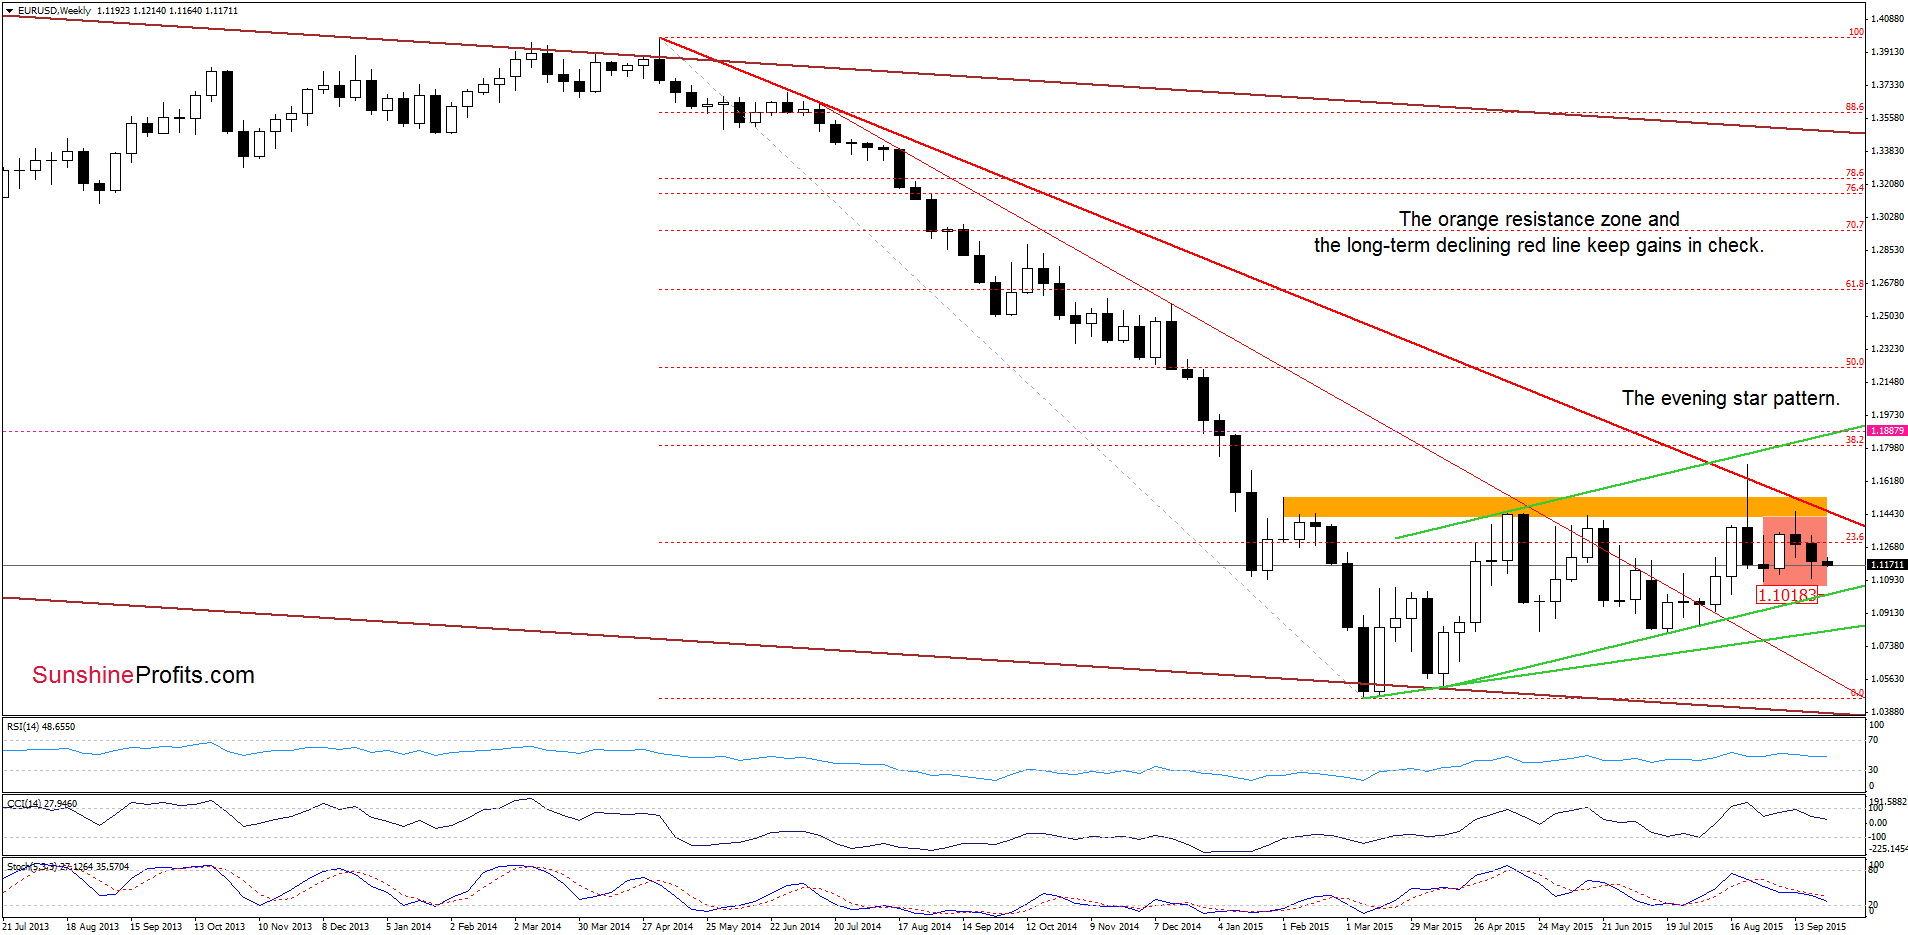
Although EUR/USD increased slightly on Friday, recent candlesticks formed an evening star pattern, which usually occurring at the top of upward moves. This means that the bearish candlesticks formation will strengthen the orange resistance zone in the coming weeks, encouraging currency bears to act. Additionally, sell signals generated by the indicators remain in place, suggesting further deterioration.
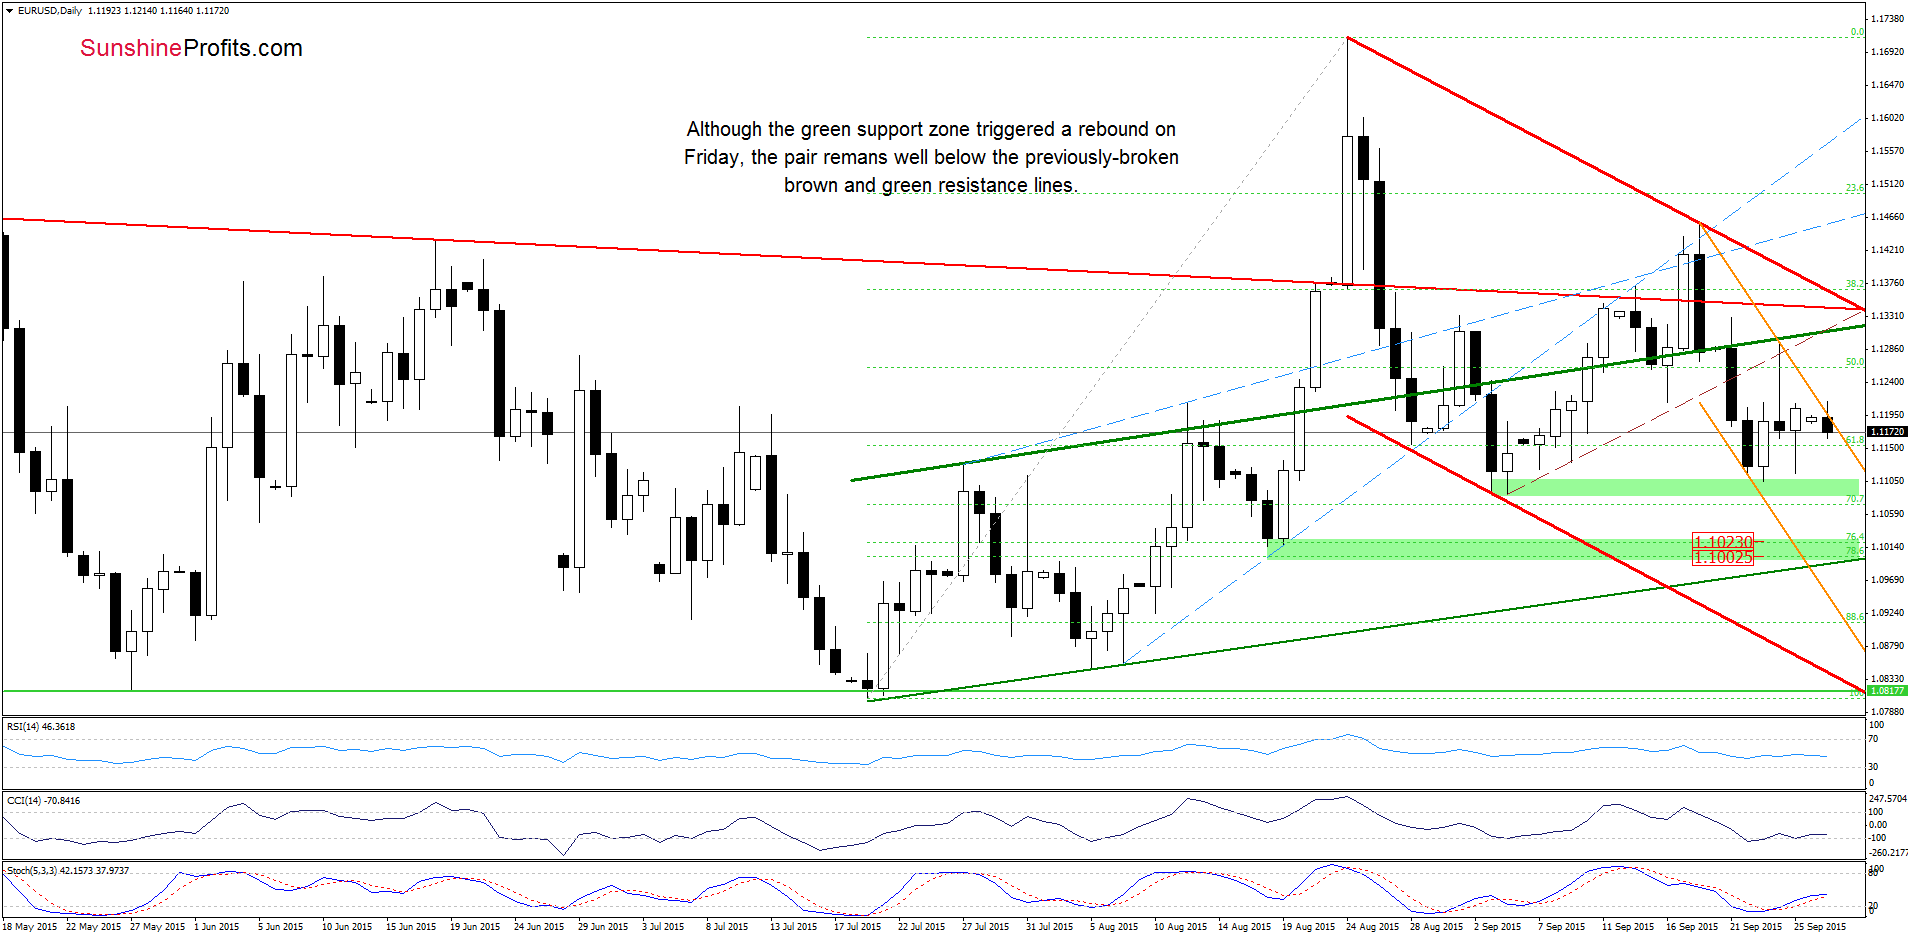
Having said that, let’s examine the daily chart and find out what can we infer from it.
Quoting our previous alert:
(…) the exchange rate verified earlier breakdown, which was a bearish signal. Thanks to these circumstances, the pair extended losses earlier today, which means that we’ll see likely see another test of the green support zone in near future.
As you see on the daily chart, currency bears pushed the exchange rate lower as we had expected. However, the green support zone triggered another rebound – similarly to what we saw on Wednesday. Despite this upswing, the orange declining resistance line (the upper border of the declining trend channel) stopped further improvement earlier today. As a result, EUR/USD moved lower, which suggests that lower values of the exchange rate are just around the corner. How low could the pair go? In our opinion, the initial downside target would be around 1.100, where the next green support zone (based on the 76.4% and 78.6% Fibonacci retracement levels) is.
Very short-term outlook: bearish
Short-term outlook: bearish
MT outlook: mixed with bearish bias
LT outlook: mixed
Trading position (short-term; our opinion): Short positions with a stop-loss order at 1.1887 are justified from the risk/reward perspective. We will keep you informed should anything change, or should we see a confirmation/invalidation of the above.
USD/JPY
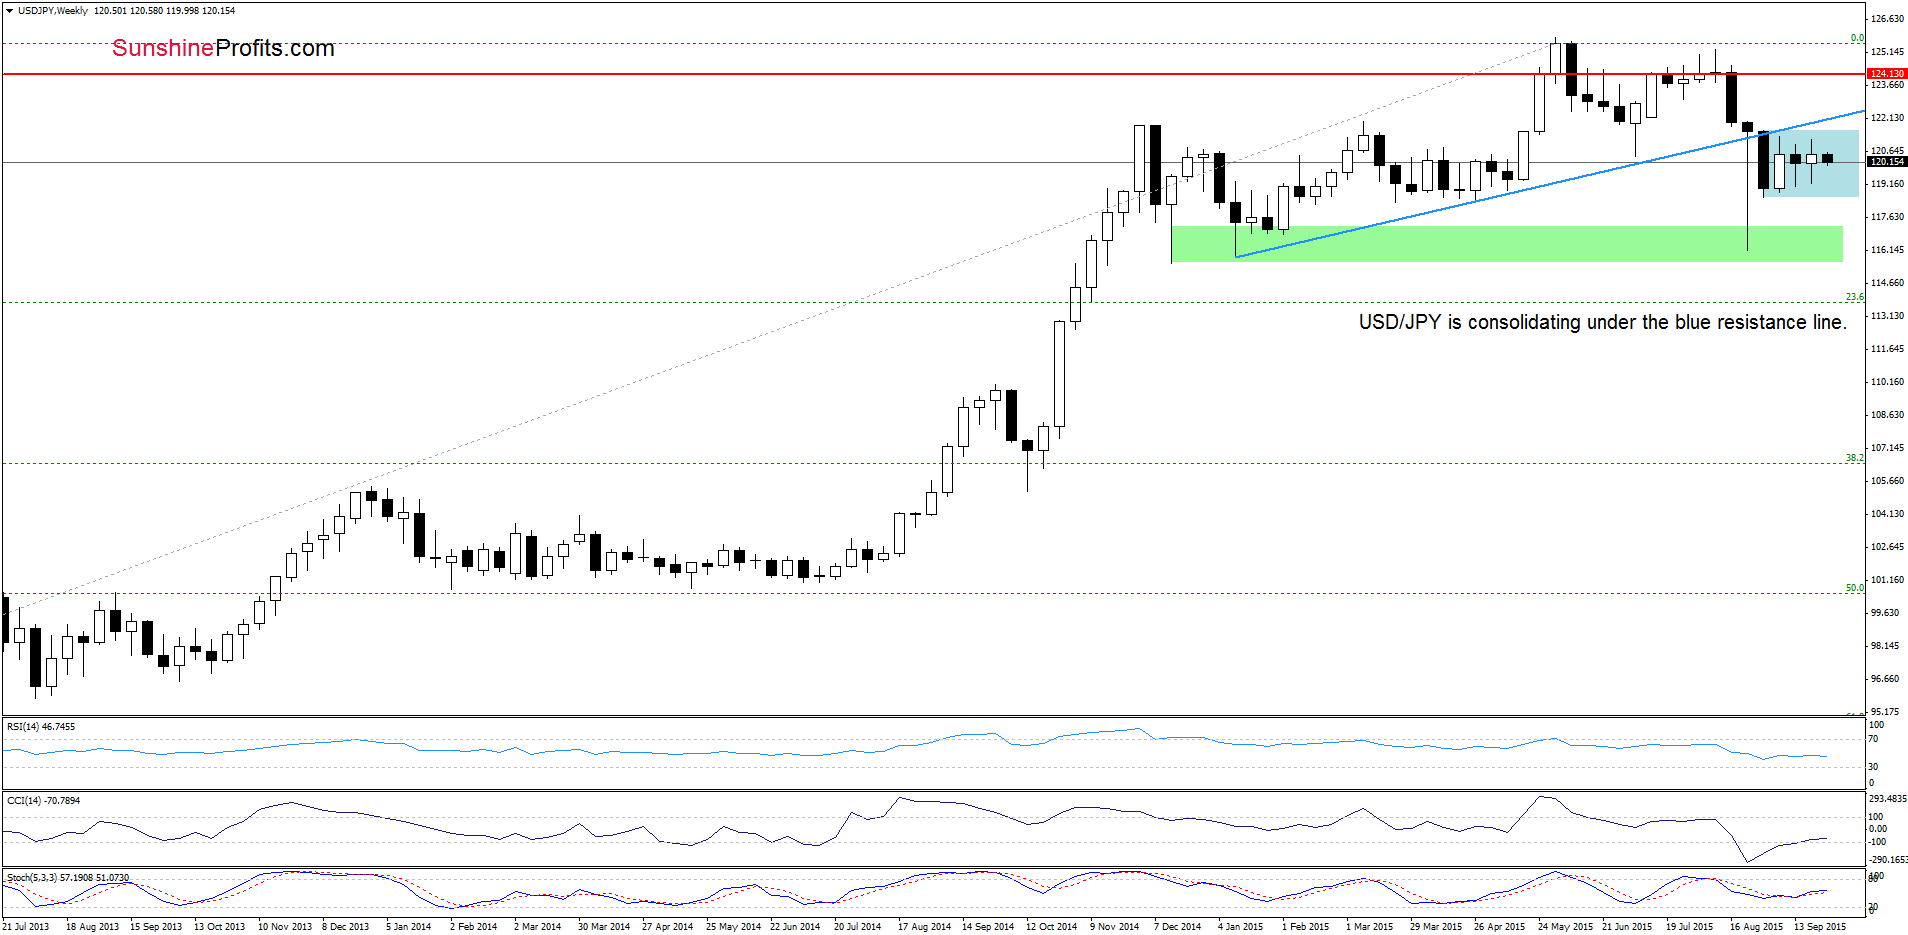
The situation in the medium-term hasn’t changed much as USD/JPY is still trading in the consolidation under the blue resistance line, which makes the picture a bit unclear.
Will the daily chart give us more clues about future moves? Let’s check.
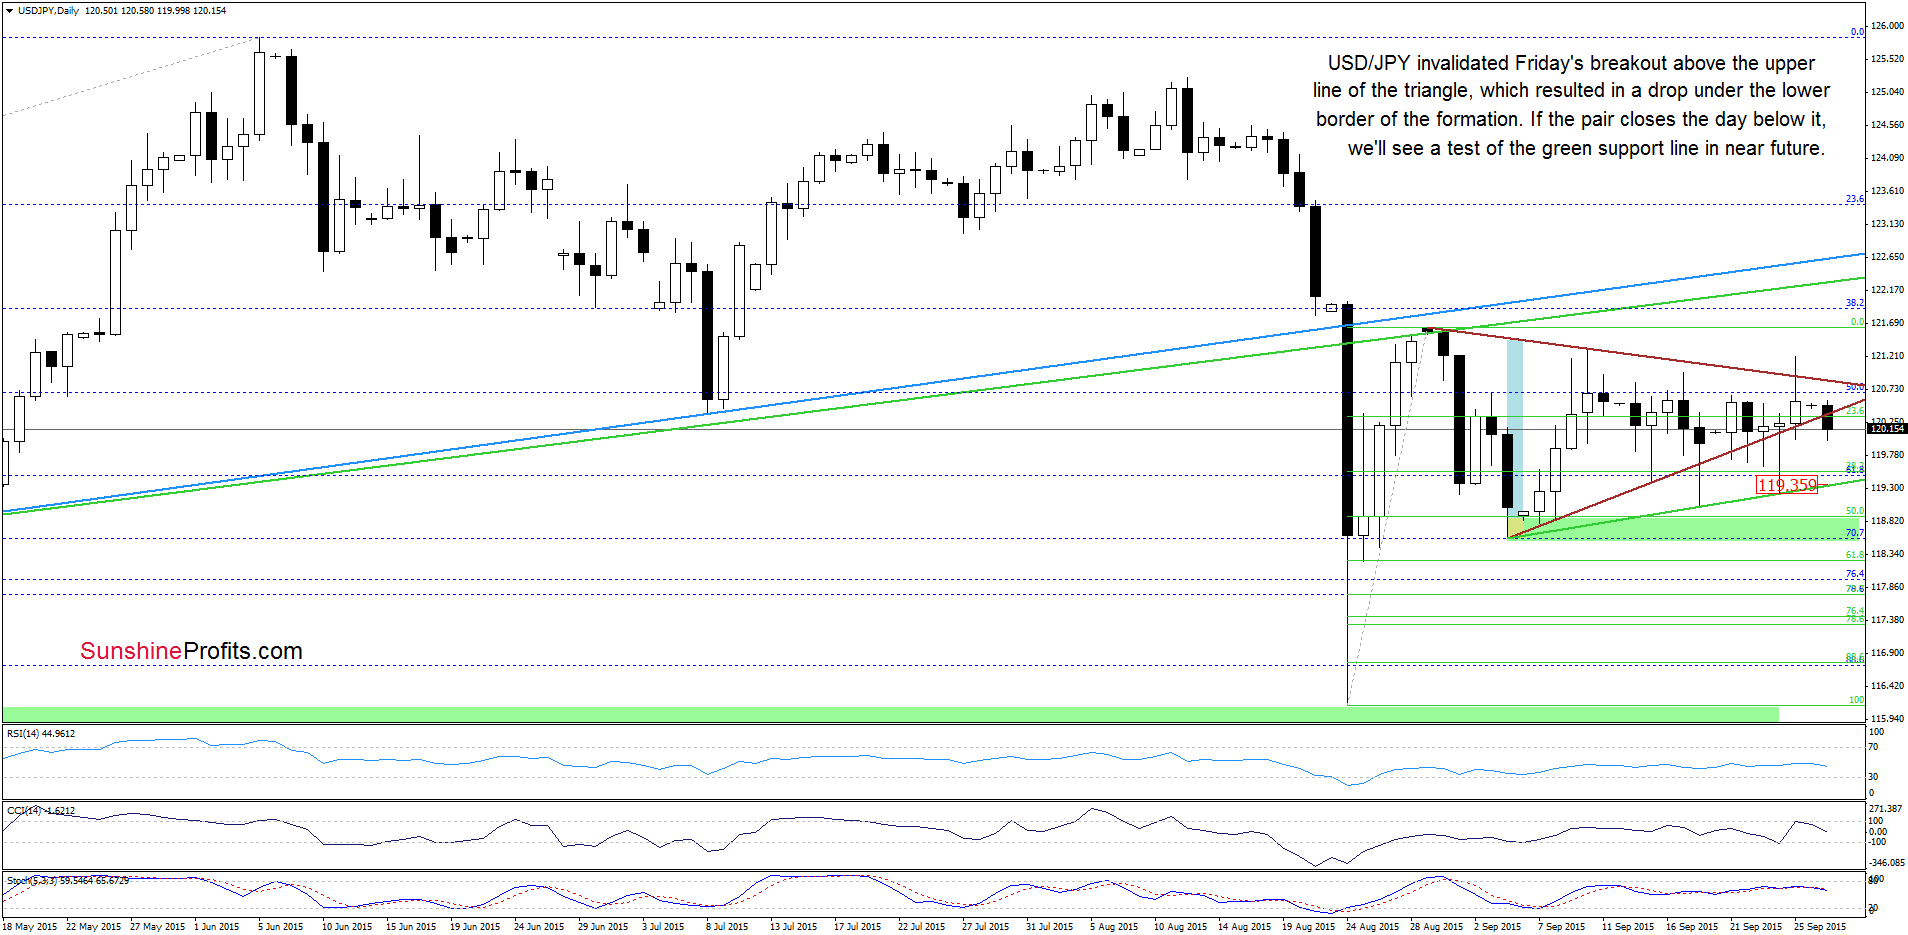
From today’s point of view, we see that although USD/JPY moved sharply higher on Friday, currency bulls didn’t manage to hold gained levels, which resulted in a reverse and a comeback to the triangle. An invalidation of the breakout encouraged currency bears to act earlier today, which translated to a drop under the lower line of the formation. At this point, it is worth noting that we saw similar price action several times in previous days. As you see, all attempts to close the day under the brown support line failed. Nevertheless, taking into account sell signals generated by the indicators, it seems to us that currency bears will try once again. If they succeed, the initial downside target would be around 119.36, where the green support line (based on previous lows) is.
Very short-term outlook: mixed with bearish bias
Short-term outlook: mixed
MT outlook: mixed
LT outlook: mixed
Trading position (short-term; our opinion): No positions are justified from the risk/reward perspective at the moment. We will keep you informed should anything change, or should we see a confirmation/invalidation of the above.
USD/CHF
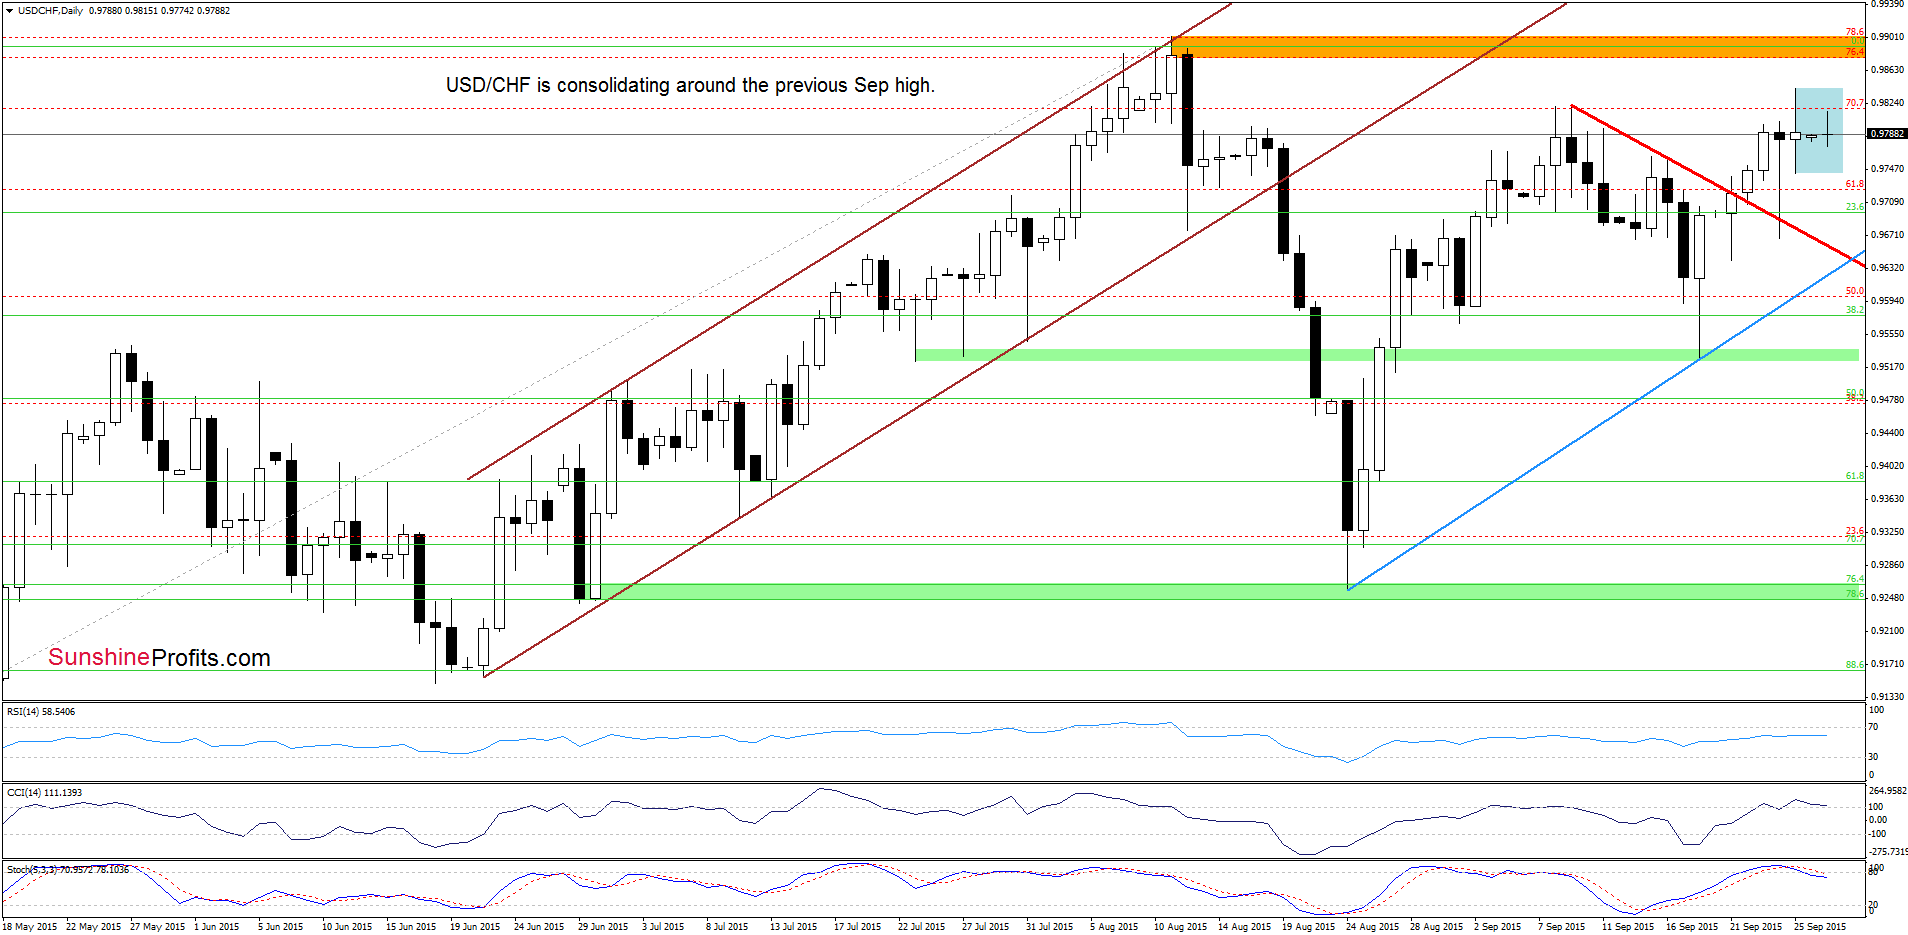
On the above chart, we see that USD/CHF hit a fresh Sep high on Friday, but then reversed, closing the week below the previous high. Despite this deterioration, the exchange rate is consolidating slightly below the Sep high, which suggests that another attempt to move higher should not surprise us.
Will we see a test of the Aug high? Let’s check the weekly chart and look for more clues.
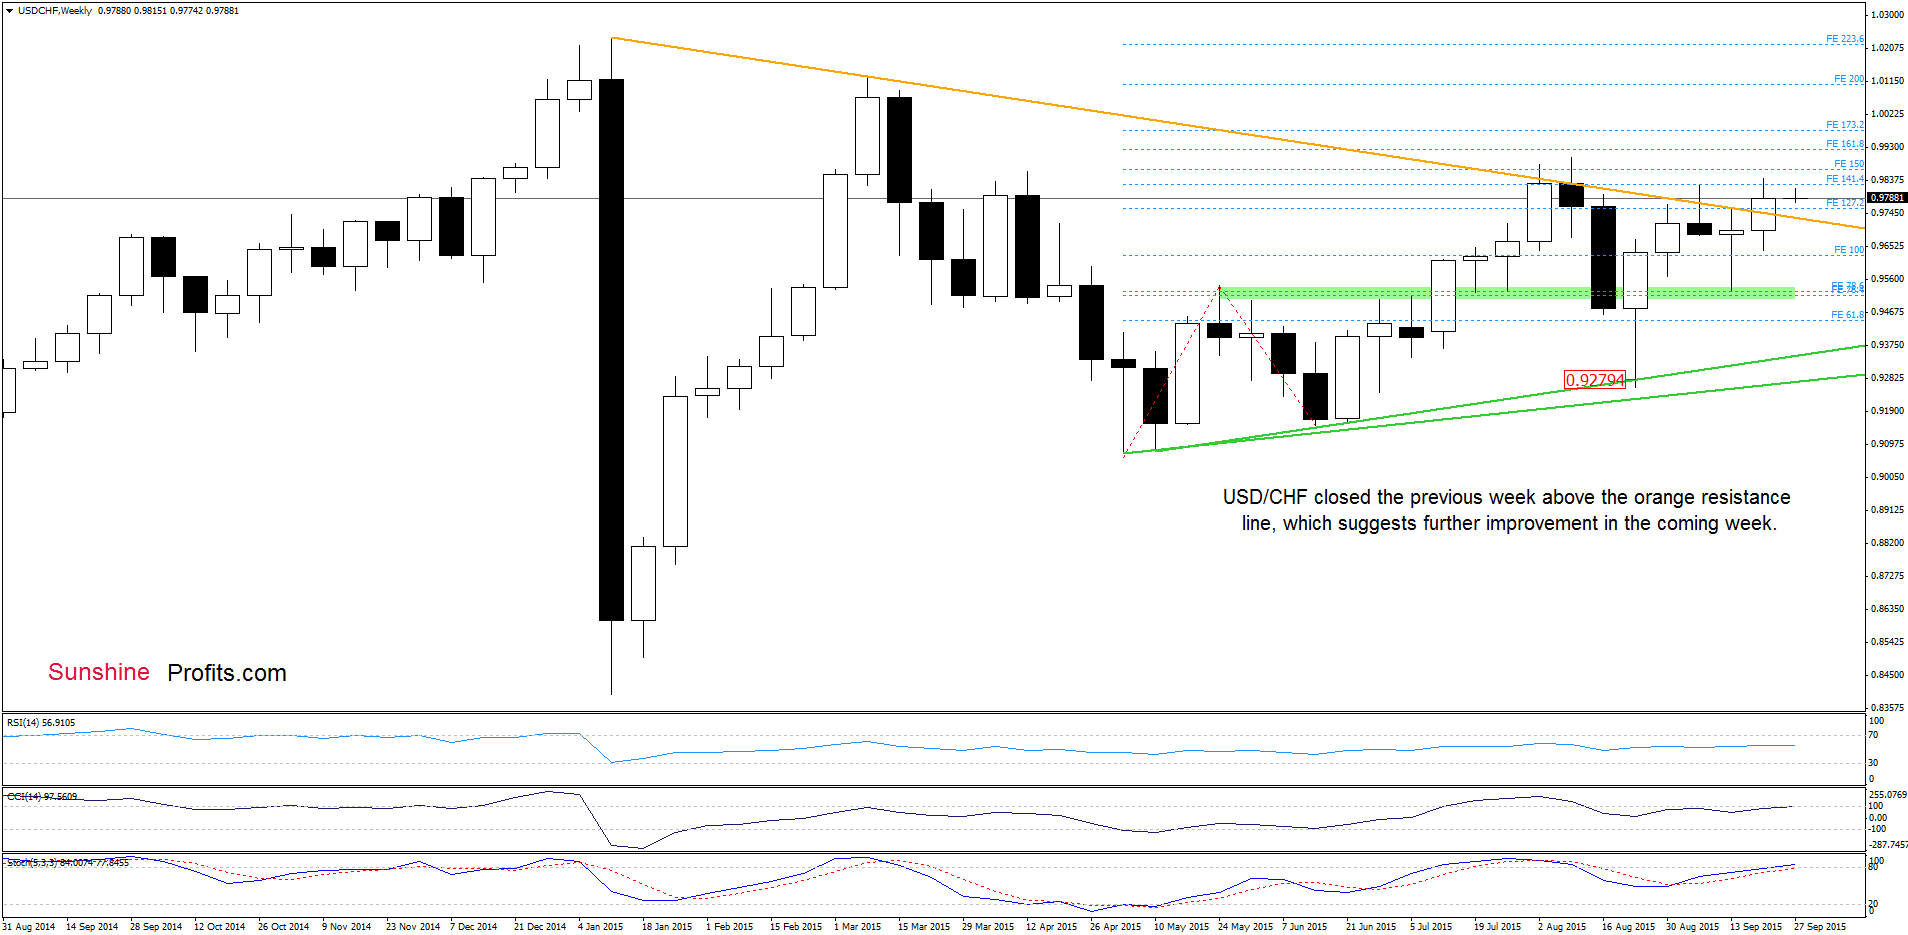
The first thing that catches the eye on the above chart is a breakout above the orange resistance line. On top of that, the exchange rate closed the previous week above it. This is a bullish signal, which suggests that as long as there is no invalidation of the breakout above the orange line further improvement is likely.
Very short-term outlook: mixed with bullish bias
Short-term outlook: mixed
MT outlook: mixed
LT outlook: mixed
Trading position (short-term; our opinion): No positions are justified from the risk/reward perspective at the moment. We will keep you informed should anything change, or should we see a confirmation/invalidation of the above.
Thank you.
Nadia Simmons
Forex & Oil Trading Strategist
Przemyslaw Radomski, CFA
Founder, Editor-in-chief
Gold & Silver Trading Alerts
Forex Trading Alerts
Oil Investment Updates
Oil Trading Alerts

