

Yesterday, the U.S. Bureau of Labor Statistics showed that U.S. import prices fell by 1.9% in August, while export prices declined by 1.4% - far below expectations for a 0.4% drop. Thanks to these disappointing numbers, the USD Index moved lower, hitting a weekly low of 95.39. What impact did this drop have on the short-term picture of our six currency pairs?
In our opinion the following forex trading positions are justified - summary:
- EUR/USD: short (a stop-loss order at 1.1445; the downside target around 1.0938)
- GBP/USD: none
- USD/JPY: none
- USD/CAD: none
- USD/CHF: none
- AUD/USD: none
EUR/USD
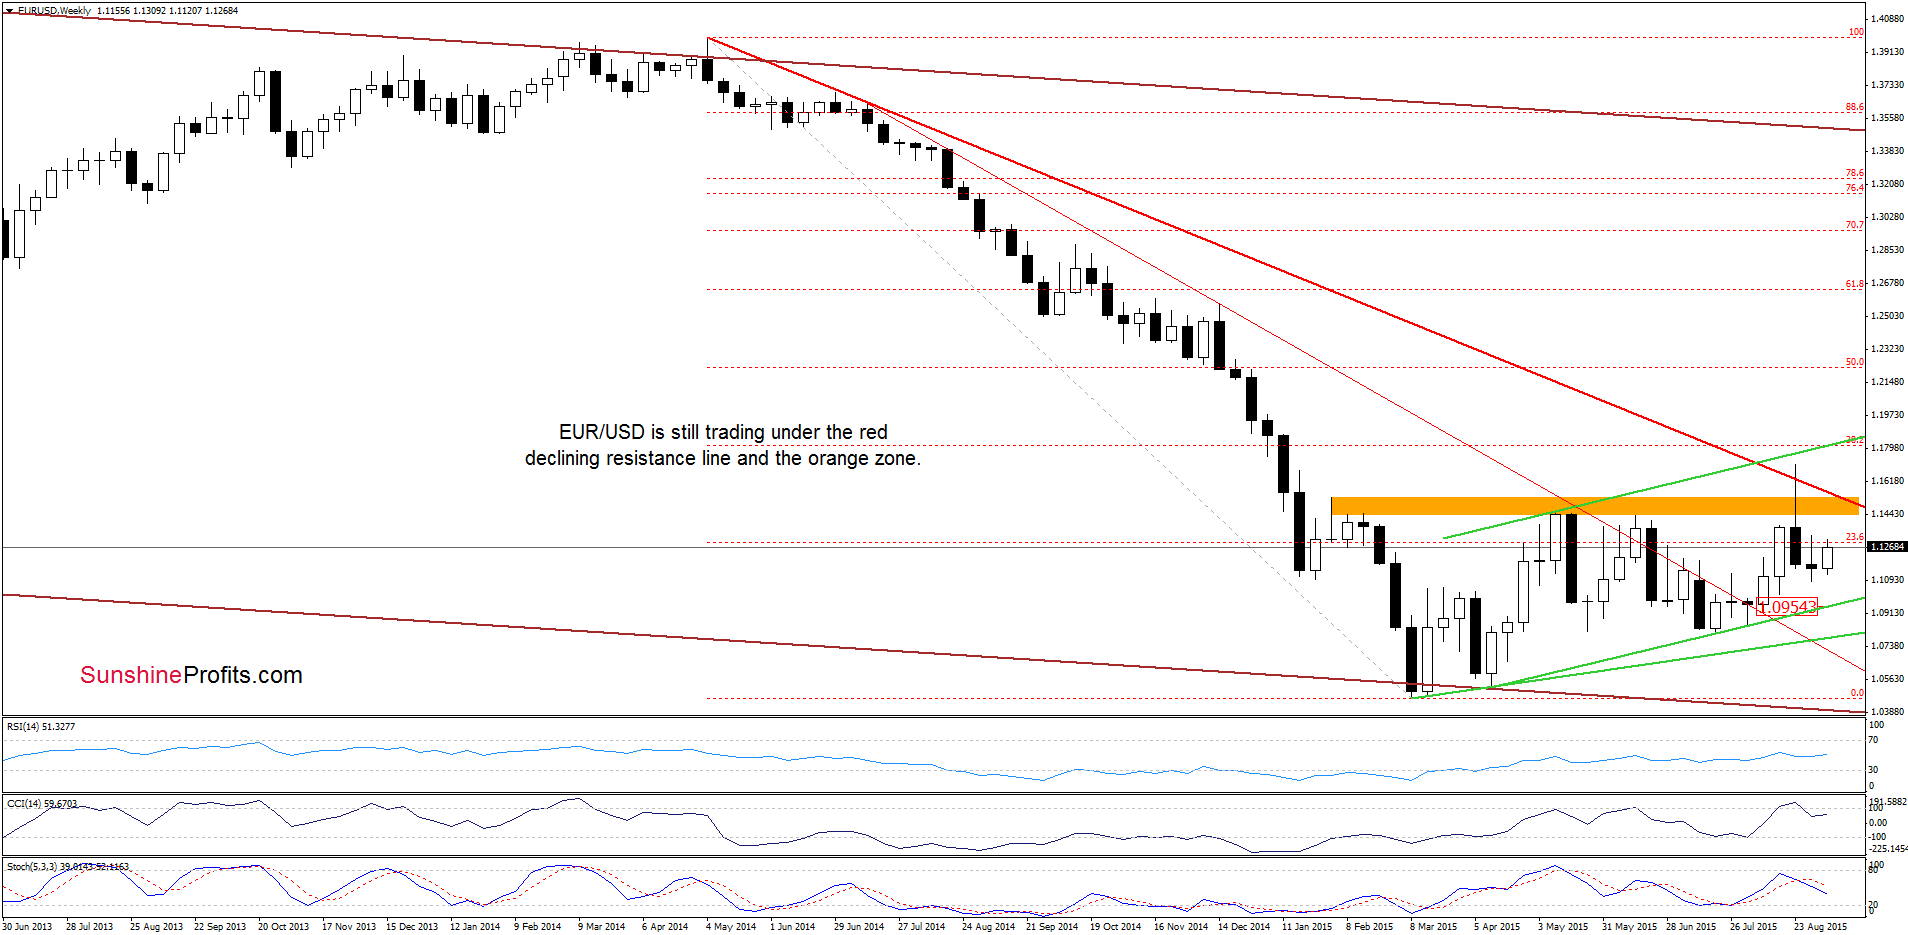
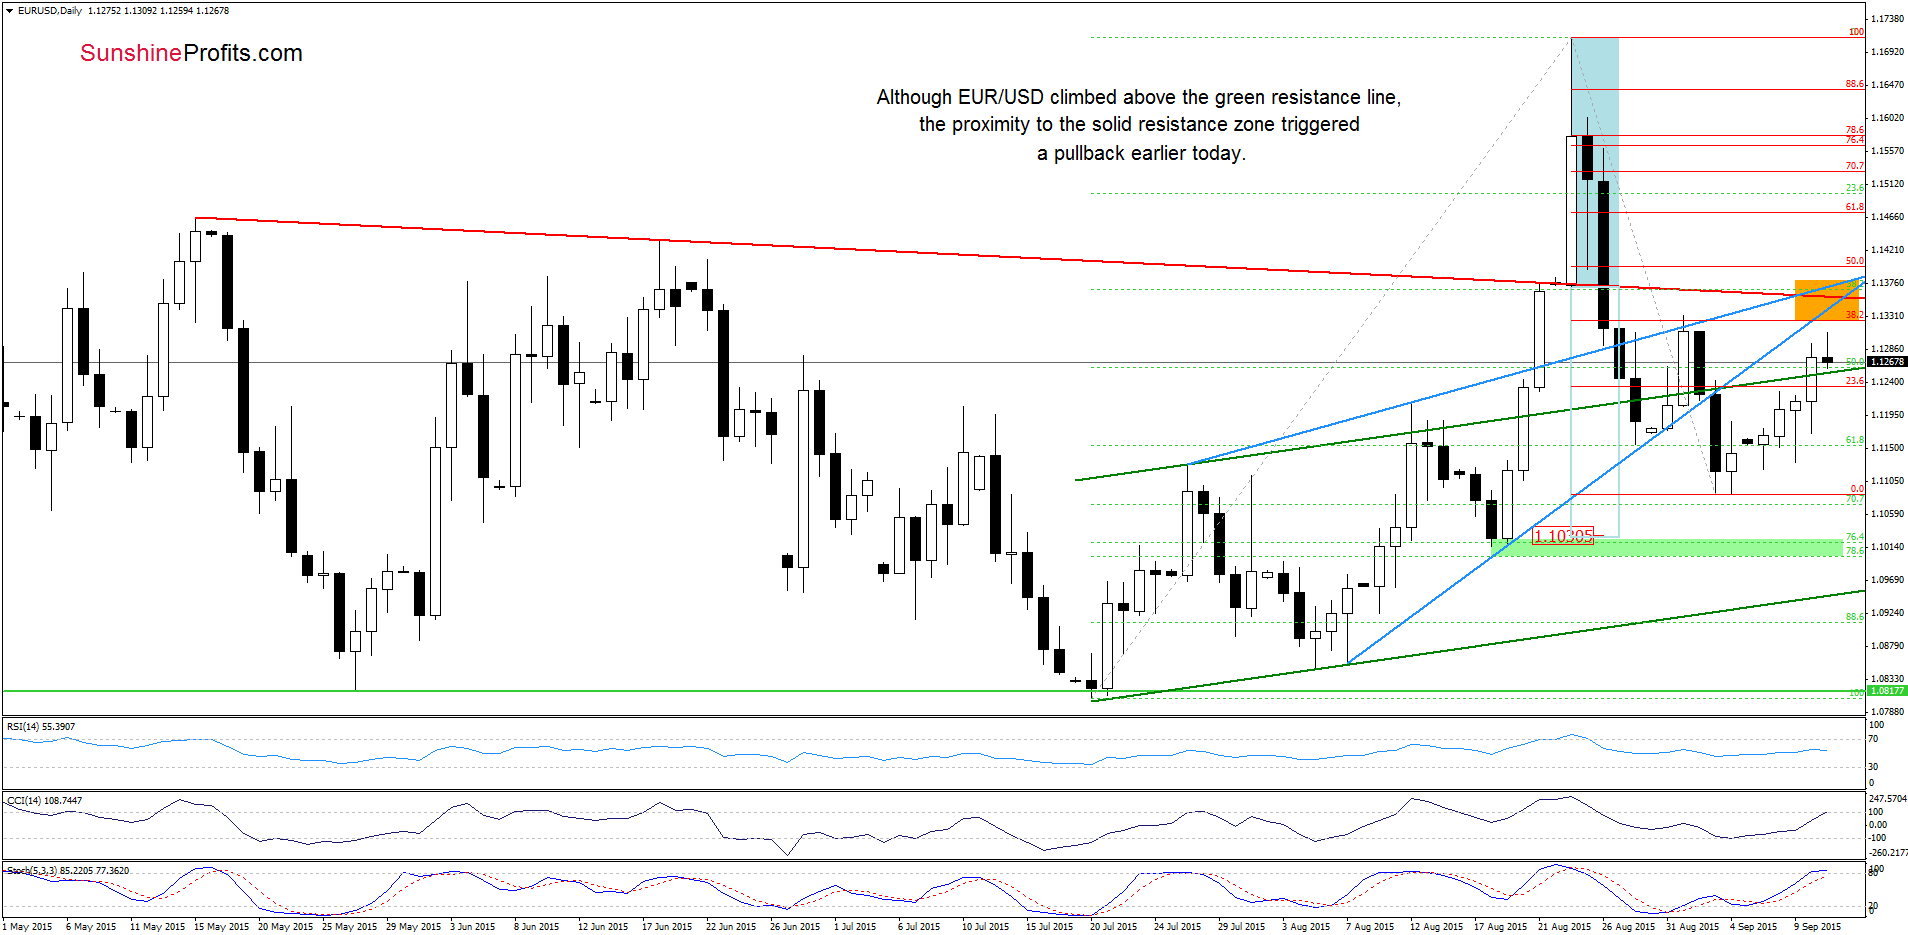
Looking at the daily chart we see that EUR/USD extended gains and broke above the upper border of the green rising trend channel, which triggered further improvement and approached the exchange rate to the 38.2% Fibonacci retracement. As you see, the proximity to this resistance level encouraged currency bears to act, which resulted in a pullback earlier today. What’s next? Taking into account the current position of the indicators, it seems that currency bulls will try to push the pair higher once again. Nevertheless, even if they succeed, we should keep in mind that EUR/USD remains under solid orange resistance zone (created by the upper and lower border of the rising wedge, the above-mentioned Fibonacci retracement and also the red declining resistance line), which, in our opinion, will stop further rally in the coming day(s).
Very short-term outlook: bearish
Short-term outlook: bearish
MT outlook: mixed with bearish bias
LT outlook: mixed
Trading position (short-term; our opinion): Short positions with a stop-loss order at 1.1445 are justified from the risk/reward perspective. The downside target around 1.0938. We will keep you informed should anything change, or should we see a confirmation/invalidation of the above.
GBP/USD
In our last commentary on this currency pair, we wrote the following:
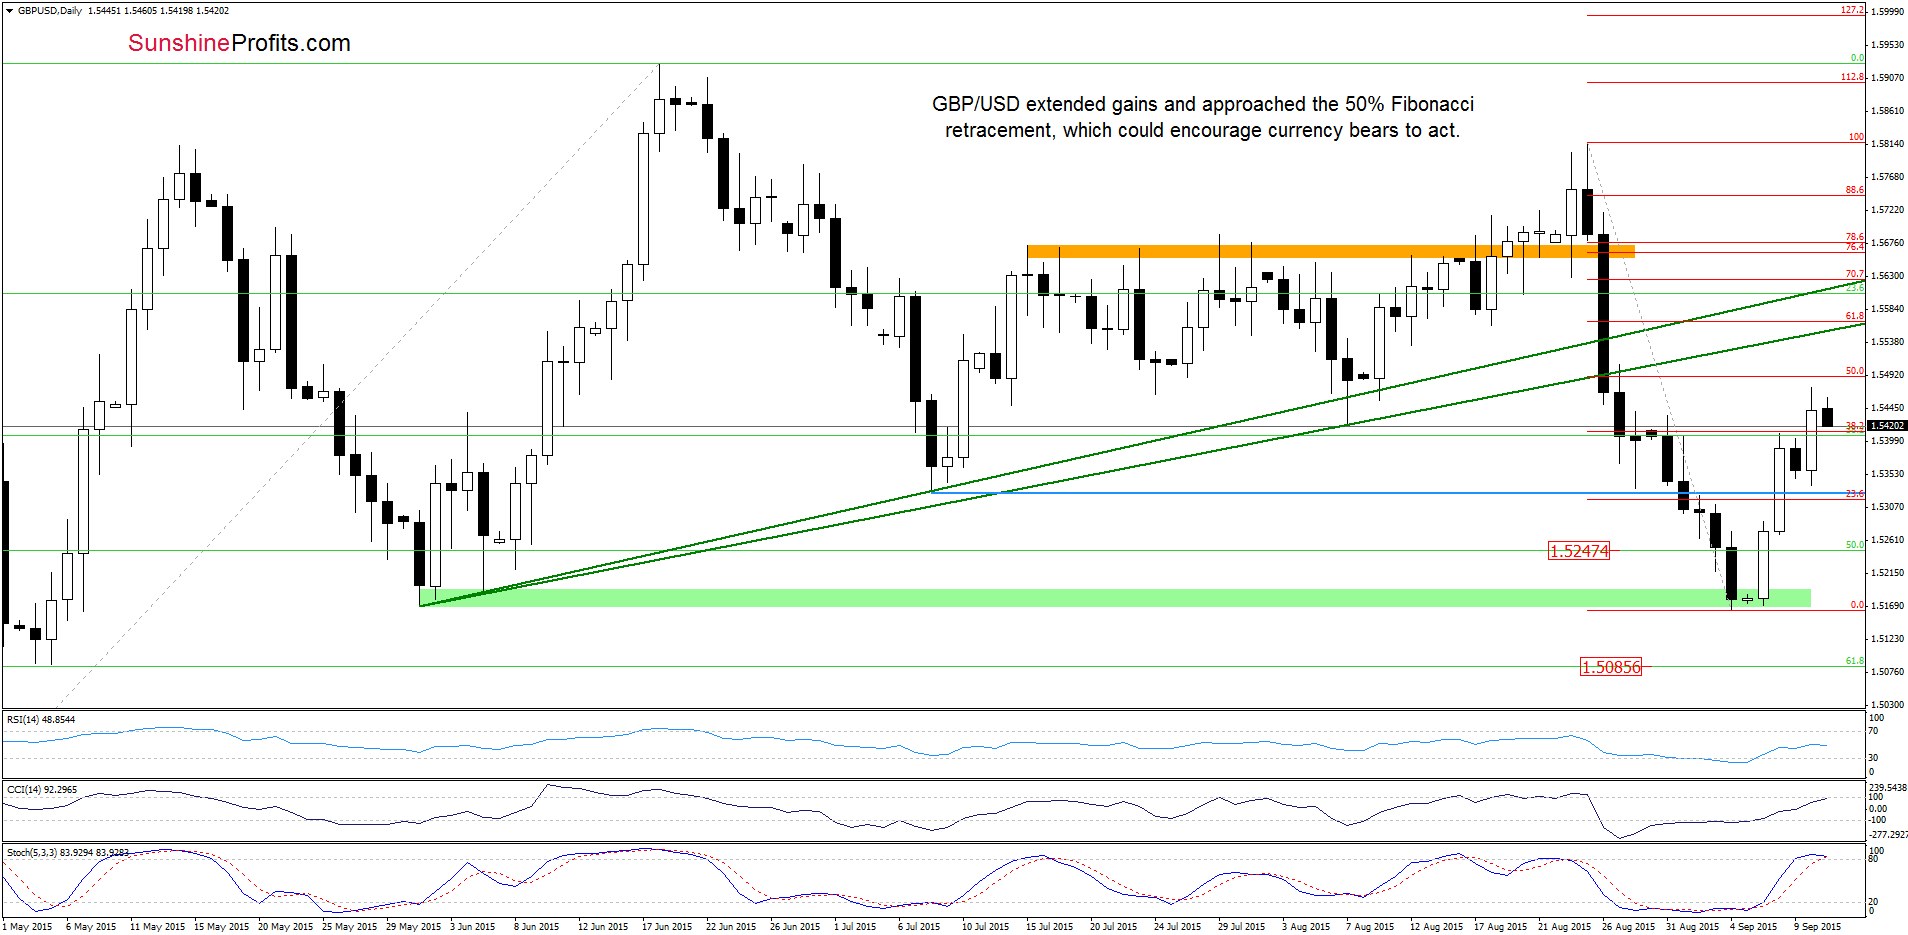
(…) the exchange rate invalidated the breakdown under the Jul 8 low, which resulted in a climb to the 38.2% Fibonacci retracement based on the Aug-Sep decline. What’s next? The current position of the indicators suggests further improvement and a test of the next retracement (as buy signals remain in place).
From today’s point of view we see that currency bulls pushed GBP/USD higher, which resulted in a breakout above the 38.2% Fibonacci retracement. But will we see a test of the next retracement? We think that the weekly chart will give us an answer to this question.
In our last commentary, we wrote:
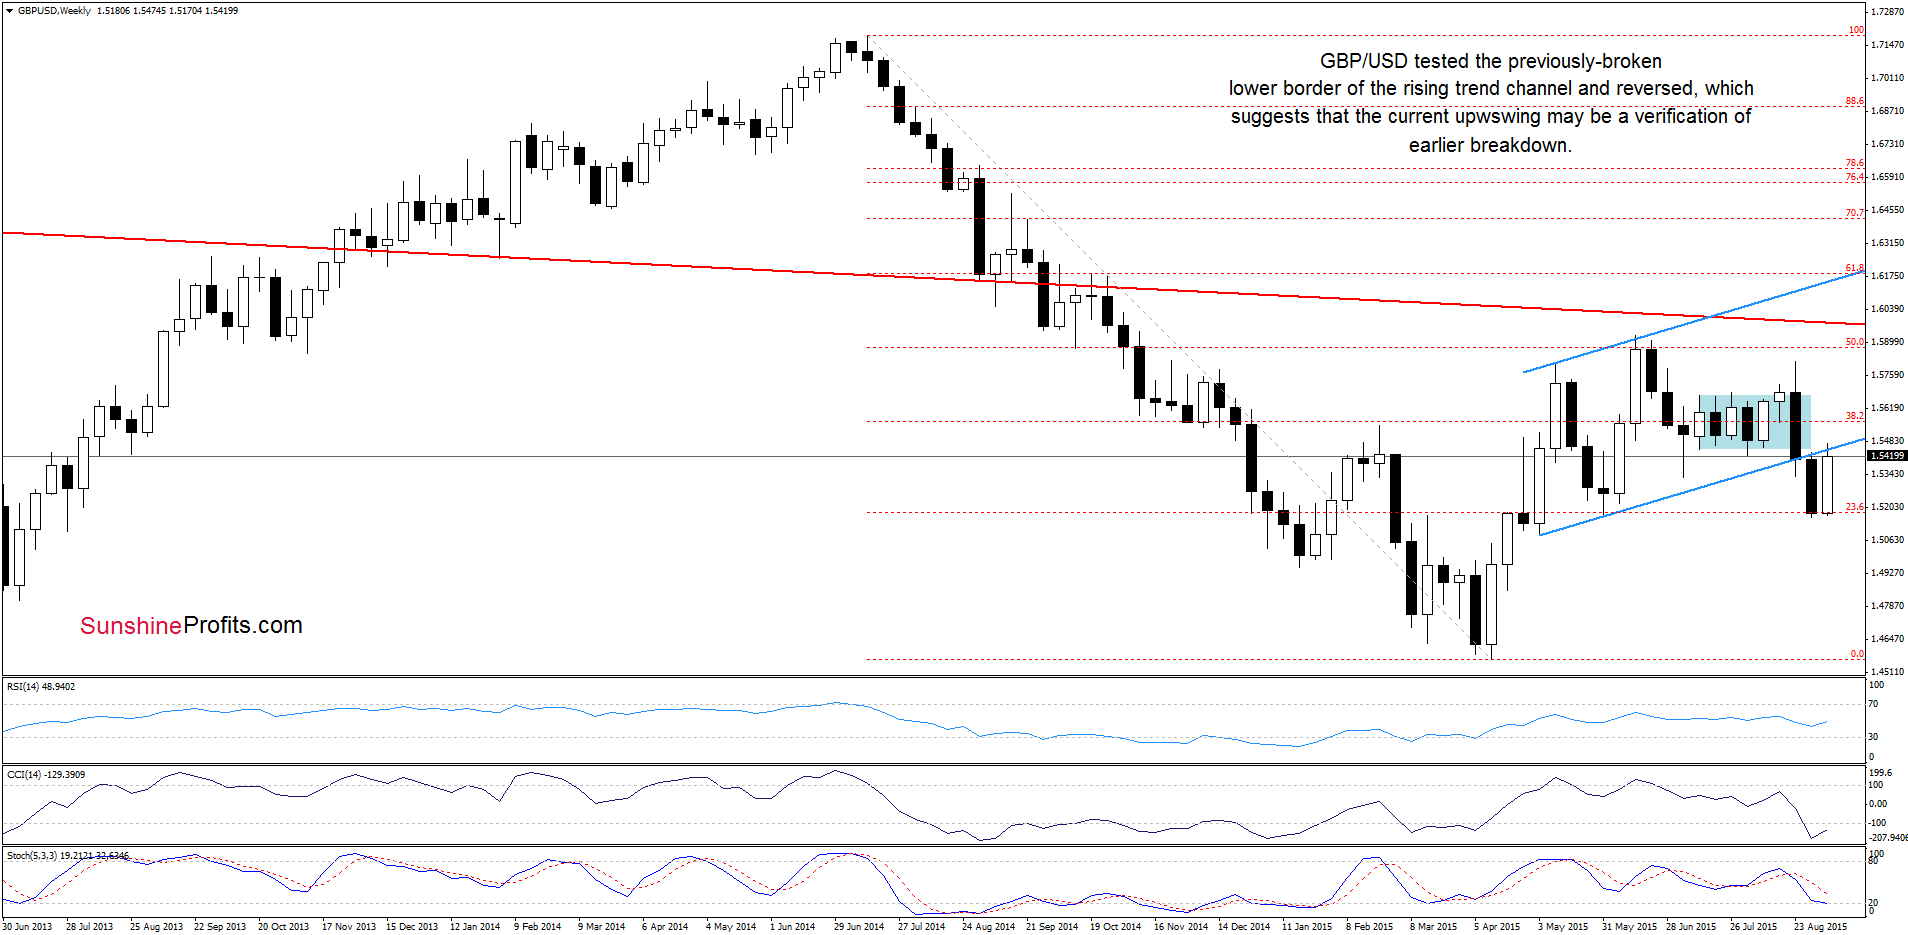
GBP/USD reversed and rebounded, approaching the previously-broken lower border of the rising trend channel, which suggests that the current upward move may be just a verification of earlier breakdown (especially when we factor in the position of the indicators) and lower values of the exchange rate are still ahead us.
As you see on the chart, although GBP/USD climbed above the broken lower border of the rising trend channel, the pair reversed and is currently trading below it, which increases the probability of a reversal in the coming week (especially if the pair closes the week under the blue resistance line). If we see such price action, the initial downside target would be the Jul 8 low of 1.5328 (marked on the daily chart).
Very short-term outlook: mixed
Short-term outlook: mixed
MT outlook: mixed
LT outlook: mixed
Trading position (short-term; our opinion): No positions are justified from the risk/reward perspective at the moment. We will keep you informed should anything change, or should we see a confirmation/invalidation of the above.
USD/JPY
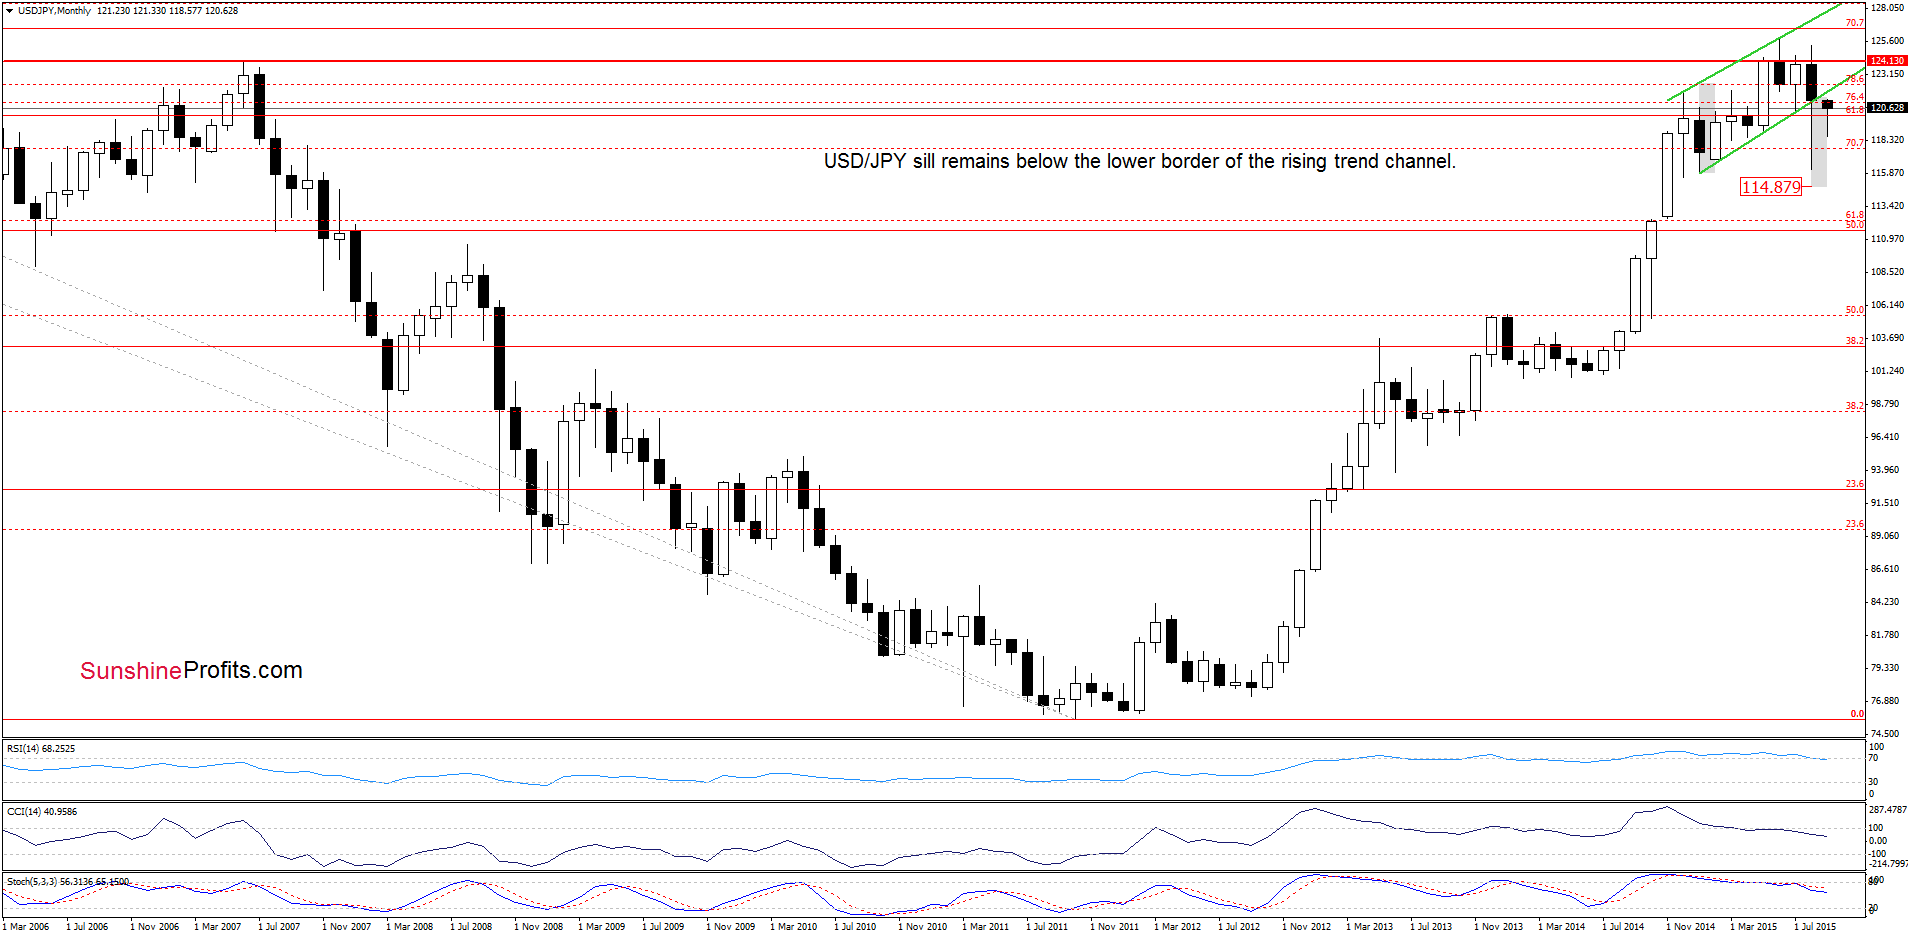
The situation in the medium-term hasn’t changed much as USD/JPY is still trading under the lower border of the rising trend channel. Today, we’ll focus on the very short-term picture.
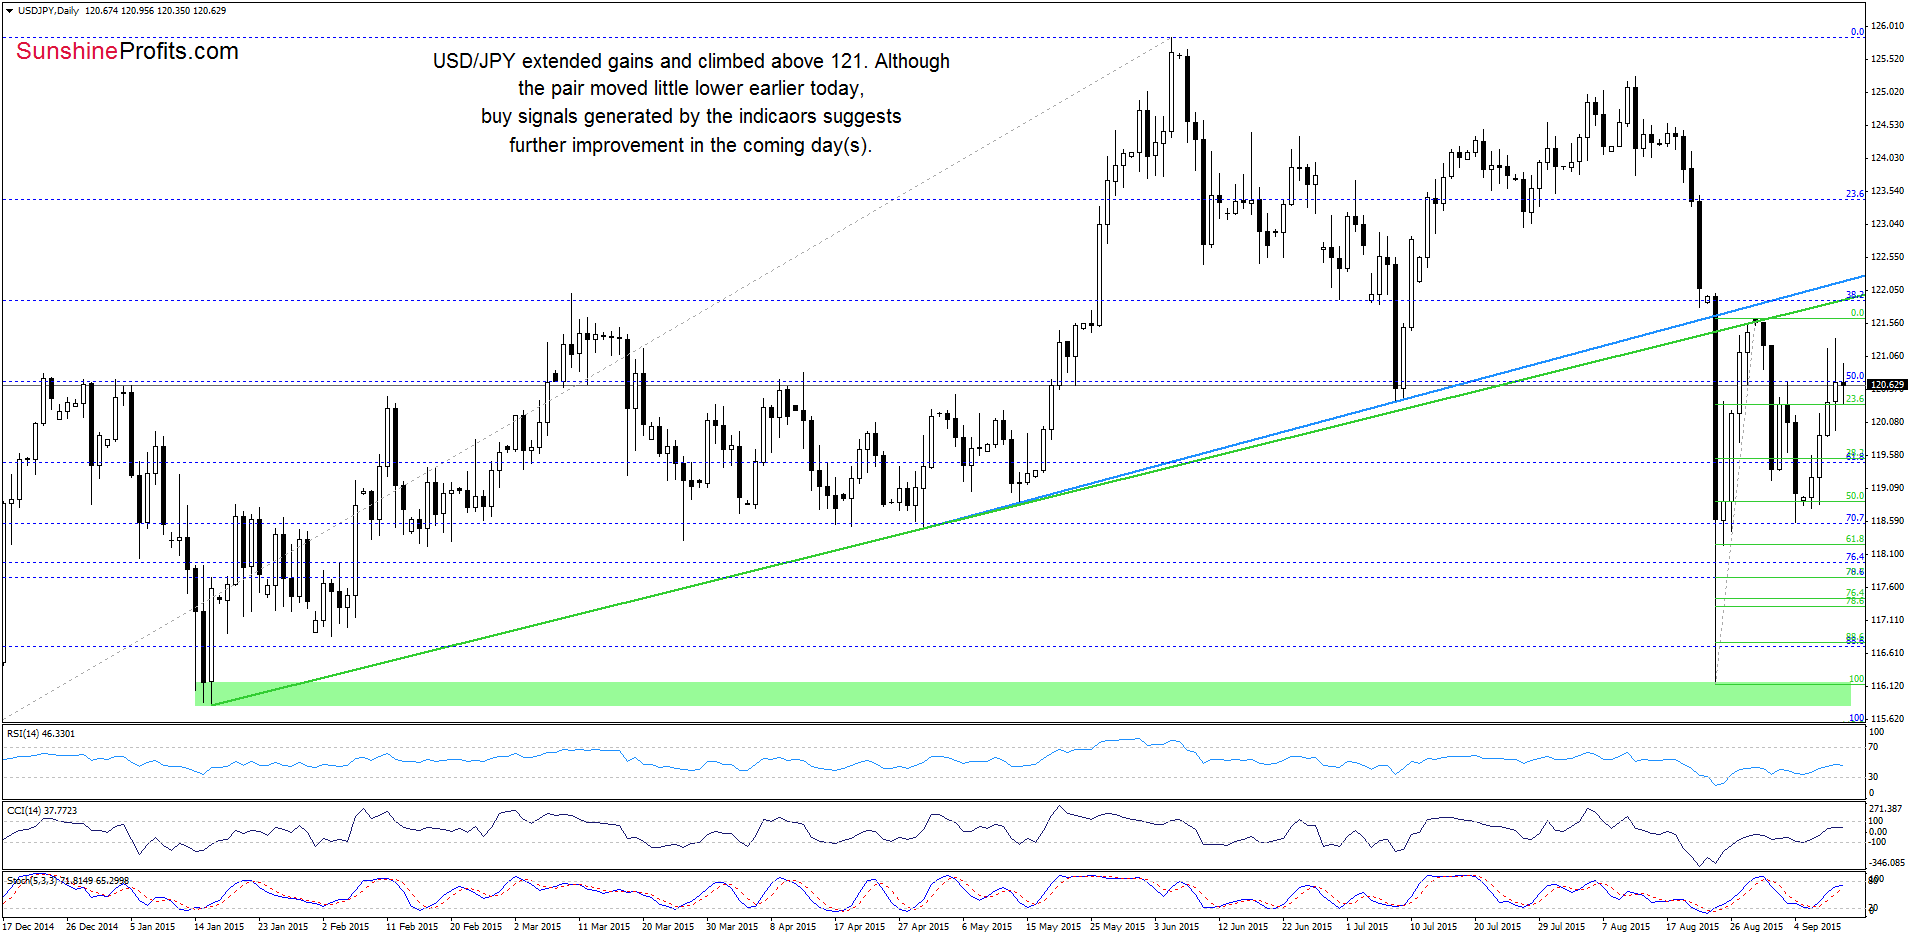
As you see on the daily chart although USD/JPY moved little lower earlier today, the current position of the indicators suggests that currency bulls will try to push the pair higher in the coming week. How high could the exchange rate go? If we see a climb above yesterday’s high, the next upside target would be around 121.63-121.82, where the Aug 30 and the previously-broken green resistance line are. At this point, it is worth noting that this area is also reinforced by the lower border of the green rising trend channel marked on the long-term chart (around 121.75).
Very short-term outlook: mixed with bullish bias
Short-term outlook: mixed
MT outlook: mixed
LT outlook: mixed
Trading position (short-term; our opinion): No positions are justified from the risk/reward perspective at the moment. We will keep you informed should anything change, or should we see a confirmation/invalidation of the above.
USD/CAD
The medium-term picture hasn’t changed much as USD/CAD is trading above the 2008 high. Today, we’ll focus on the daily chart.
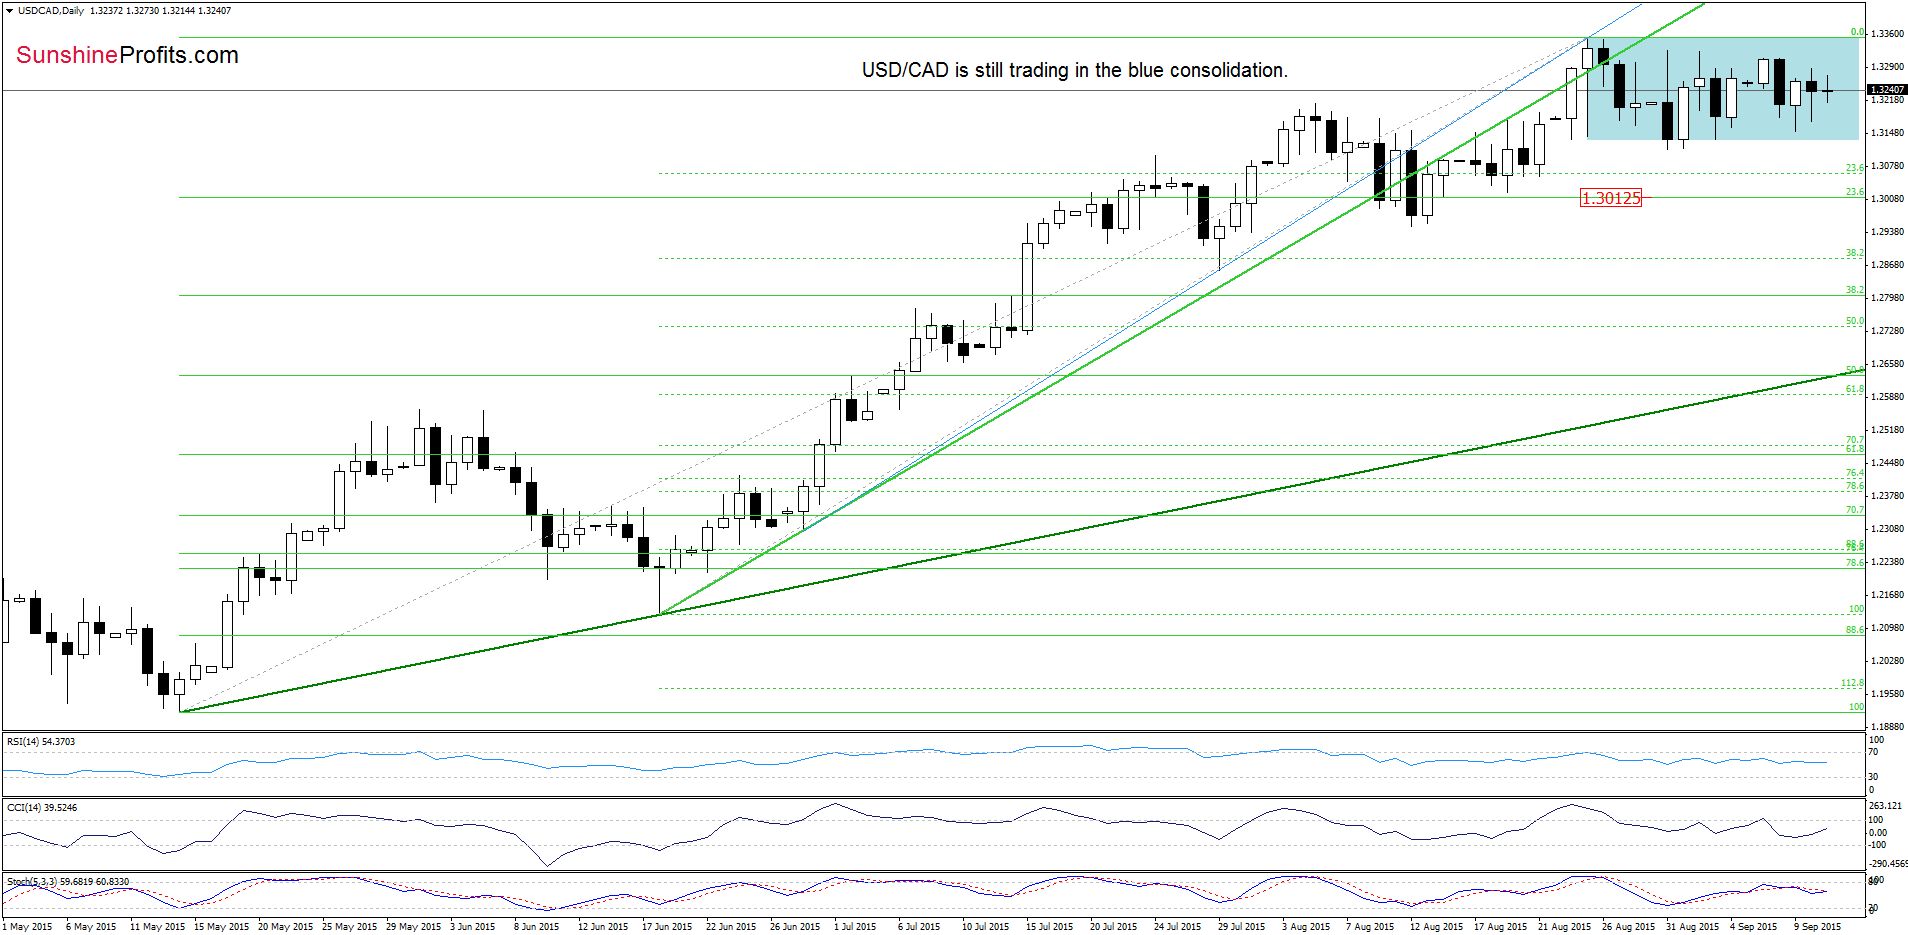
From today’s point of view, we see that the overall situation in the short-term hasn’t changed much as USD/CAD is still trading in the blue consolidation. Therefore, what we wrote a week ago is still valid:
(…) we think that as long as there is no breakout above the upper line of the formation another test of the green resistance line is not likely to be seen. On the other hand, a sizable downward move is also questionable unless we see a daily closure below the lower border of the consolidation (in this case, the initial downside target would be around 1.2950-1.3015, where the bottom of the previous pullback and the 23.6% Fibonacci retracement based on the entire May-Aug rally are).
Very short-term outlook: mixed
Short-term outlook: mixed
MT outlook: mixed
LT outlook: mixed
Trading position (short-term; our opinion): No positions are justified from the risk/reward perspective at the moment. We will keep you informed should anything change, or should we see a confirmation/invalidation of the above.
USD/CHF
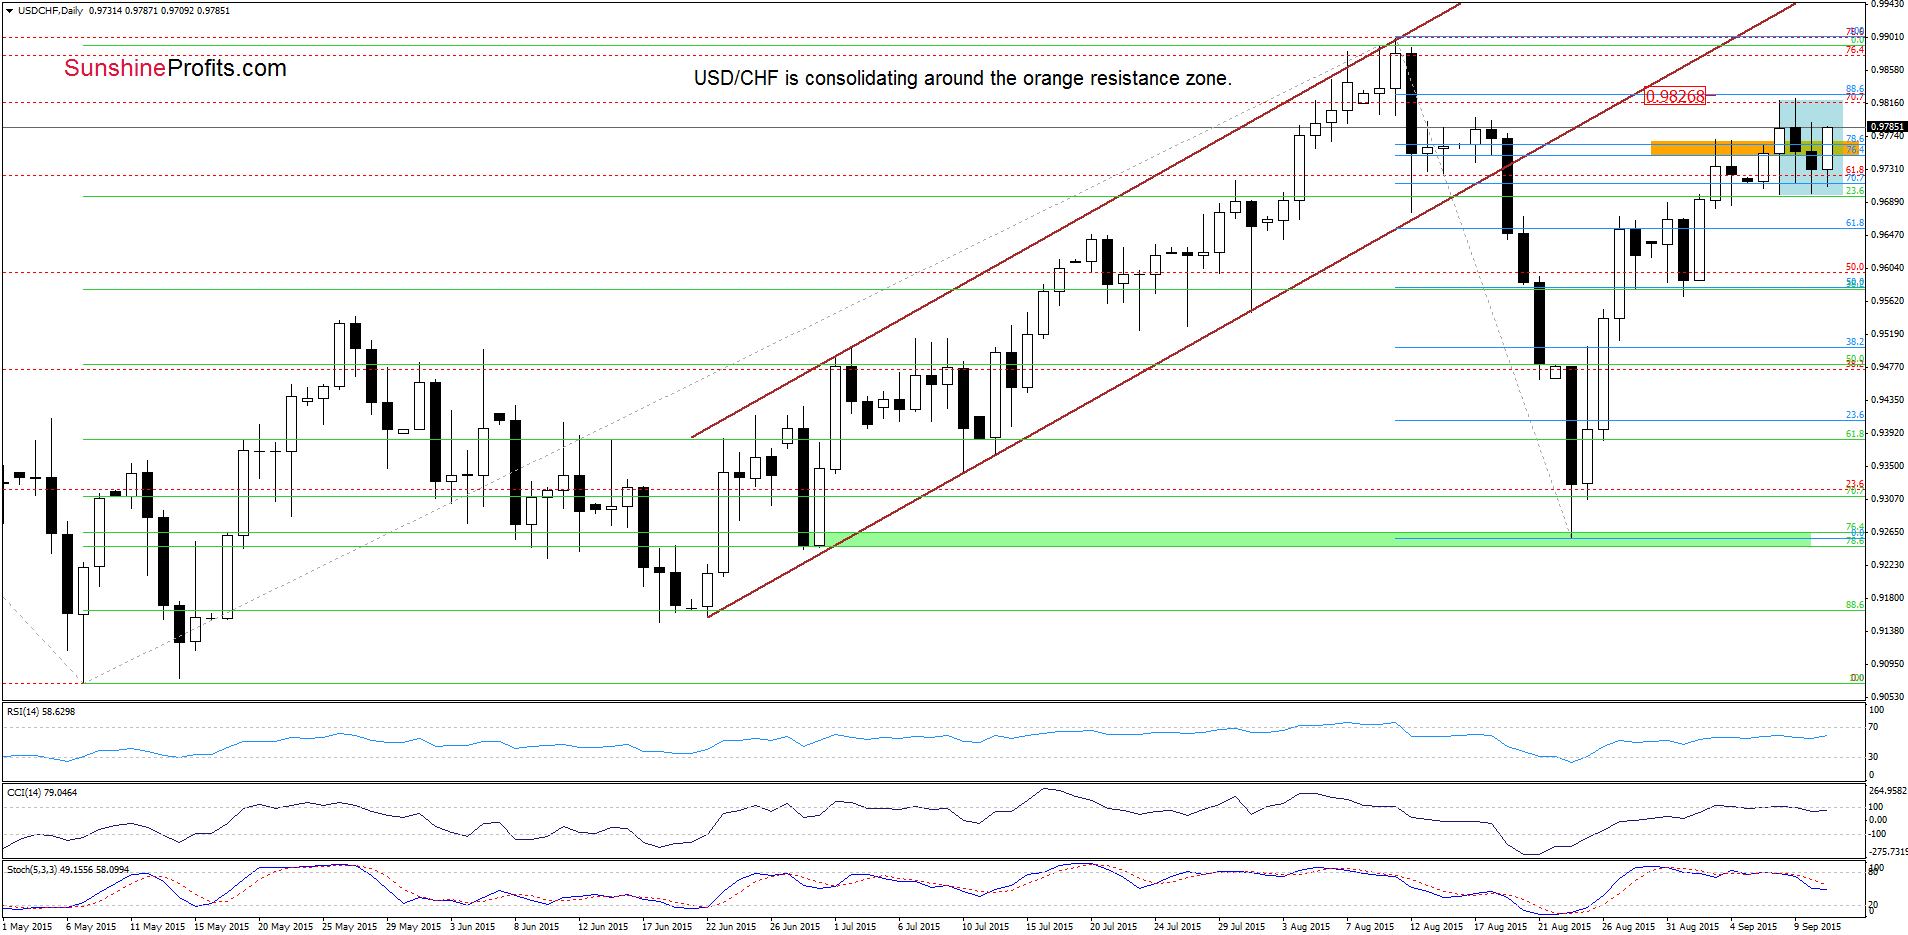
Looking at the daily chat, we see that USD/CHF is consolidating around the orange resistance zone. Therefore, in our opinion, if currency bulls manage to break above the 88.6% Fibonacci retracement, we may see a test of the Aug high. Nevertheless, taking into account the current position of the indicators (the CCI and Stochastic Oscillator generated sell signals), it seems to us that reversal in the coming days should not surprise us.
Are there any other technical factors that could encourage currency bears to act? Let’s examine the weekly chart and find out.
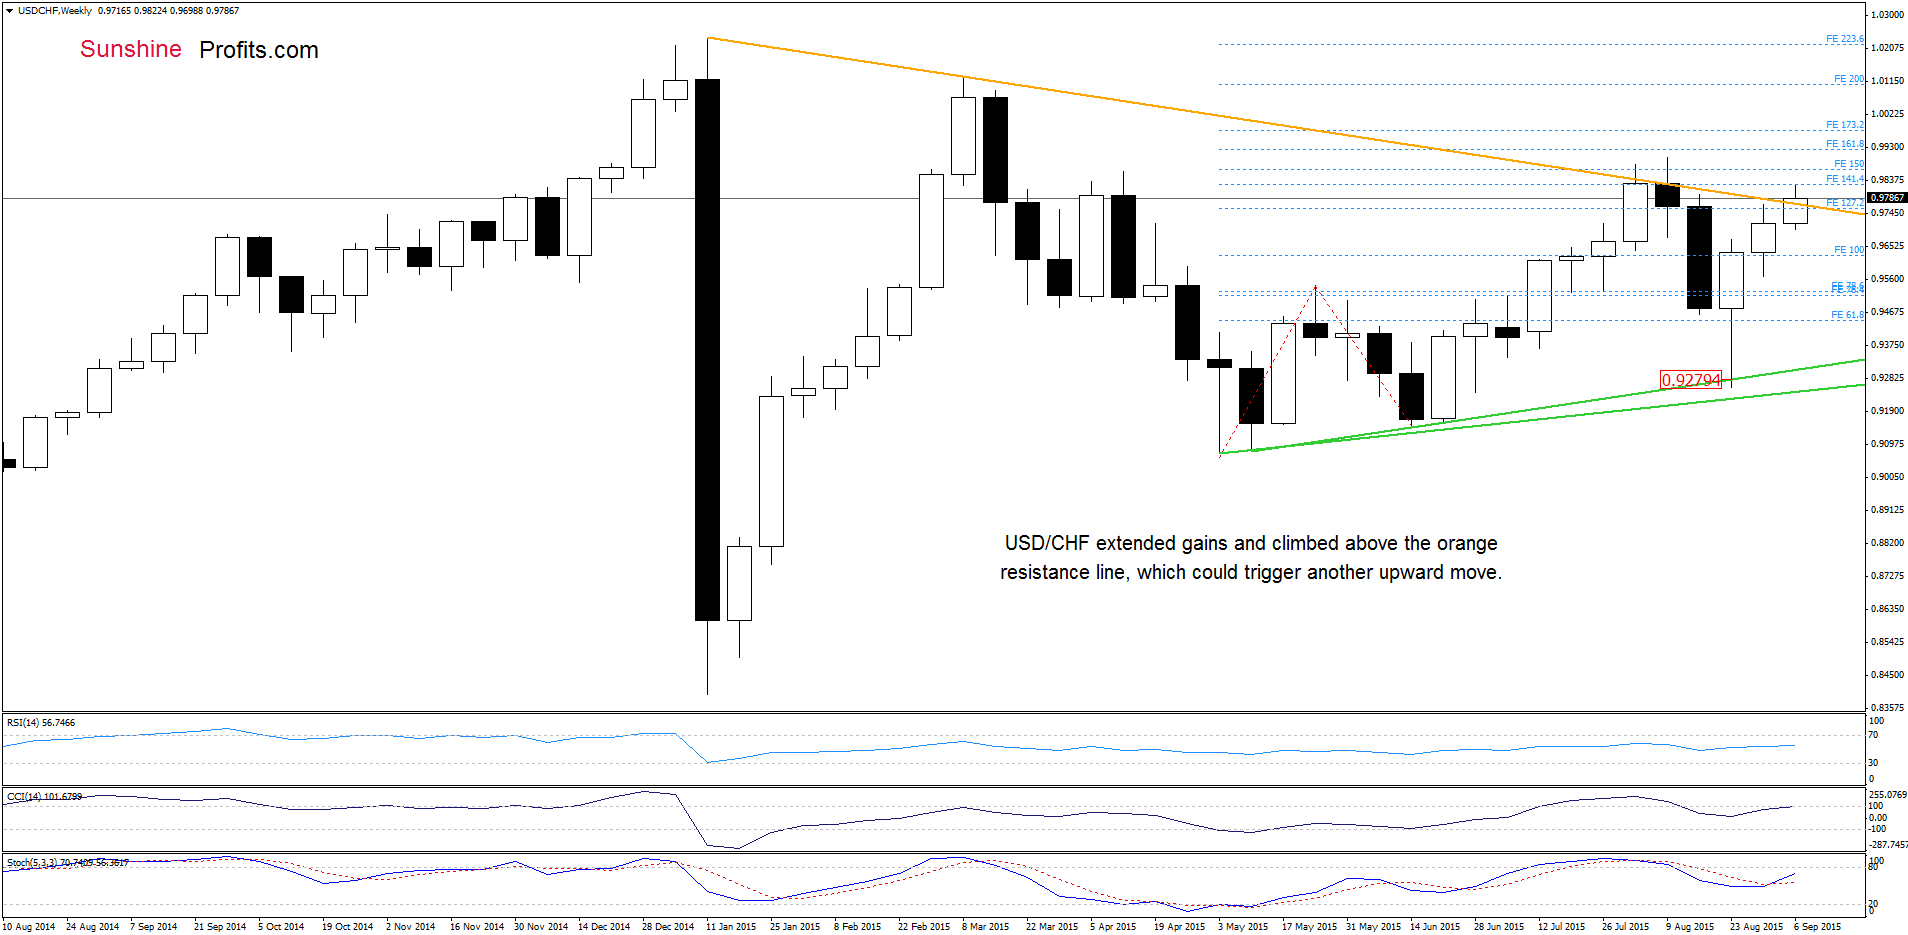
From this perspective we see that USD/CHF extended gains and reached the orange resistance line. In our opinion, if the pair closes the week under this key resistance line, we’ll see another downward move in the coming week (similarly to what we saw at the beginning of Aug). However, if currency bulls manage to push the pair higher and closed the week above it, it would be a strong positive signal, which will trigger a test of the Aug high. But even if we see such increase, we should keep in mind the long-term picture.
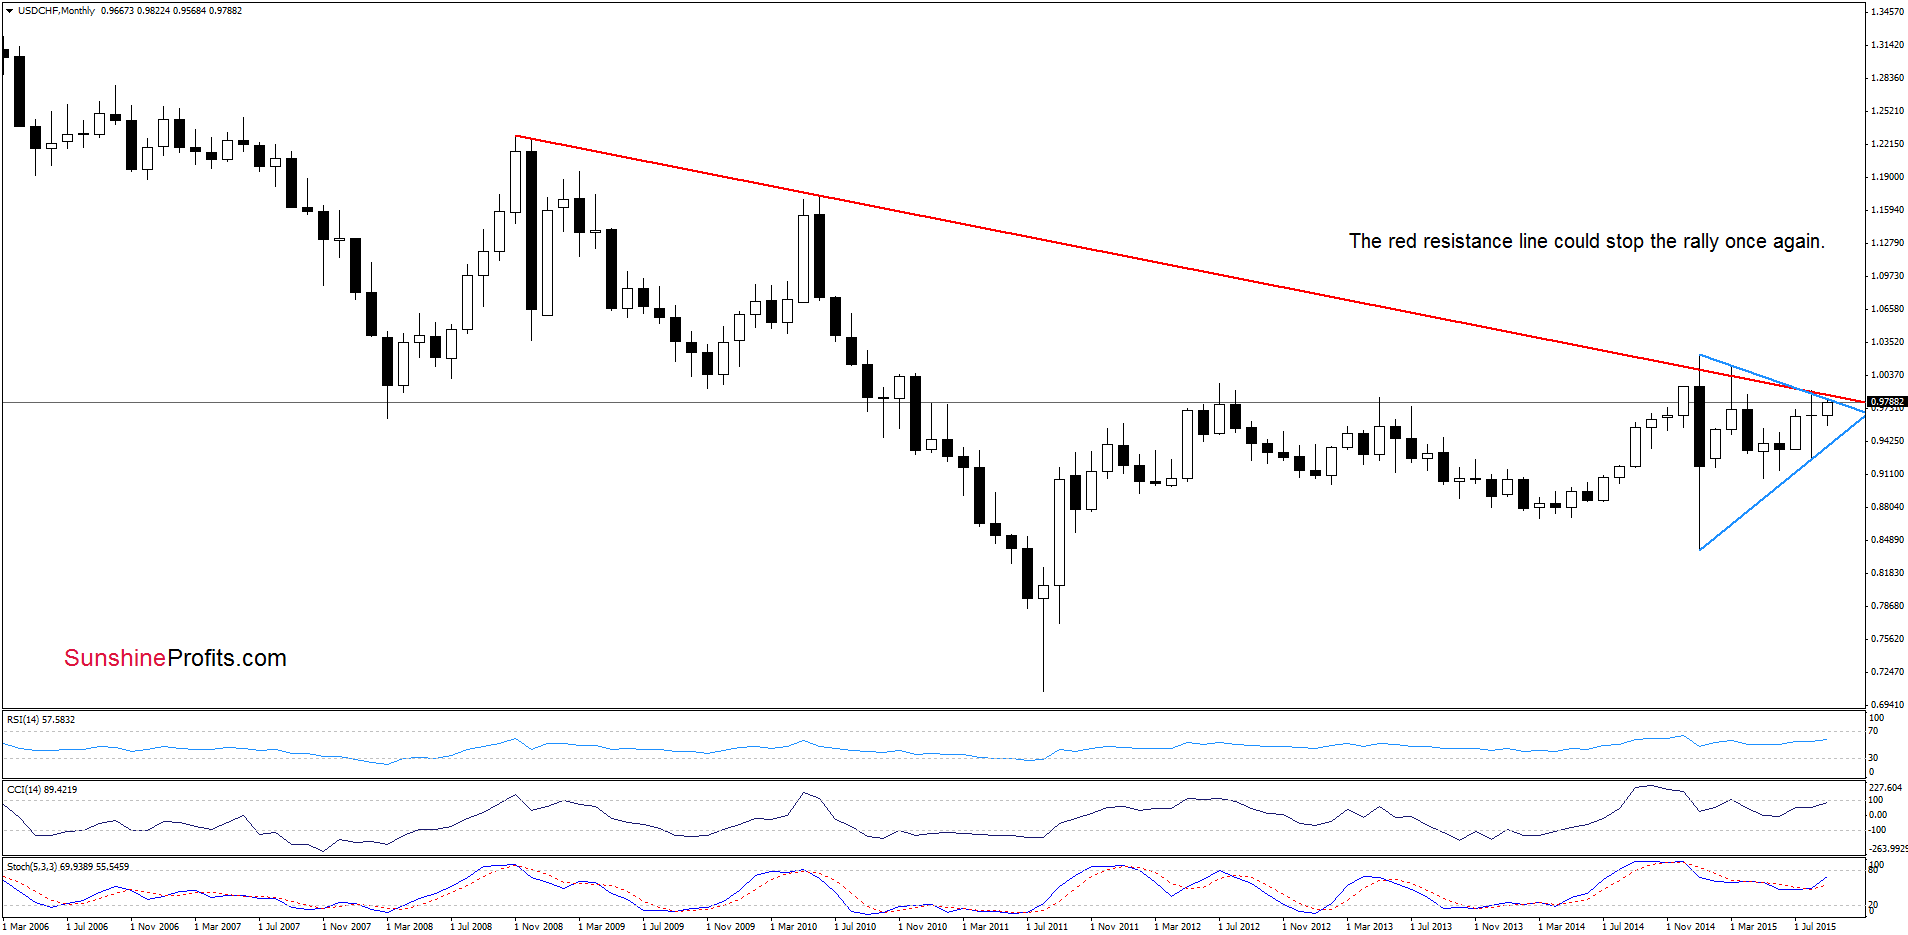
As you see, USD/CHF is trading in a triangle, slightly below the red resistance line, which successfully stopped further improvement in Jan, Mar and also in Aug. Therefore, we believe that as long as there is no breakout above is, further rally is not likely to be seen.
Very short-term outlook: mixed with bearish bias
Short-term outlook: mixed
MT outlook: mixed
LT outlook: mixed
Trading position (short-term; our opinion): No positions are justified from the risk/reward perspective at the moment. We will keep you informed should anything change, or should we see a confirmation/invalidation of the above.
AUD/USD
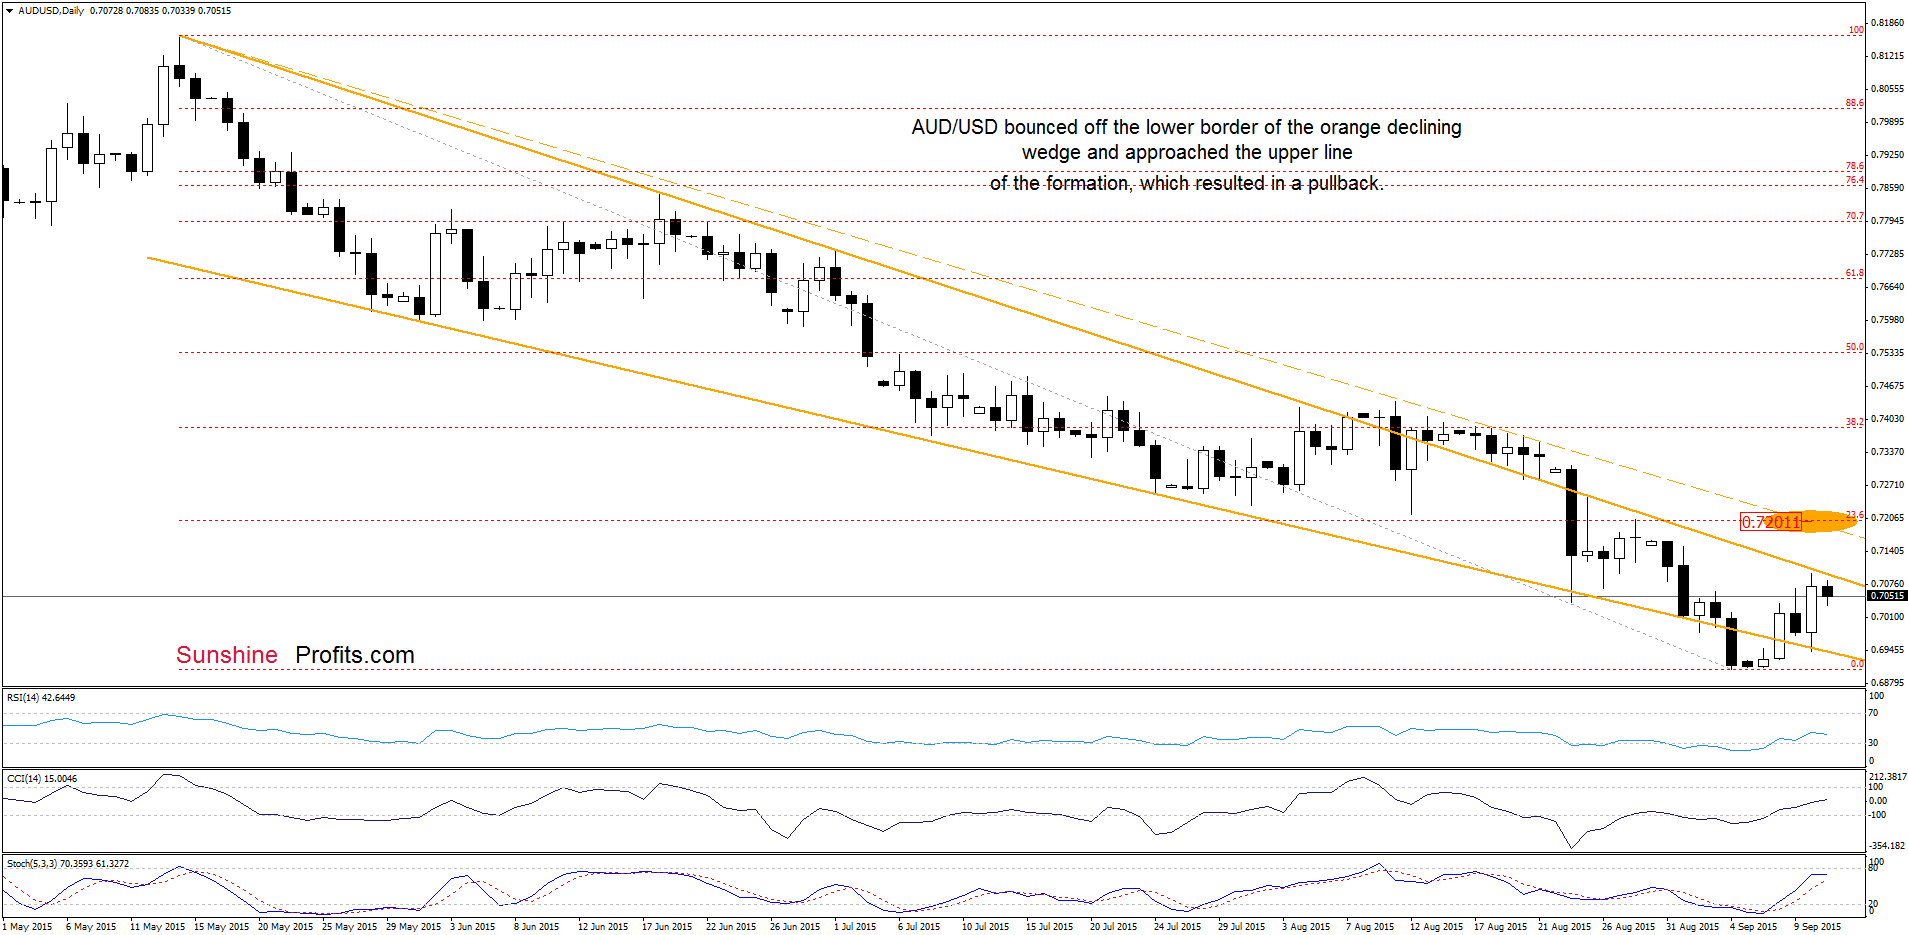
Looking at the daily chart, we see that the upper line of the declining wedge encouraged currency bears to act, which resulted in a pullback earlier today. What’s next? Taking into account the current position of the indicators, it seems that we’ll see another attempt to move higher in the coming week. If AUD/USD successfully breaks above the orange resistance line, the next upside target would be around 0.7200, where the orange resistance dashed line and the 23.6% Fibonacci retracement (based on the entire May-Sep declines) are (the orange ellipse on the above chart).
Nevertheless, we should keep in mind that this scenario will be more likely, if we see an invalidation of the breakdown below the green zone based on the 76.4% and 78.6% Fibonacci retracement levels (marked on the chart below).
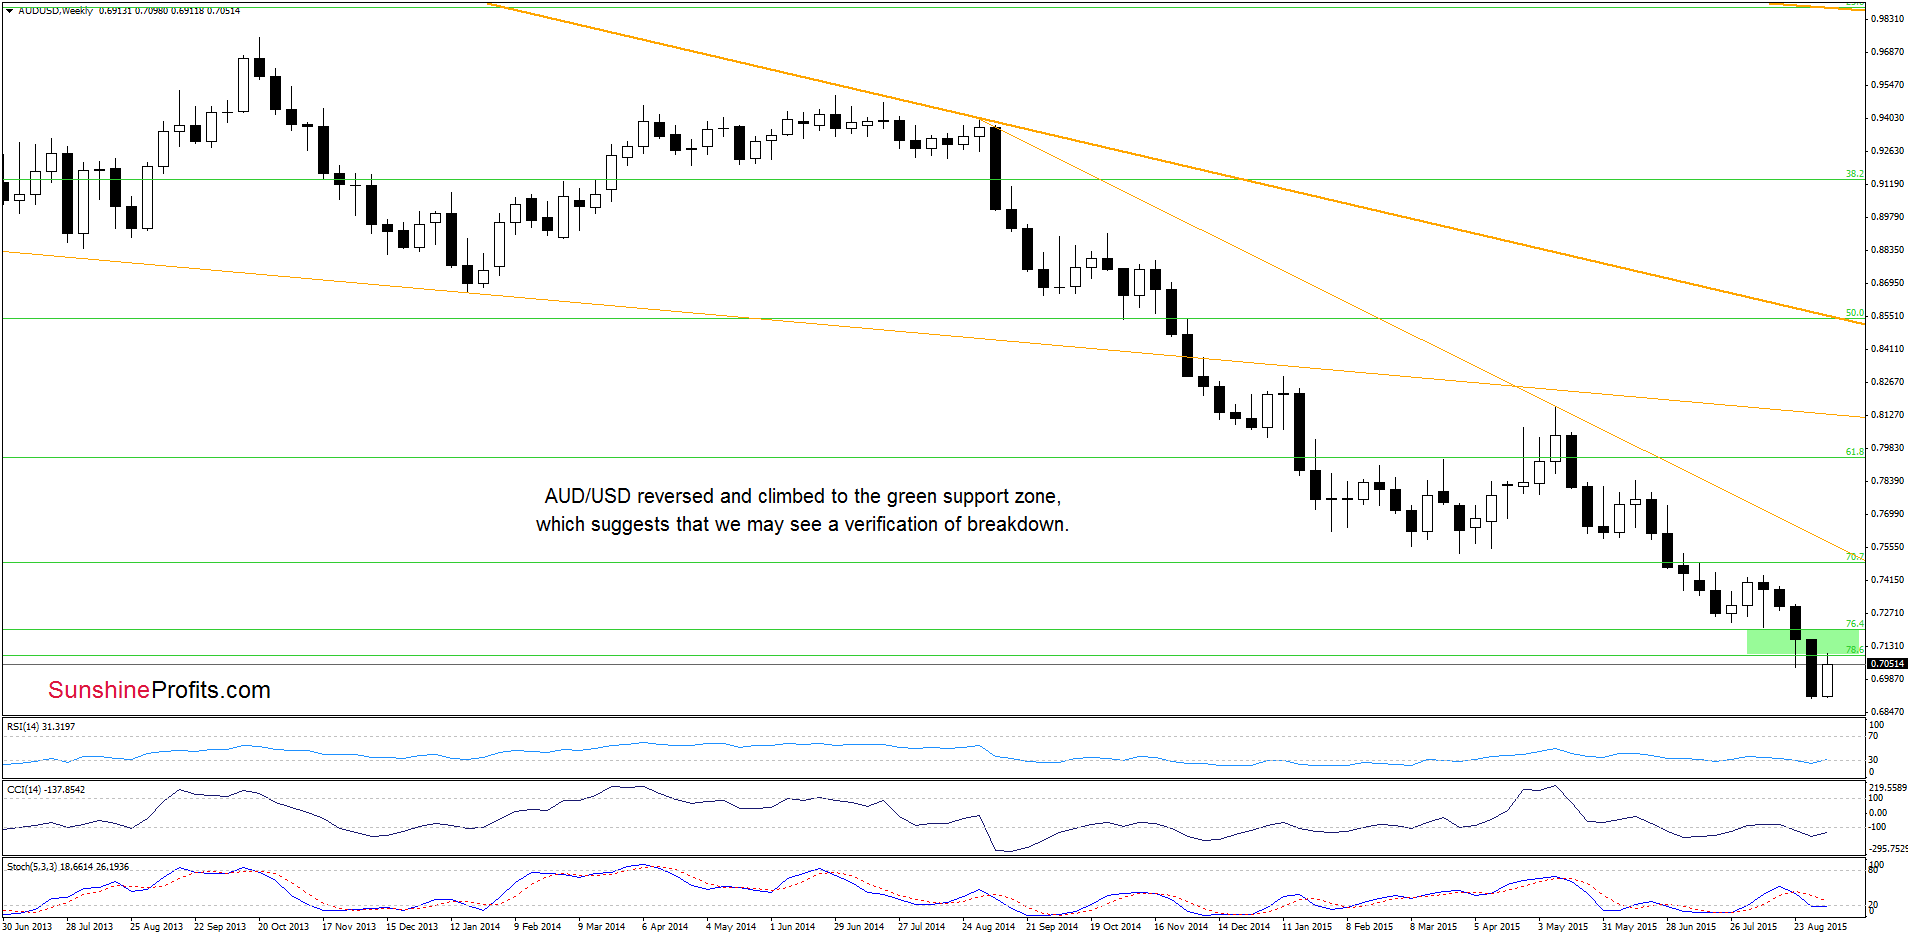
Until this time, all upswings would be just a verification of earlier breakdown, which could translate to another attempt to move lower. Therefore, as long as there is no invalidation of the breakdown further improvement (and realization of the pro-growth scenario) is questionable.
Very short-term outlook: mixed with bullish bias
Short-term outlook: mixed
MT outlook: mixed
LT outlook: mixed
Trading position (short-term; our opinion): No positions are justified from the risk/reward perspective at the moment. We will keep you informed should anything change, or should we see a confirmation/invalidation of the above.
Thank you.
Nadia Simmons
Forex & Oil Trading Strategist
Forex Trading Alerts
Oil Investment Updates
Oil Trading Alerts

