

Although the U.S. Department of Labor reported that the number of initial jobless claims in the week ending August 29 increased by 12,000 (missing analysts’ expectations for a 5,000 rise), the Institute of Supply Management’s report (which showed that its non-manufacturing PMI dropped 59.0 in Aug, compared to forecasts for a reading of 58.1) improved investors’ sentiment and pushed the USD Index above the level of 96. Will today’s highly-anticipated jobs report give the greenback an additional support? Before we know the answer to this question, let’s take a closer look at the current picture of our six currency pairs.
In our opinion the following forex trading positions are justified - summary:
- EUR/USD: short (a stop-loss order at 1.1445; the downside target around 1.0938)
- GBP/USD: none
- USD/JPY: none
- USD/CAD: none
- USD/CHF: none
- AUD/USD: none
EUR/USD
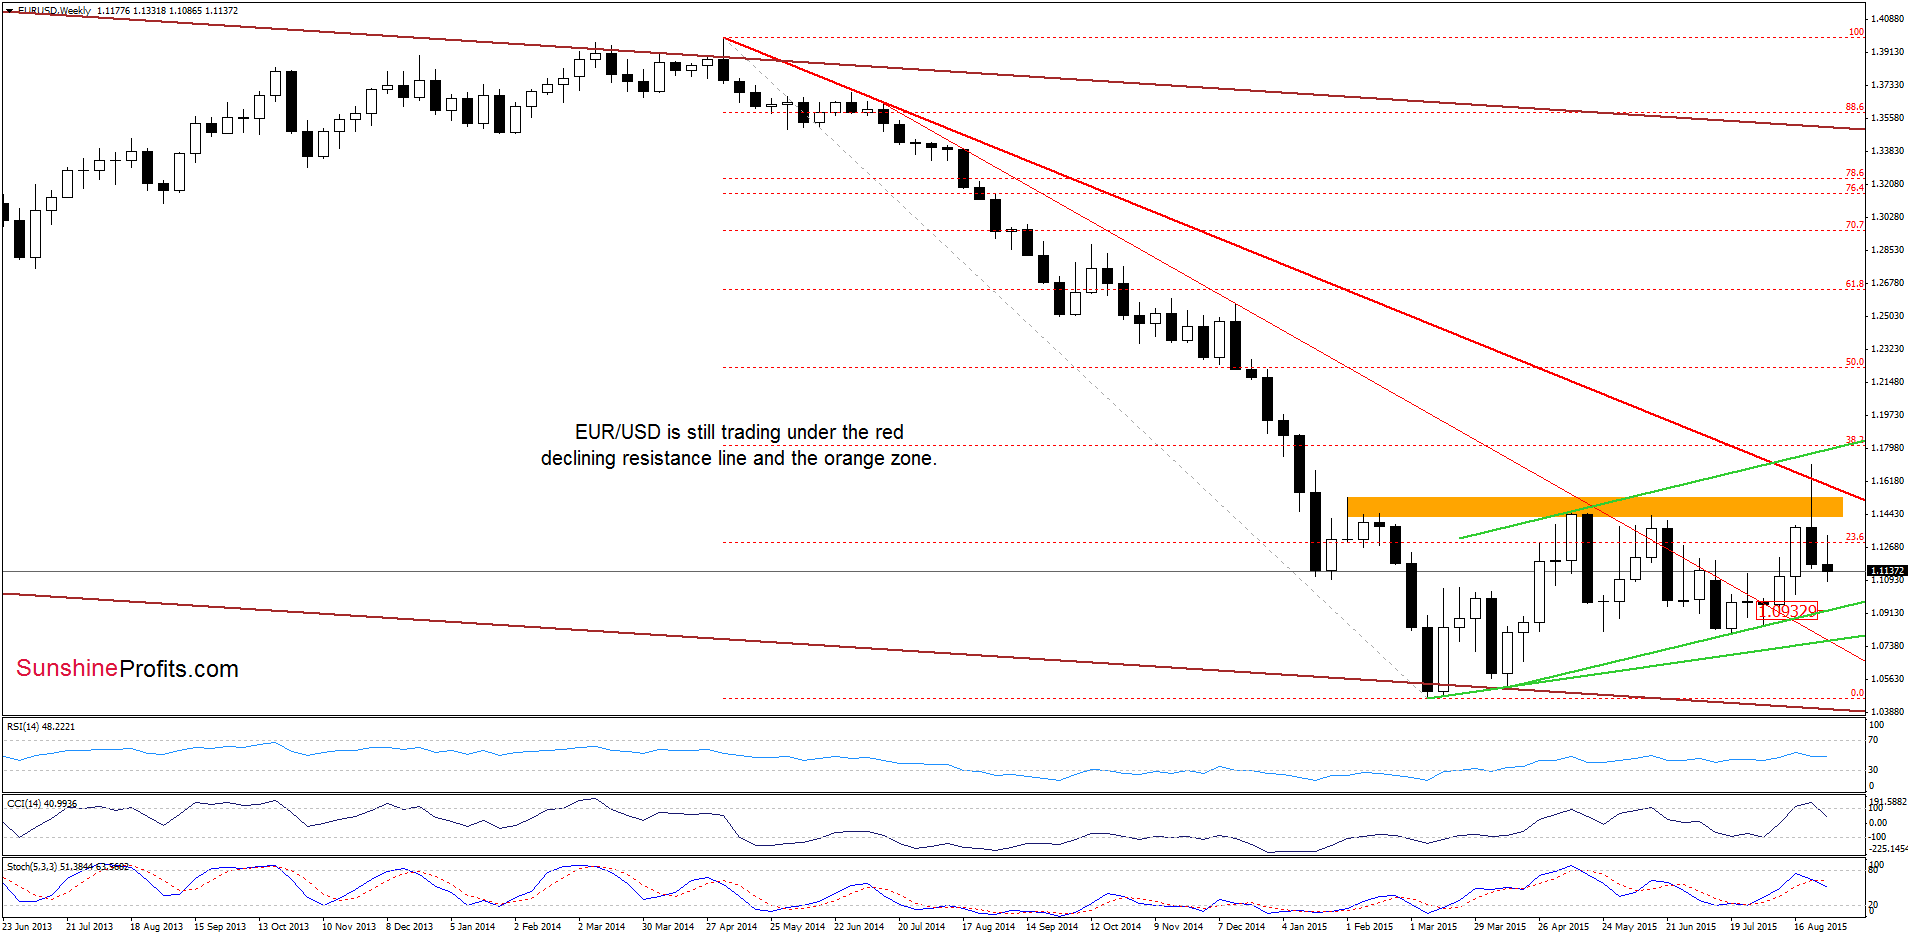
The situation in the medium-term has deteriorated slightly as EUR/USD extended losses under the long-term red line and the previously-broken orange resistance zone, which suggests lower values of the exchange rate in the coming week (especially when we factor in sell signals generated by the indicators).
Having said that, let’s focus on the very short-term picture.
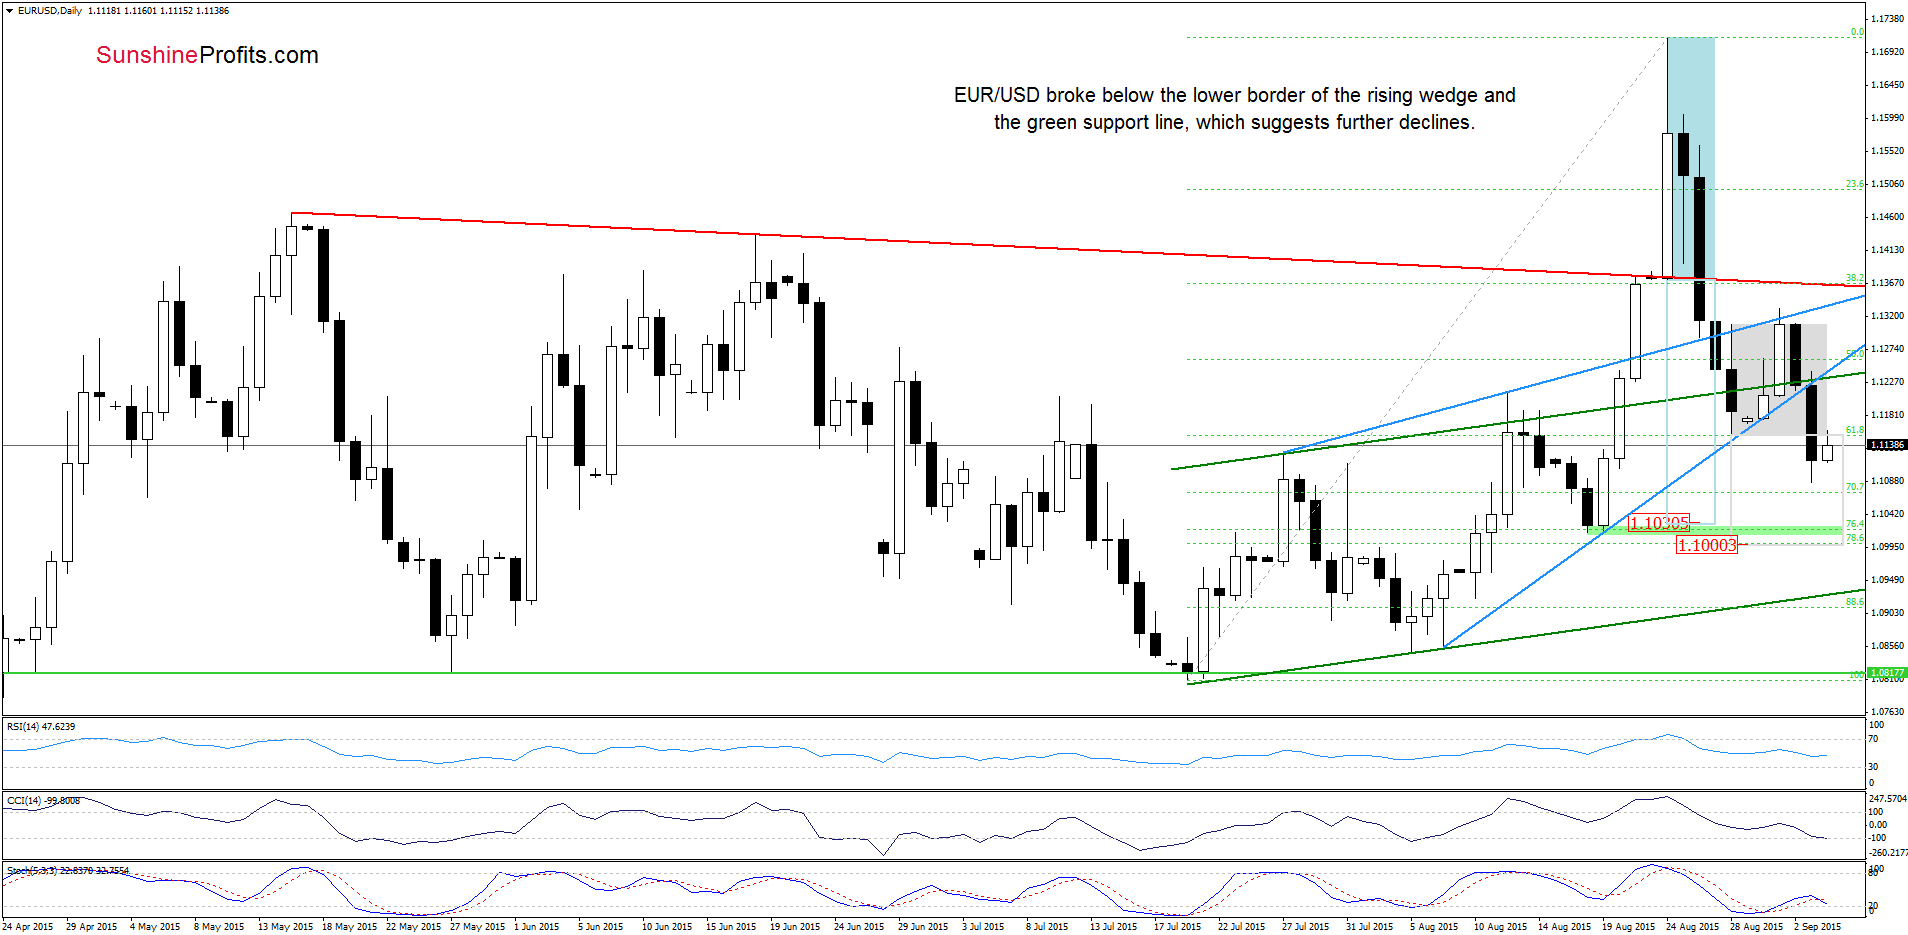
From this perspective, we see that EUR/USD declined below the lower line of the blue rising wedge and the upper border of the rising trend channel (marked with green), which is a bearish signal that suggests further deterioration (especially when we factor in the breakdown under the lower border of the grey consolidation). This means that our bearish scenario from Tuesday’s alert would be in play in the coming day(s):
(…) another attempt to move lower is more likely than not. In our opinion, if the pair drops under the lower line of the rising wedge (marked with blue), the next downside target would be around 1.1030, where the size of the downward move will correspond to the height of the blue consolidation and where the mid-Aug lows are.
Very short-term outlook: bearish
Short-term outlook: bearish
MT outlook: mixed with bearish bias
LT outlook: mixed
Trading position (short-term; our opinion): Short positions with a stop-loss order at 1.1445 are justified from the risk/reward perspective. The downside target around 1.0938. We will keep you informed should anything change, or should we see a confirmation/invalidation of the above.
GBP/USD
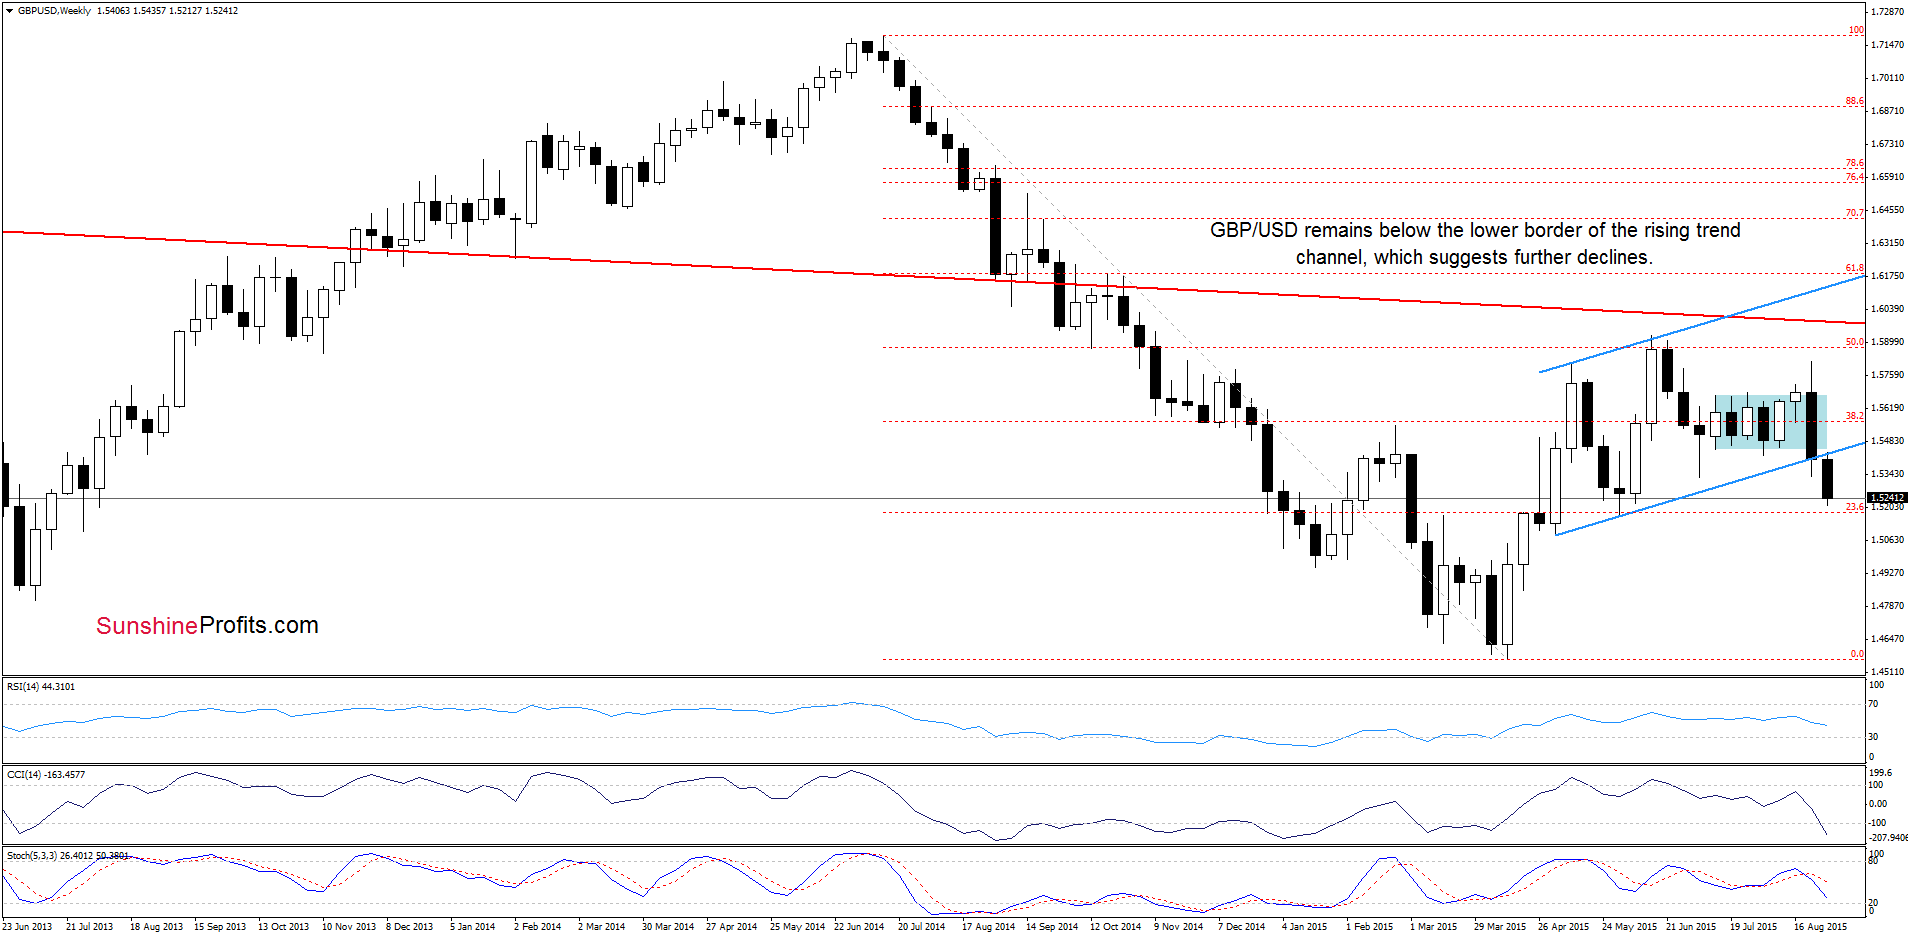
GBP/USD extended losses under the lower border of the rising trend channel, which is a negative signal that suggests further deterioration.
Will the daily char confirm the above bearish scenario? Let’s check.
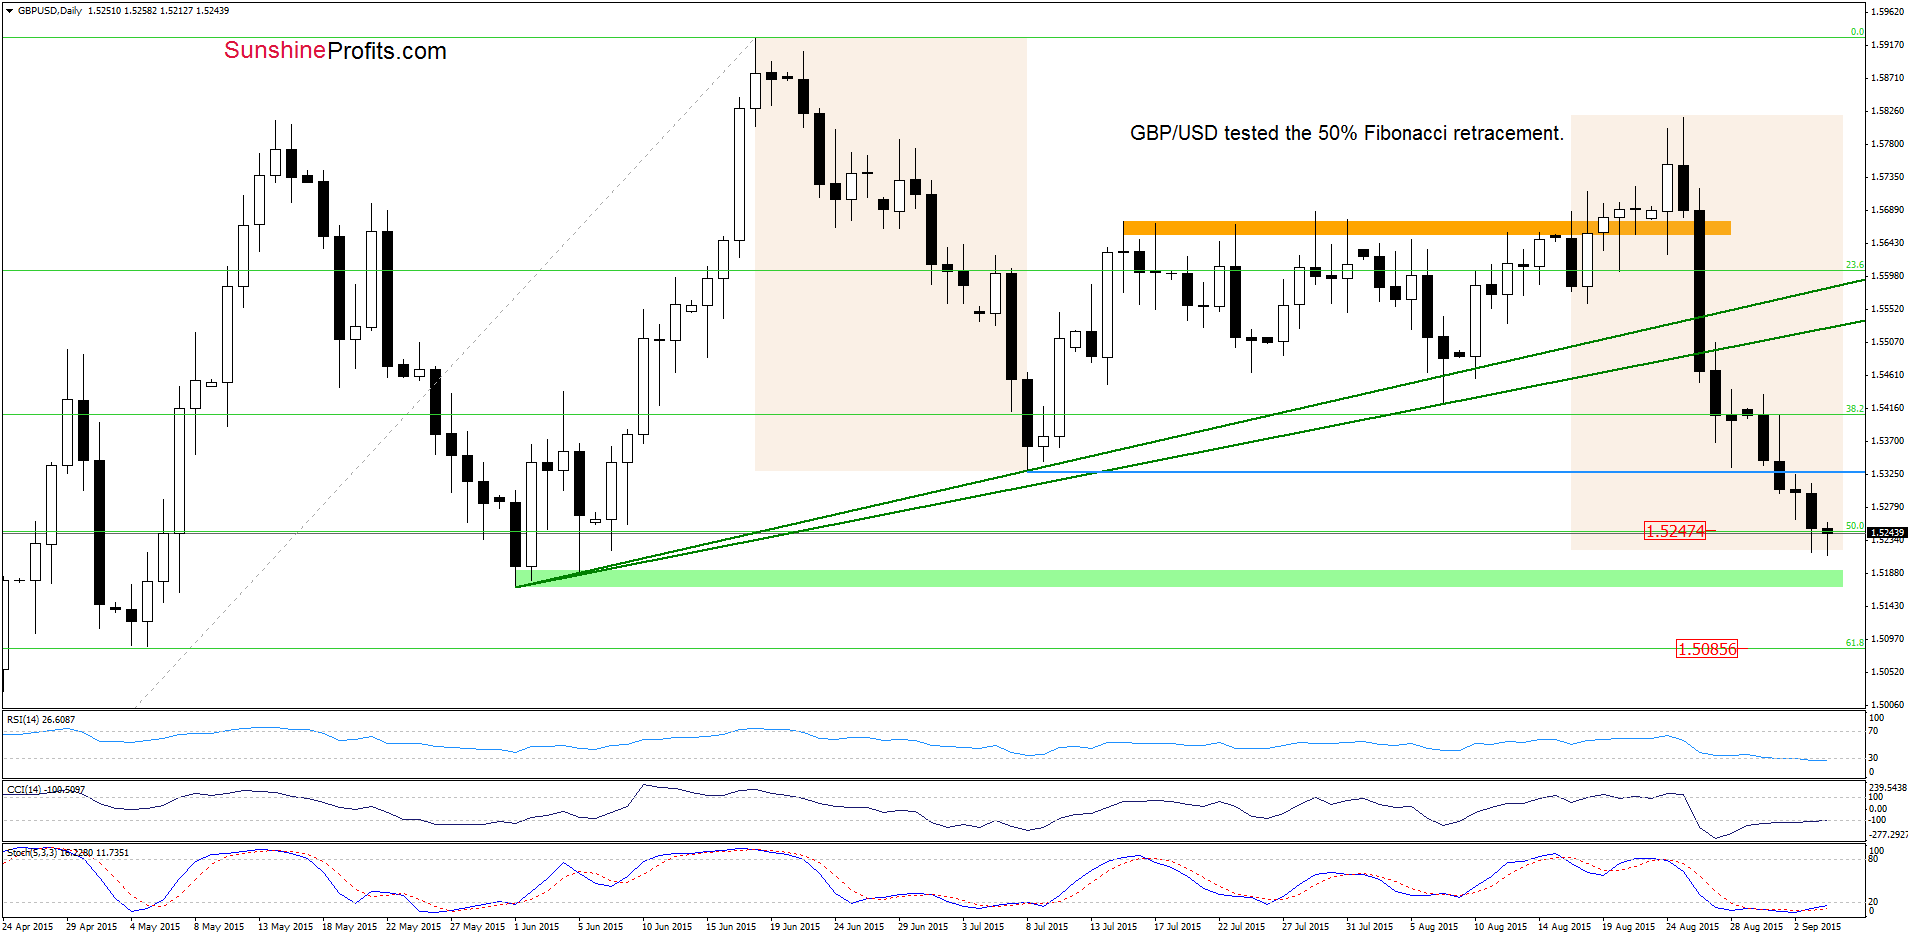
Looking at the daily chart we see that although GBP/USD re-tested the 50% Fibonacci retracement, there was no daily close below this important support level, which is a positive signal. Nevertheless, as long as there is no invalidation of the breakdown under the Jul 8 low of 1.5328 another attempt to move lower is quite likely (in this case, we may see a test of the green support zone based on the Jun lows). However, we should keep in mind that the size of the current downward move is almost the same as decline, which we saw from mid-Jun to the first decade of July, which increases the probability of reversal in near future – especially when we factor in the current position of the daily indicators (they are oversold and very close to generating buy signals, which together could encourage currency bulls to act and result in a rebound in the coming days).
Very short-term outlook: mixed
Short-term outlook: mixed
MT outlook: mixed
LT outlook: mixed
Trading position (short-term; our opinion): No positions are justified from the risk/reward perspective at the moment. We will keep you informed should anything change, or should we see a confirmation/invalidation of the above.
USD/JPY
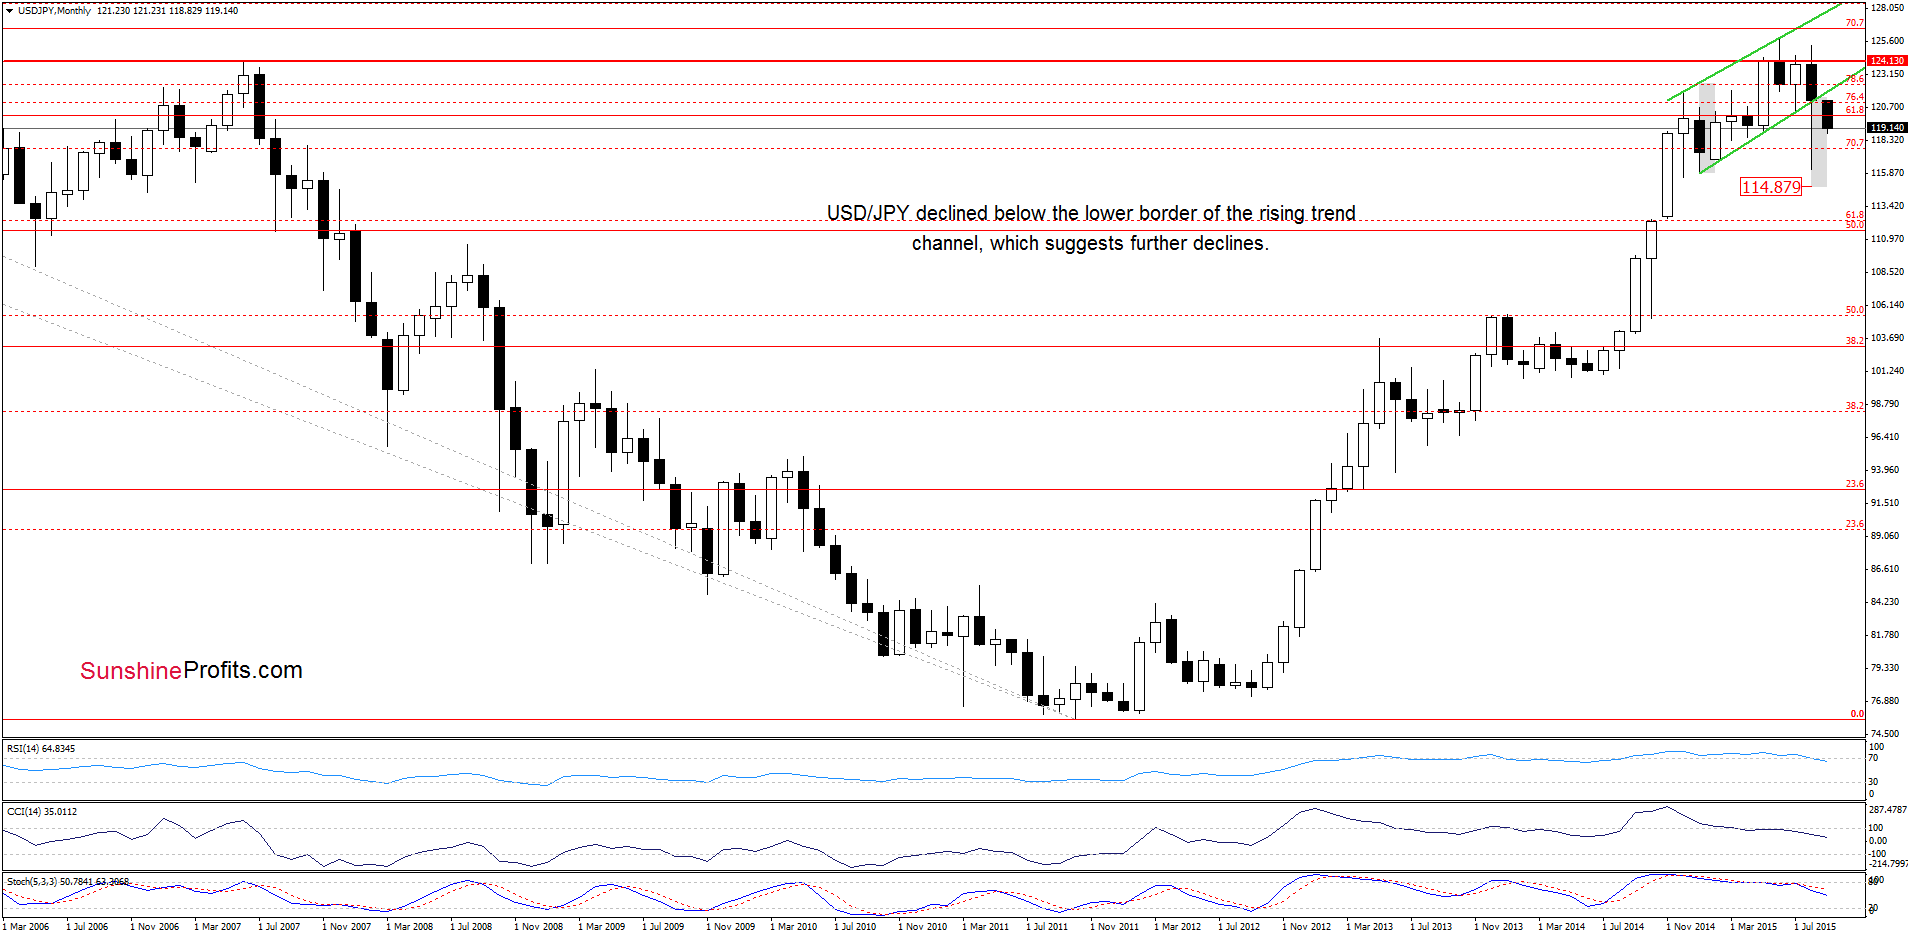
The situation in the medium-term hasn’t changed much as USD/JPY is still trading under the lower border of the rising trend channel, which suggests lower values of the exchange rate in near future.
What can we infer from the very short-term picture? Let’s find out.
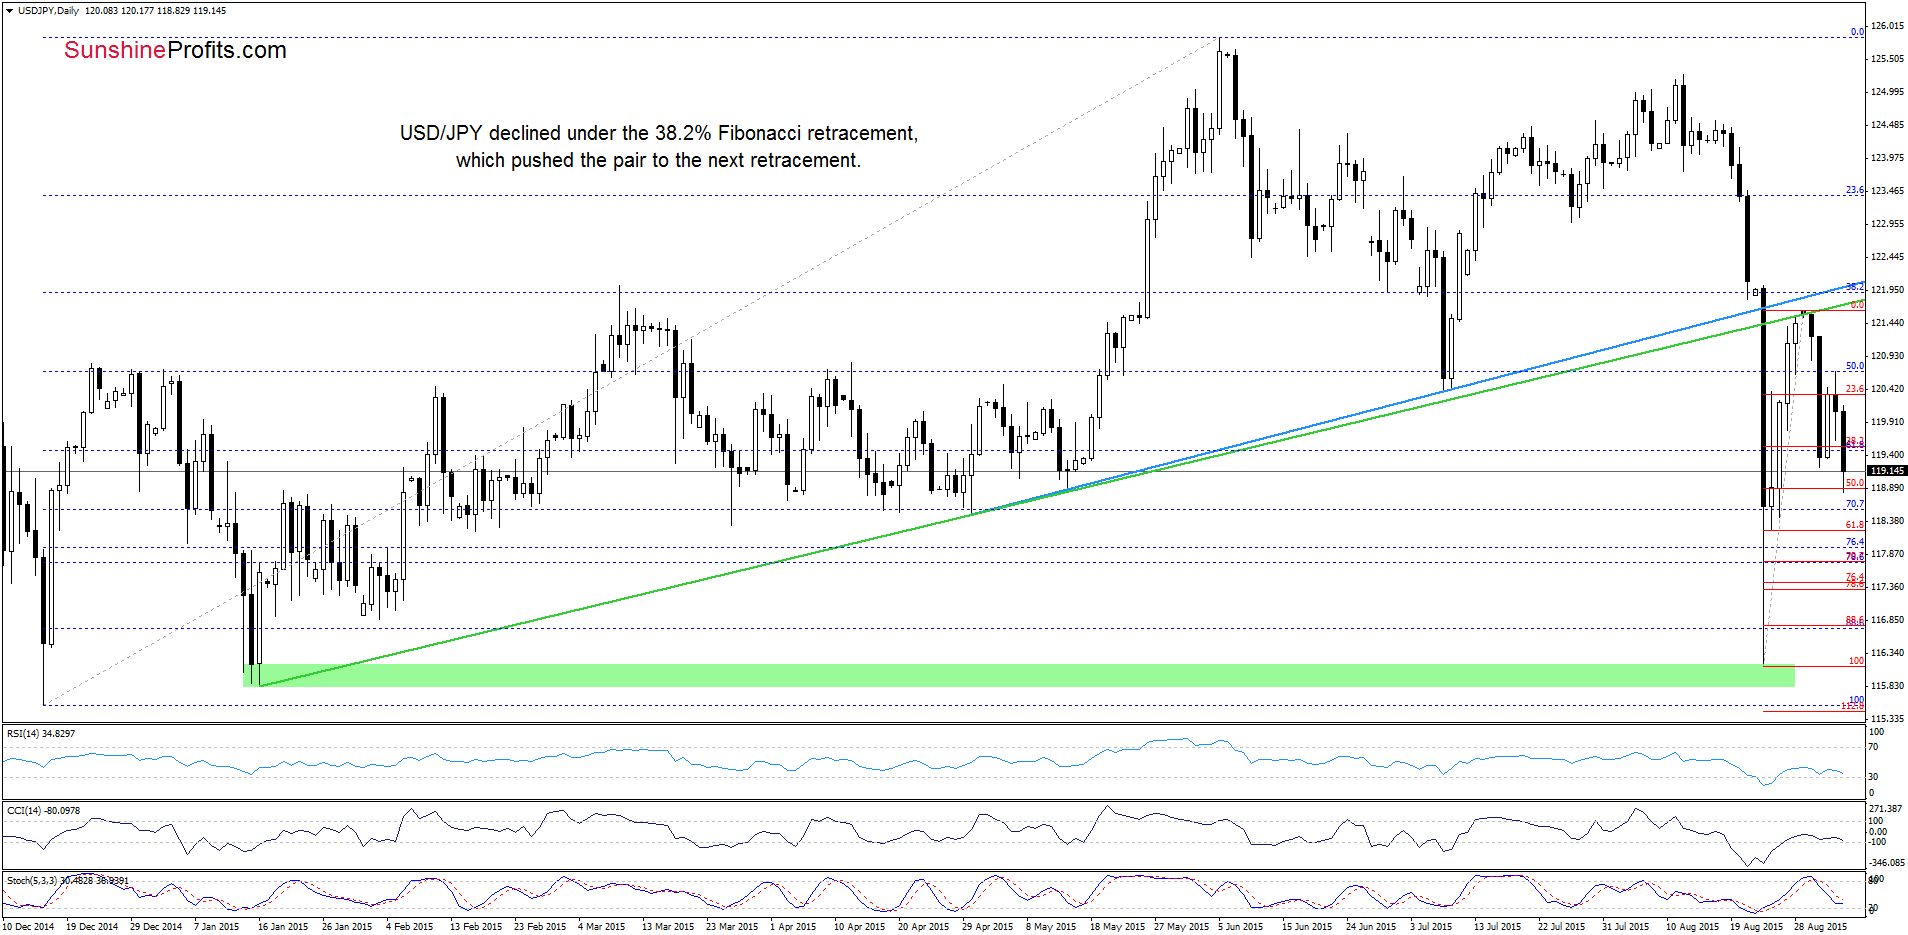
In our last commentary on this currency pair, we wrote:
(…) we think that as long as there is no invalidation of the breakdown below the blue and green support/resistance lines sizable upward move is not likely to be seen and another downswing can’t be ruled out.
As you see on the daily chart USD/JPY reversed (as we had expected) and slipped under the 38.2% Fibonacci retracement based on the late Aug rally, which triggered a drop to the next Fibonacci retracement. What’s next? Taking into account the fact that sell signals remain in place (although all indicators are almost oversold, there are no buy signals, which could encourage currency bulls to act at the moment), it seems to us that lower values of the exchange rate are just around the corner. If this is the case and the pair extends losses, the next downside target would be around 118.25, where the 61.8% retracement and the Aug 25 low are.
Very short-term outlook: mixed with bearish bias
Short-term outlook: mixed
MT outlook: mixed
LT outlook: mixed
Trading position (short-term; our opinion): No positions are justified from the risk/reward perspective at the moment. We will keep you informed should anything change, or should we see a confirmation/invalidation of the above.
USD/CAD
The medium-term picture hasn’t changed much as USD/CAD is trading above the 2008 high. Today, we’ll focus on the daily chart.
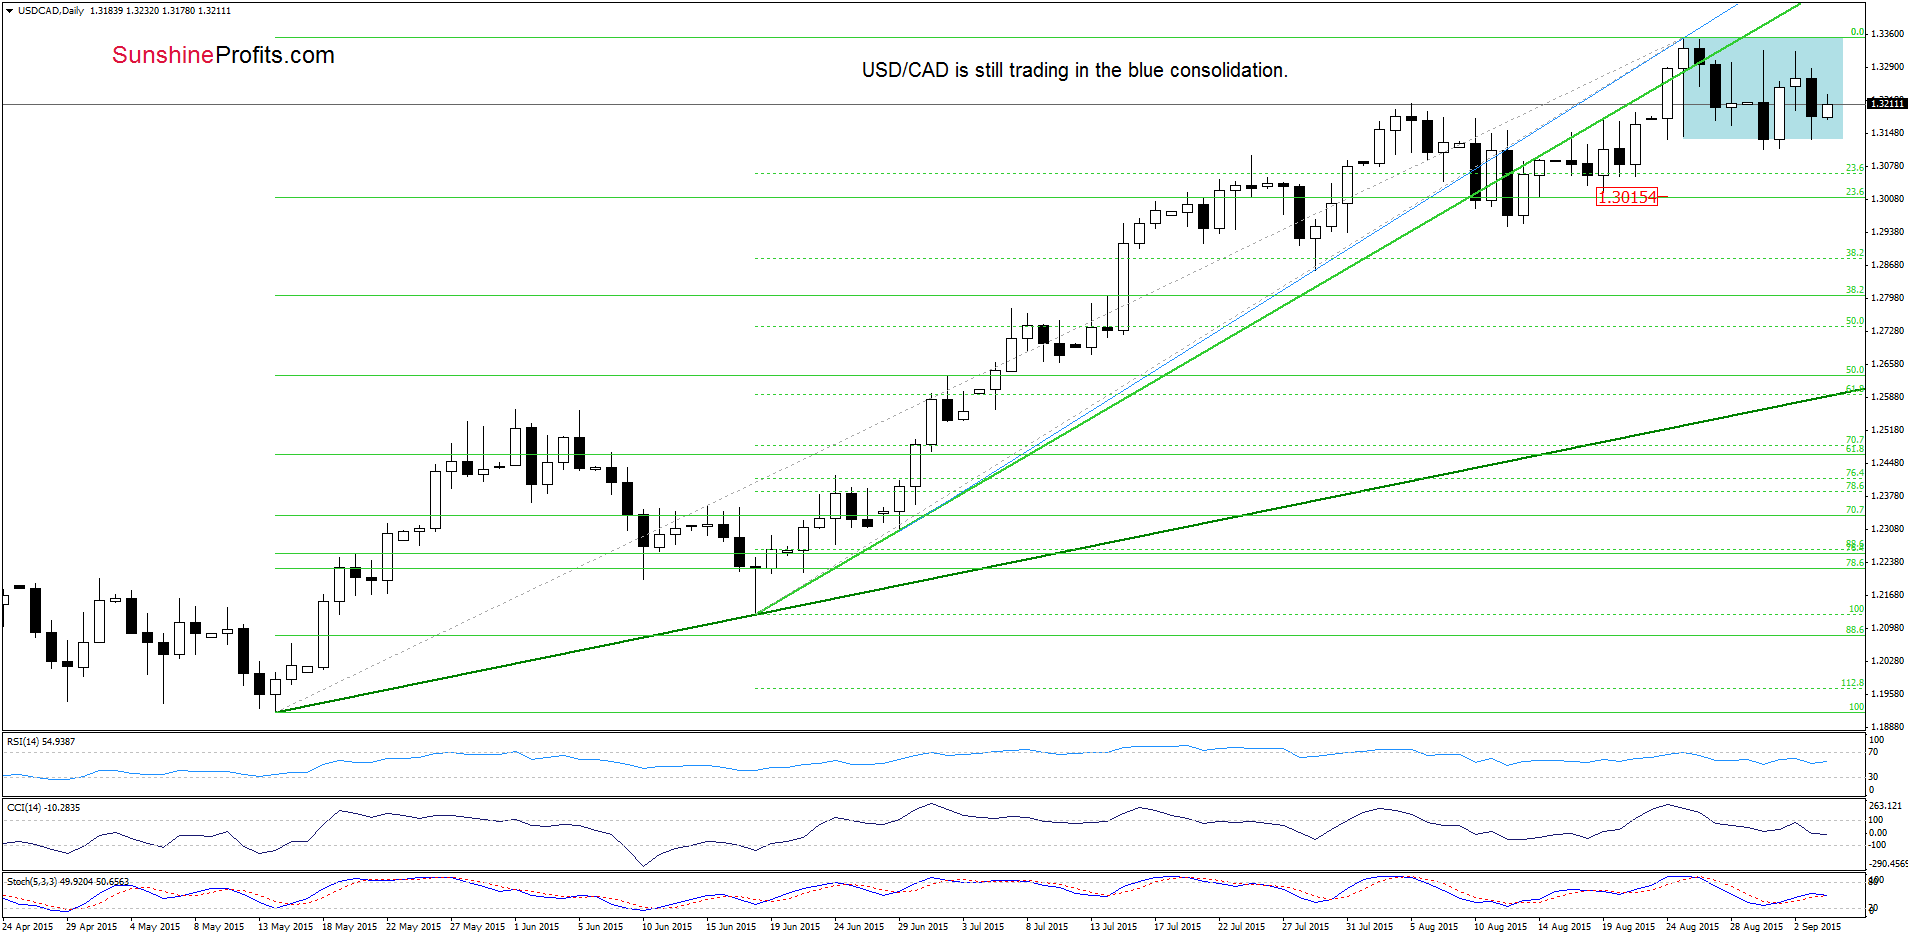
From today’s point of view, we see that the overall situation in the short-term hasn’t changed much as USD/CAD is still trading in the blue consolidation. Therefore, we think that as long as there is no breakout above the upper line of the formation another test of the green resistance line is not likely to be seen. On the other hand, a sizable downward move is also questionable unless we see a daily closure below the lower border of the consolidation (in this case, the initial downside target would be around 1.2950-1.3015, where the bottom of the previous pullback and the 23.6% Fibonacci retracement based on the entire May-Aug rally are).
Very short-term outlook: mixed
Short-term outlook: mixed
MT outlook: mixed
LT outlook: mixed
Trading position (short-term; our opinion): No positions are justified from the risk/reward perspective at the moment. We will keep you informed should anything change, or should we see a confirmation/invalidation of the above.
USD/CHF
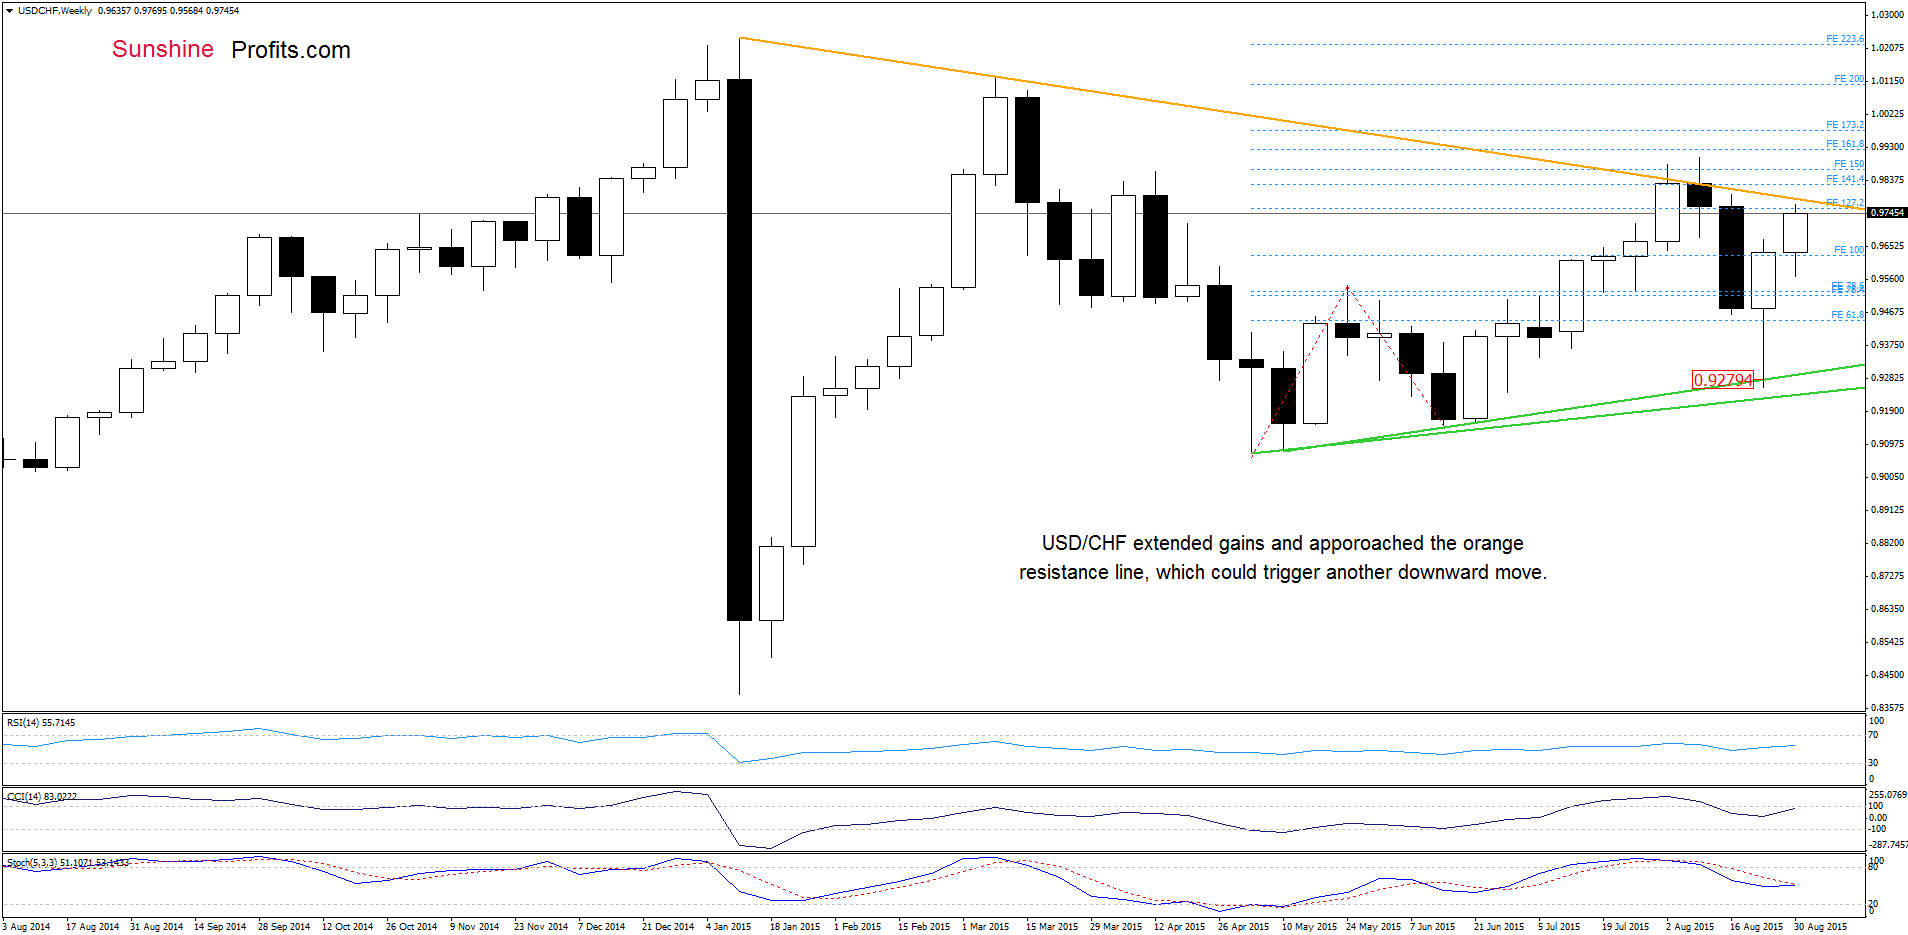
The medium-term picture has improved as USD/CHF extended gains and approached the orange resistance line. What impact did this increase have on the daily chart? Let’s check.
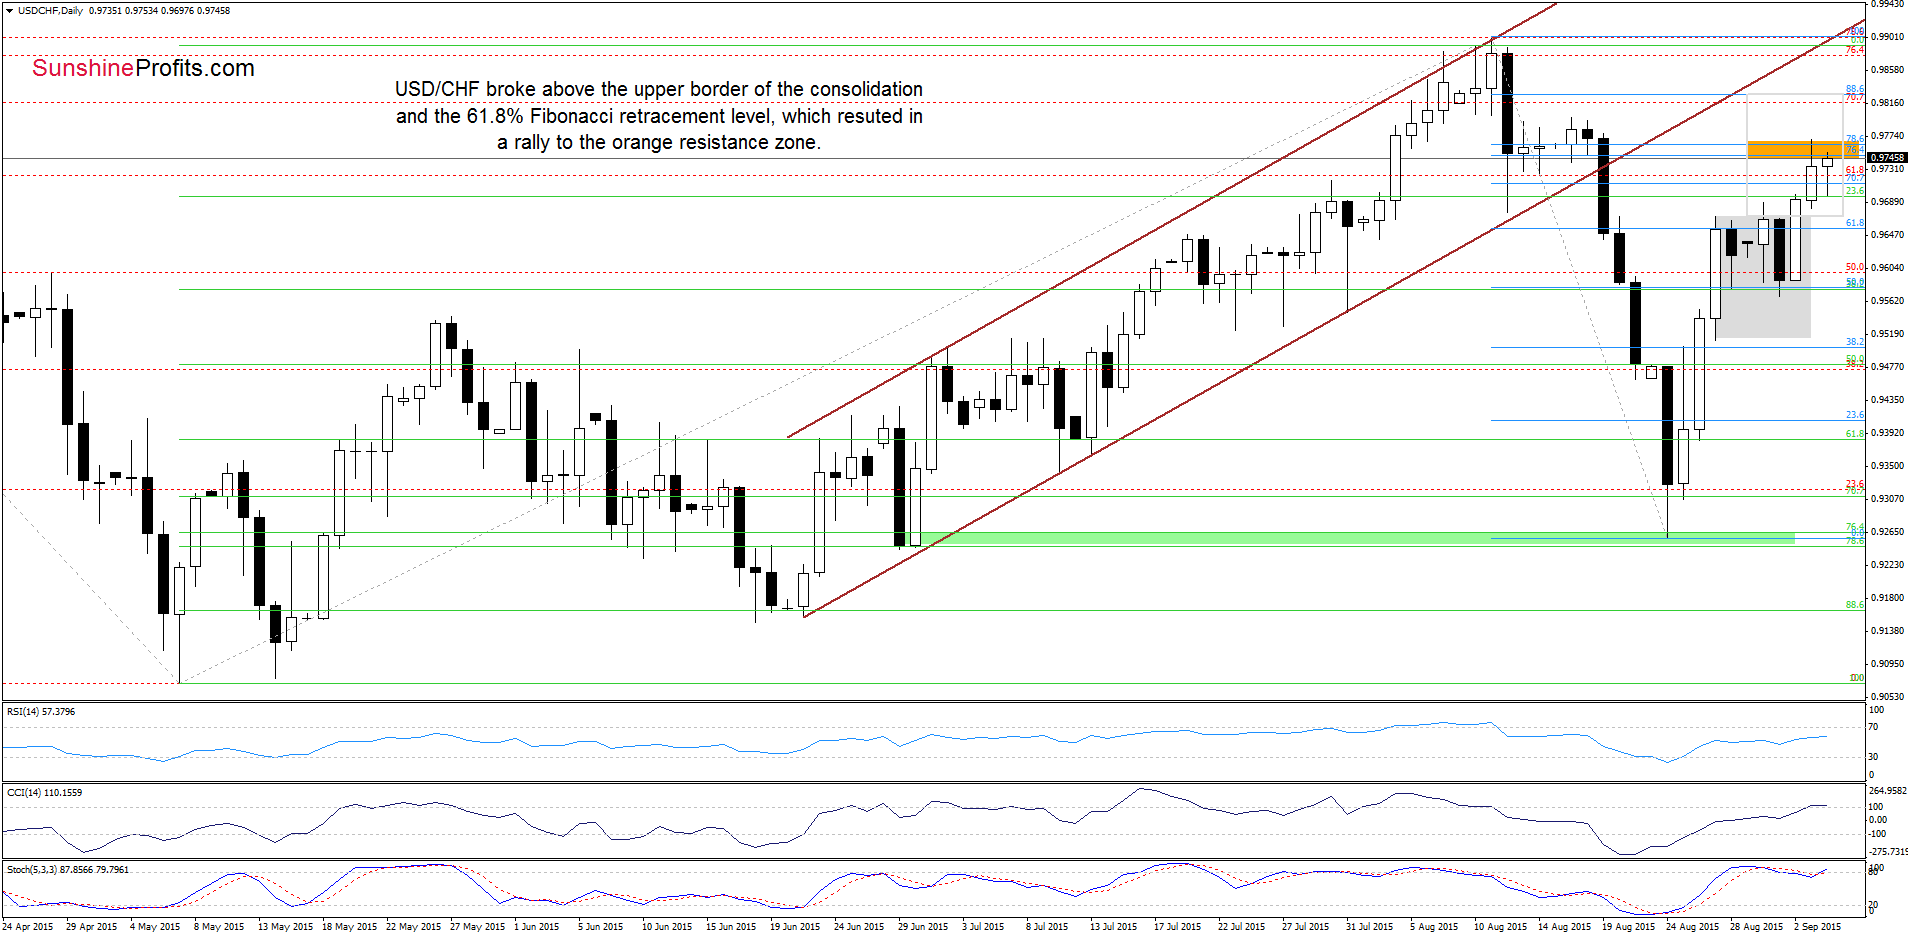
On Monday, we wrote the following:
(…) a breakout above the upper line of the formation (or breakdown below the lower border) will indicate the direction of future moves. Nevertheless, taking into account buy signals generated by the RSI and CCI it seems that currency bulls will try to push the pair higher. In this case, if the exchange rate climbs above the last week’s high, we’ll see an increase to the 70.7% retracement (around 0.9713) or even a test of the resistance zone created by the 76.4% and 78.6% Fibonacci retracements around 0.9749-0.9763.
Looking at the daily chat, we see that the situation developed in line with the above scenario and USD/CHF reached our upside target yesterday. As you see on the chart, the orange resistance zone triggered a pullback earlier today, but the exchange rate is still trading quite close to yesterday’s high, which suggests that we could see another attempt to go north (at this point it is also worth noting that a breakout above the upper border of the consolidation suggests that USD/CHF may increase even to around 0.9826, where the size of the upswing and the 88.6% Fibonacci retracement are). Nevertheless, we should keep in mind that the space for further rally seems limited as the orange resistance line (currently around 0.9793) in combination with the orange resistance zone (marked on the daily chart) could encourage currency bears to act in the coming day(s) – especially if the daily indicators generate sell signals.
Very short-term outlook: mixed
Short-term outlook: mixed
MT outlook: mixed
LT outlook: mixed
Trading position (short-term; our opinion): No positions are justified from the risk/reward perspective at the moment. We will keep you informed should anything change, or should we see a confirmation/invalidation of the above.
AUD/USD
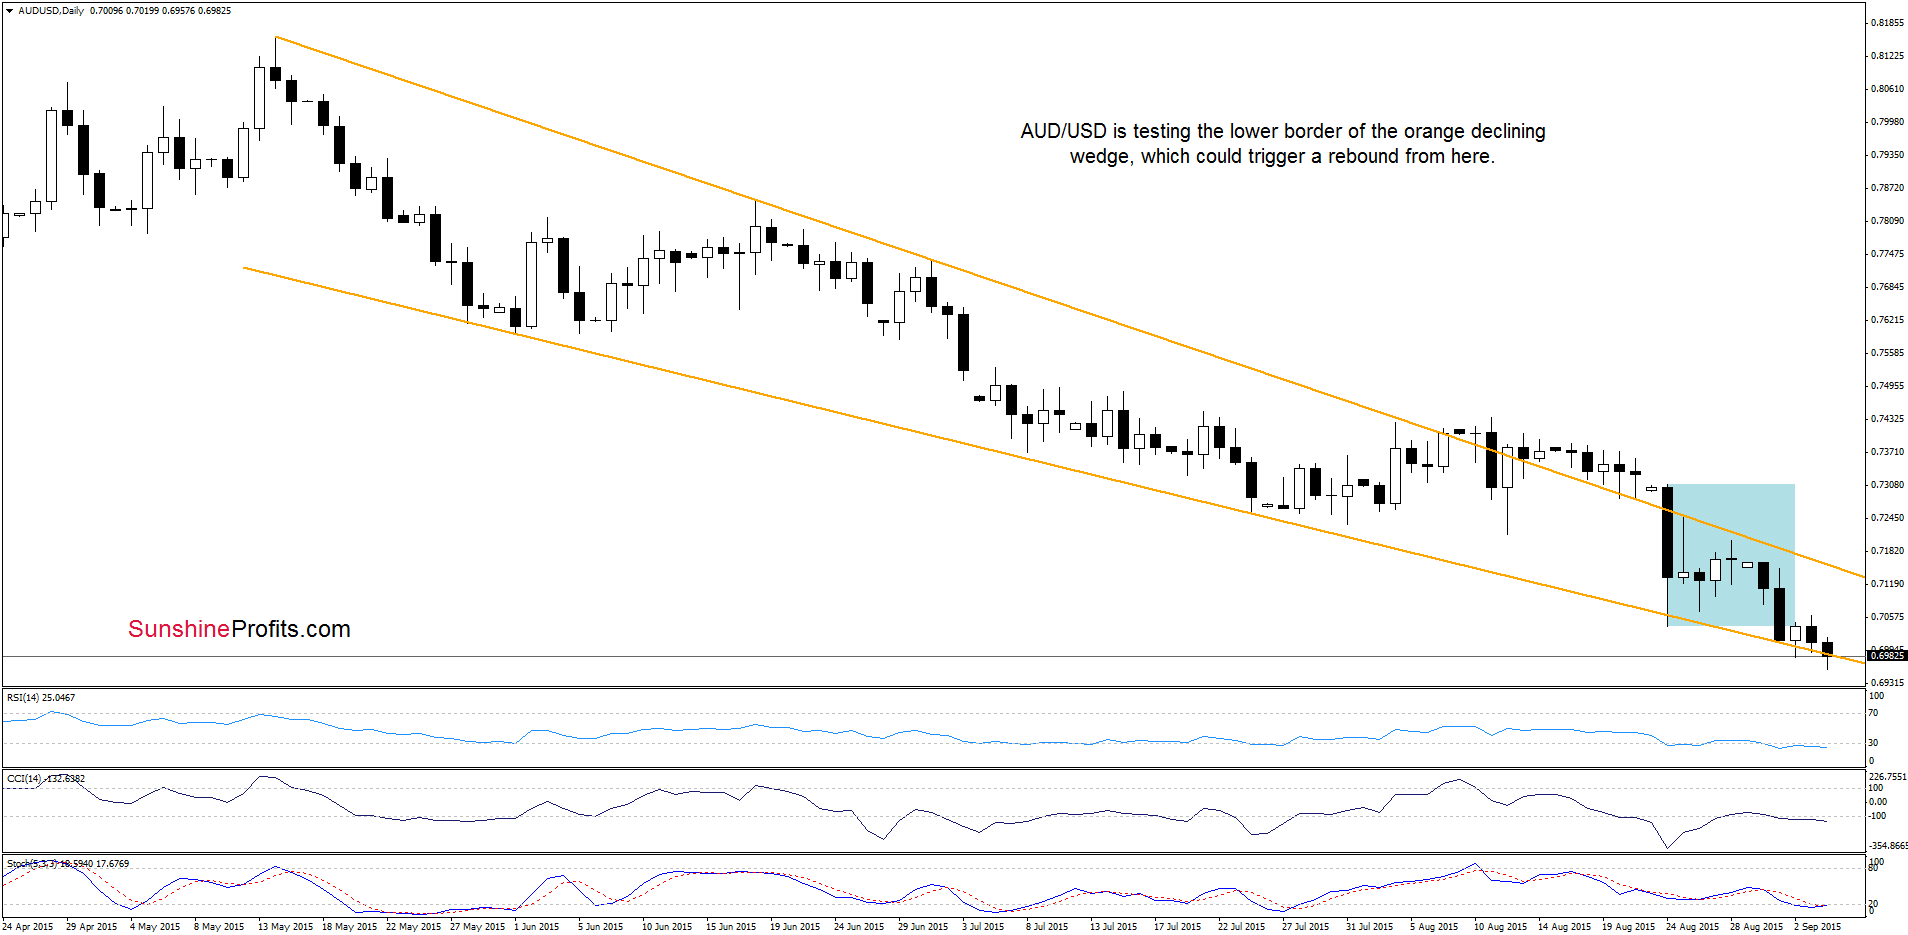
On Wednesday we wrote:
(…) Although the exchange rate could rebound from here (similarly to what we saw in previous weeks), the current position of the indicators suggests that currency bears will try to push the pair lower in the coming day(s).
Looking at the daily chart, we see that currency bears pushed the pair lower (as we had expected) and AUD/USD re-tested the lower border of the orange declining wedge. This suggests that as long as there is no daily close below this key support line, further deterioration is questionable and another rebound should not surprise us.
But what could happen if we see a successful breakdown under the orange support line? Let’s take a look at the weekly chart and find out.
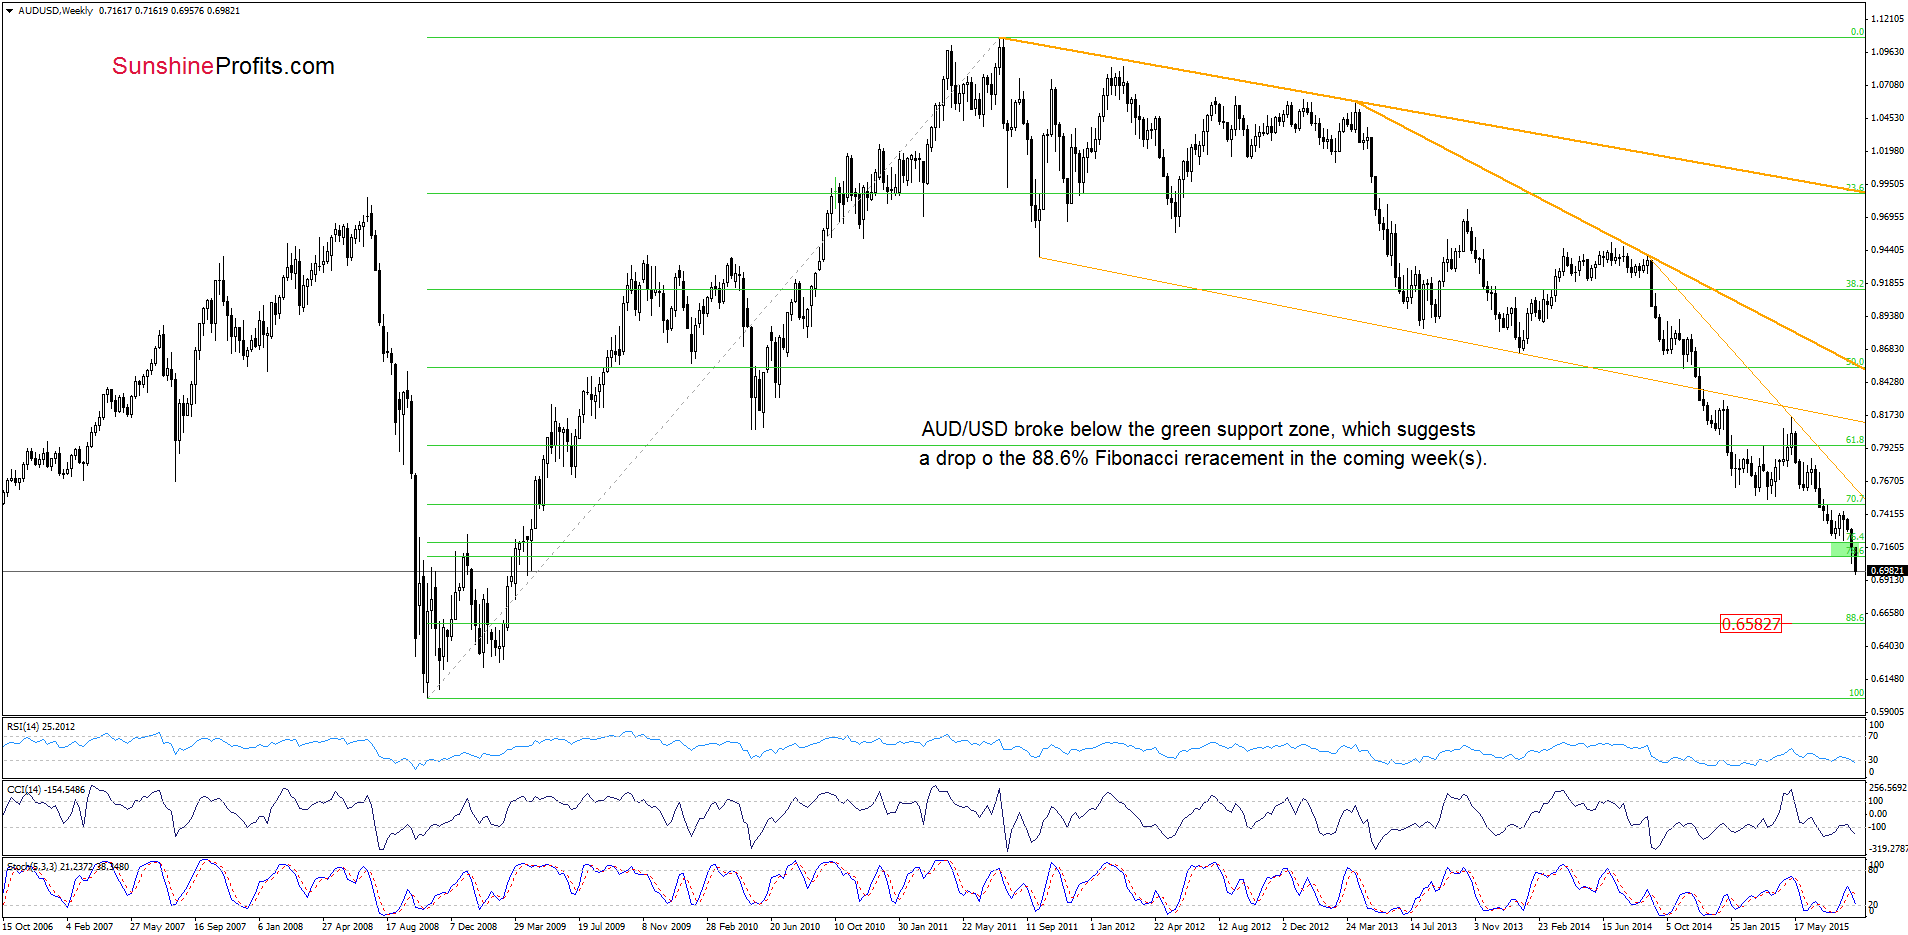
From this perspective we see that the recent downward move took AUD/USD below the green support zone (based on the 76.4% and 78.6% Fibonacci retracement levels), which suggests further deterioration and a drop even to around 0.6583, where the 88.6% Fibonacci retracement is.
Very short-term outlook: mixed with bearish bias
Short-term outlook: mixed with bearish bias
MT outlook: mixed with bearish bias
LT outlook: mixed
Trading position (short-term; our opinion): No positions are justified from the risk/reward perspective at the moment. We will keep you informed should anything change, or should we see a confirmation/invalidation of the above.
Thank you.
Nadia Simmons
Forex & Oil Trading Strategist
Przemyslaw Radomski, CFA
Founder, Editor-in-chief
Gold & Silver Trading Alerts
Forex Trading Alerts
Oil Investment Updates
Oil Trading Alerts

