

Earlier today, the University of Michigan reported that its consumer sentiment index climbed to a five-month high of 96.1 in June, beating analysts’ expectations for an unchanged reading. On top of that, the university also showed that its inflation expectations for the next 12 months remained unchanged. Thanks to these solid numbers, the USD Index moved higher and approached this week’s high. Will we see further rally? What impact could it have on our six currency pairs?
In our opinion the following forex trading positions are justified - summary:
EUR/USD
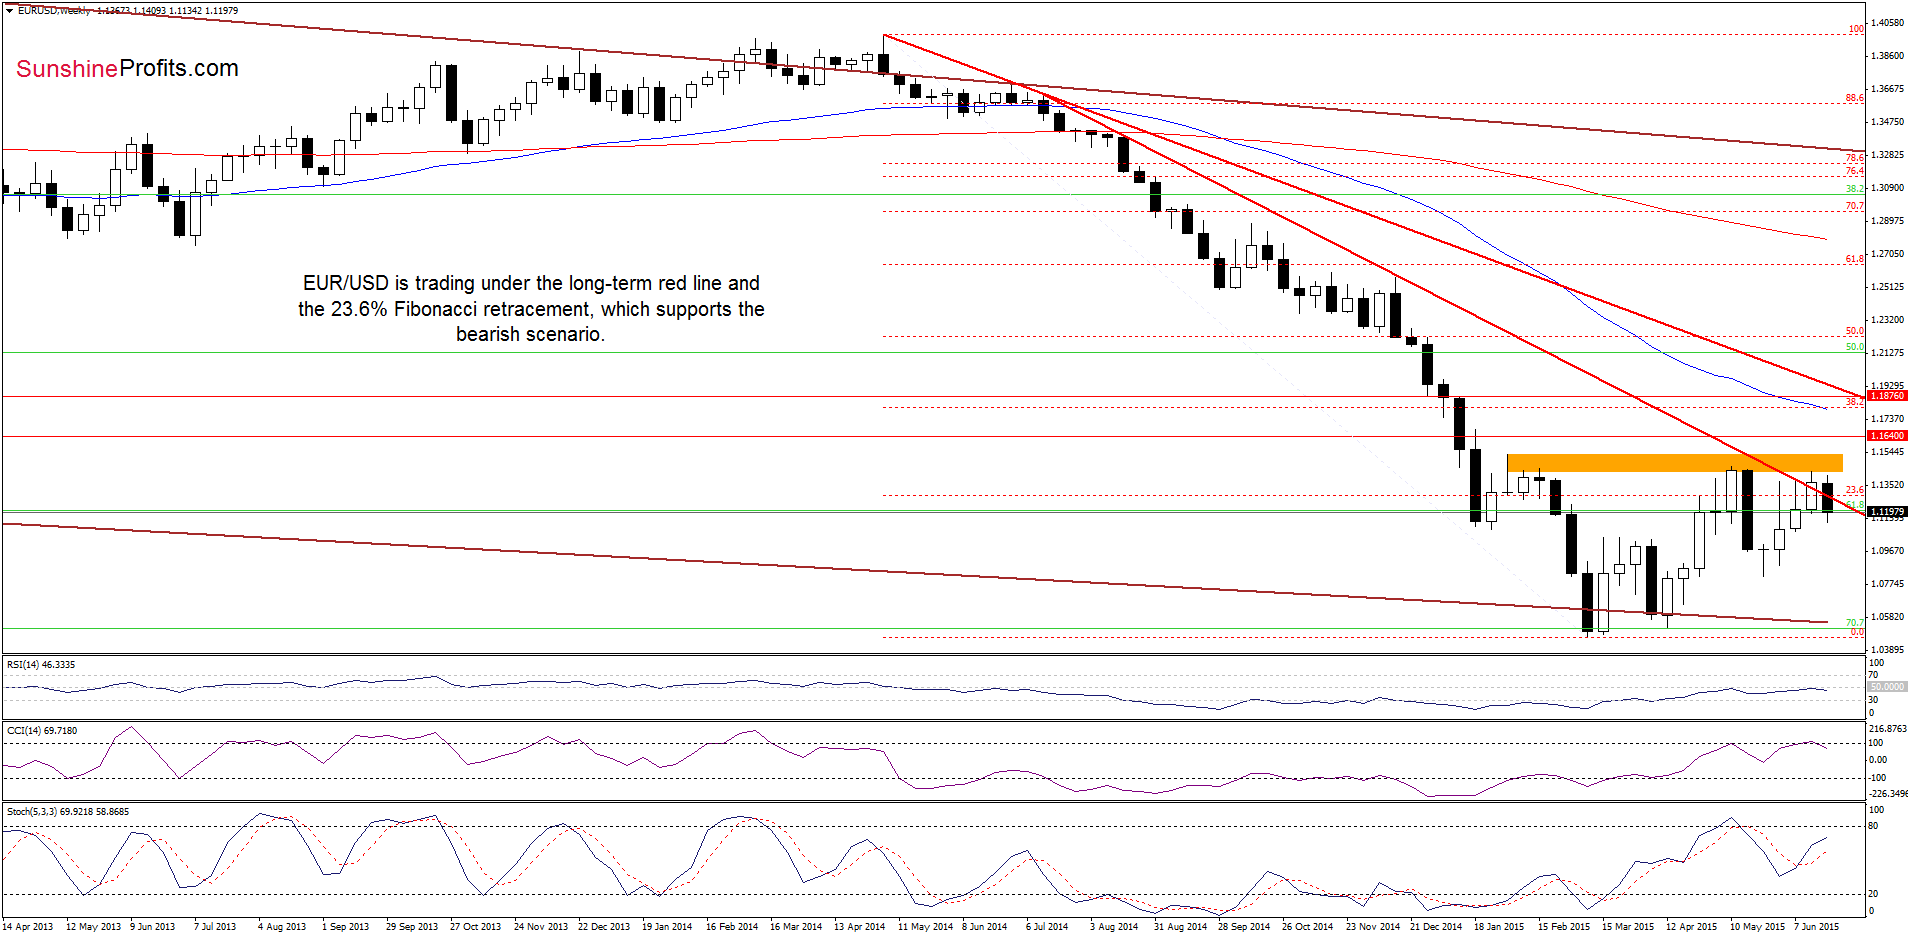
As you see on the weekly chart, EUR/USD is trading under the long-term red declining line and the 23.6% Fibonacci retracement, which means that an invalidation of earlier breakout and its negative impact on future moves are in effect, suggesting that lower values f the exchange rate are just around the corner.
Can we infer something more from the very short-term picture? Let’s examine the daily chart and find out.
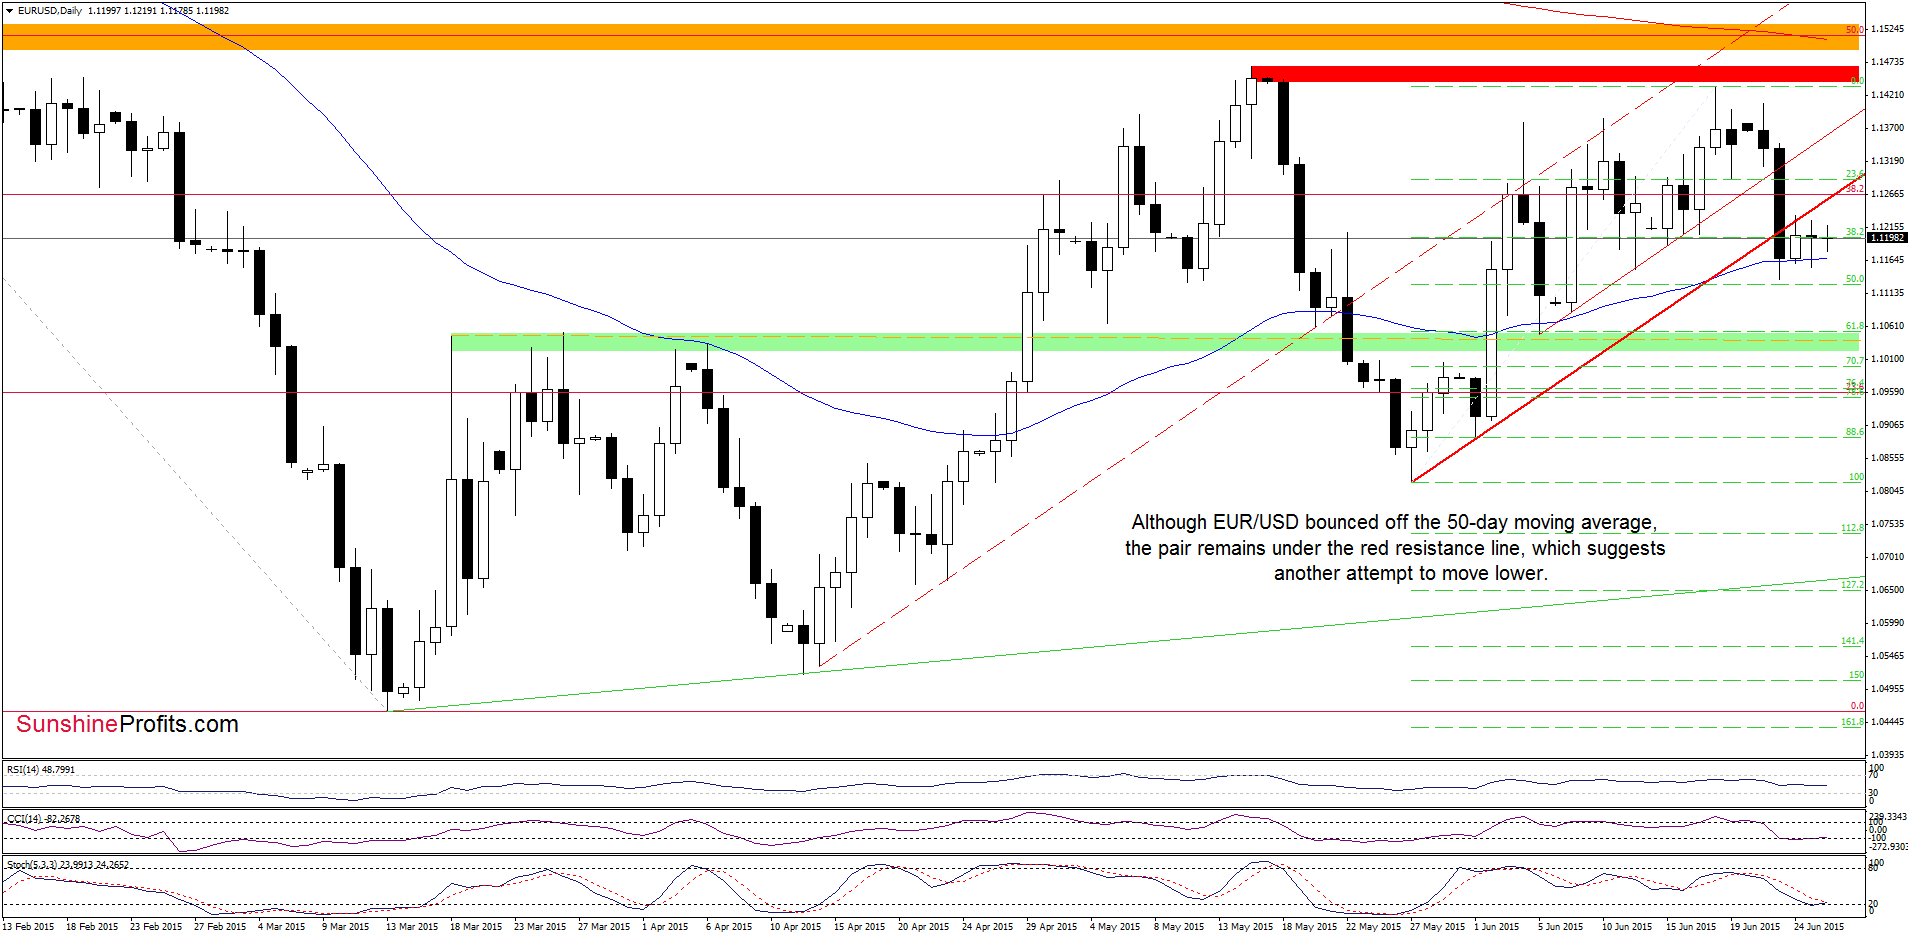
Looking at the daily chart, we see that today’s price action is very similar to what we saw yesterday (trading between the red resistance line and the 50-day moving average), therefore, our last commentary on this currency pair is up-to-date:
(…) although EUR/USD bounced off the 50-day moving average once again, the pair remains under the previously-broken red resistance line based on the May and Jun lows (it serves as the nearest resistance now), which suggests that yesterday’s upswing could be nothing more than a verification of the breakdown. If this is the case, another attempt to move lower should not surprise us (…)
Please note that if currency bears manage to push EUR/USD under the 50-day moving average, it would be a negative signal, which will likely translate to a test of the 50% Fibonacci retracement or even to the green support zone in the coming days.
Very short-term outlook: mixed with bearish bias
Short-term outlook: mixed
MT outlook: mixed
LT outlook: mixed
Trading position (short-term; our opinion): No positions are justified from the risk/reward perspective at the moment. We will keep you informed should anything change, or should we see a confirmation/invalidation of the above.
GBP/USD
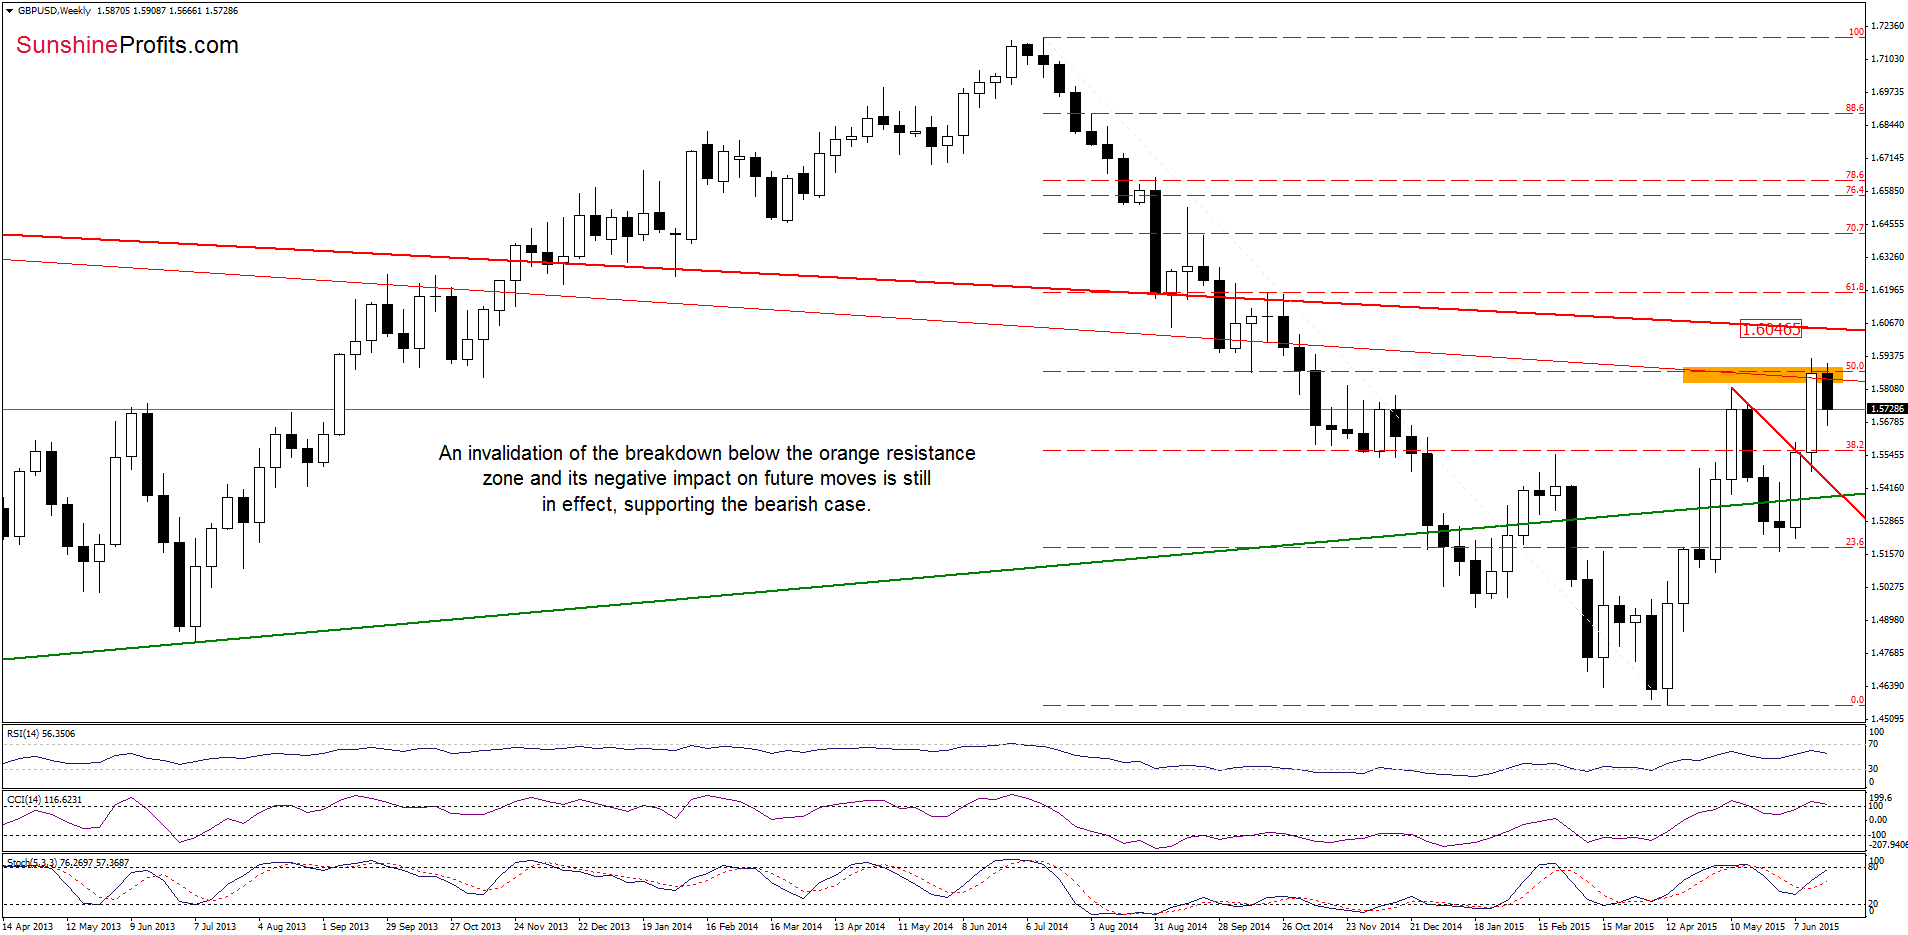
From today’s point of view we see that although GBP/USD moved slightly higher, the pair remains well below the previously-broken orange resistance zone (created by the 50% Fibonacci retracement and the red resistance line based on the previous highs), which suggests that lower values of the exchange rate are just around the corner.
Will the very short-term picture give us more clues about future moves? Let’s check.
On Wednesday, we wrote the following:
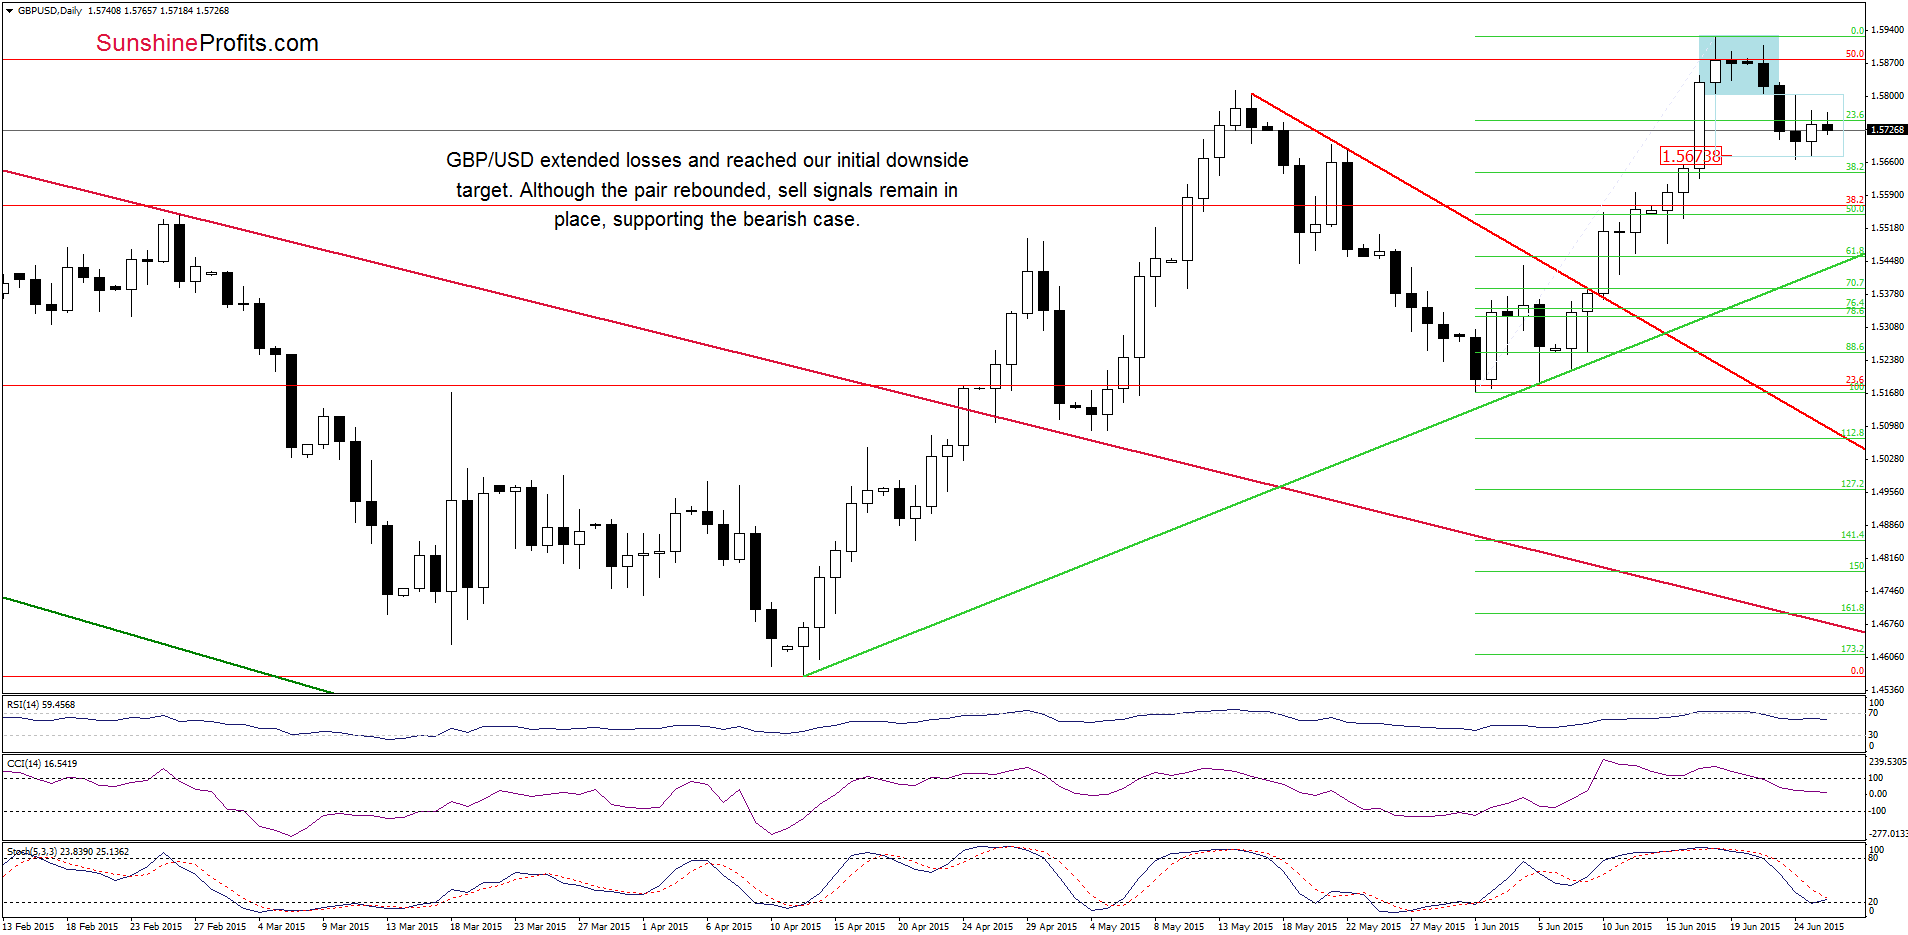
(…) GBP/USD broke below the lower border of the consolidation (marked with blue), which triggered a sharp decline. Although the pair rebounded earlier today, the lower line of the formation (which serves as resistance now) stopped further improvement, which suggests that today’s upswing could be nothing more than a verification of yesterday’s breakdown. If this is the case and the exchange rate declines from here, it would be a bearish signal, which will trigger a drop to at least 1.5674, where the size of the downward move will correspond to the height of the consolidation.
Looking at the daily chart, we see that the situation developed in line with the above scenario and GBP/USD reached our downside target. Although the exchange rate moved higher after this drop, the pair remains under the lower line of the formation (it serves as resistance now), which suggests that as long as there is no comeback above it another attempt to move lower should not surprise us. Please note that if the pair breaks below the recent low, the initial downside target for currency bears would be the 38.2% Fibonacci retracement (around 1.5633).
Very short-term outlook: mixed with bearish bias
Short-term outlook: mixed with bearish bias
MT outlook: mixed
LT outlook: mixed
Trading position (short-term; our opinion): No positions are justified from the risk/reward perspective at the moment. We will keep you informed should anything change, or should we see a confirmation/invalidation of the above.
USD/JPY
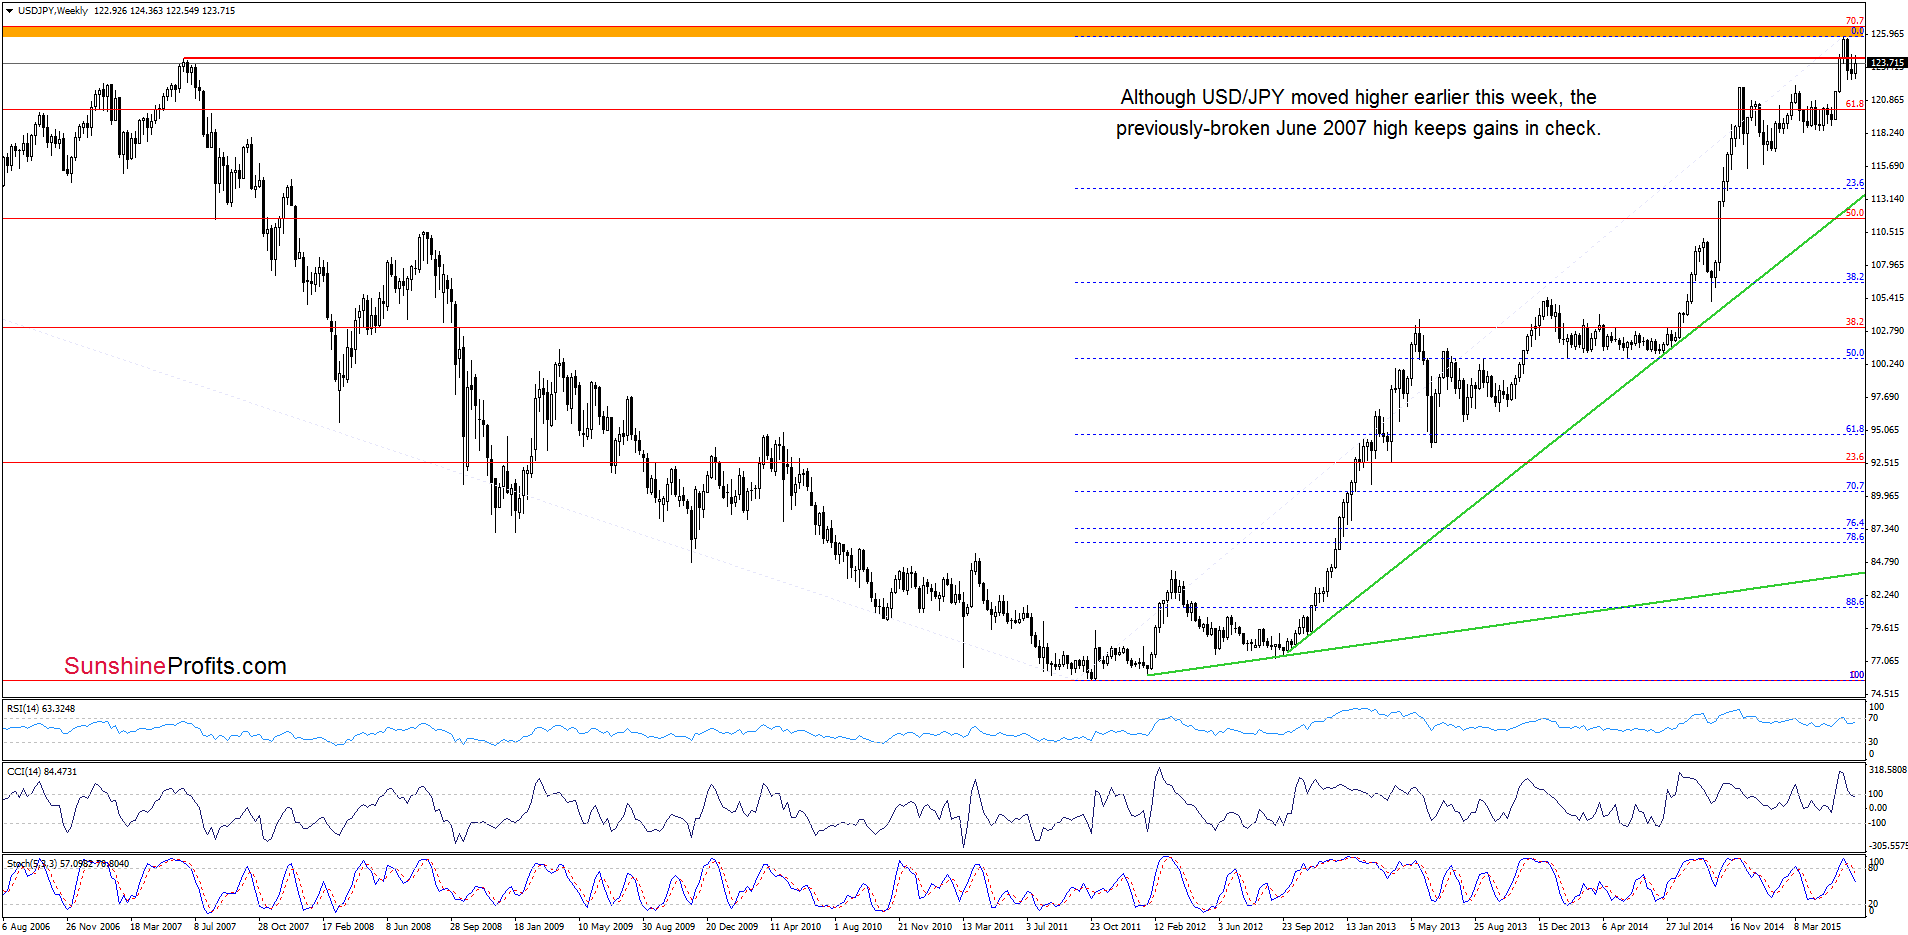
The situation in the medium term hasn’t changed much as USD/JPY is trading under the previously-broken June 2007 high, which continues to keep gains in check.
Having said that, let’s examine the daily chart.
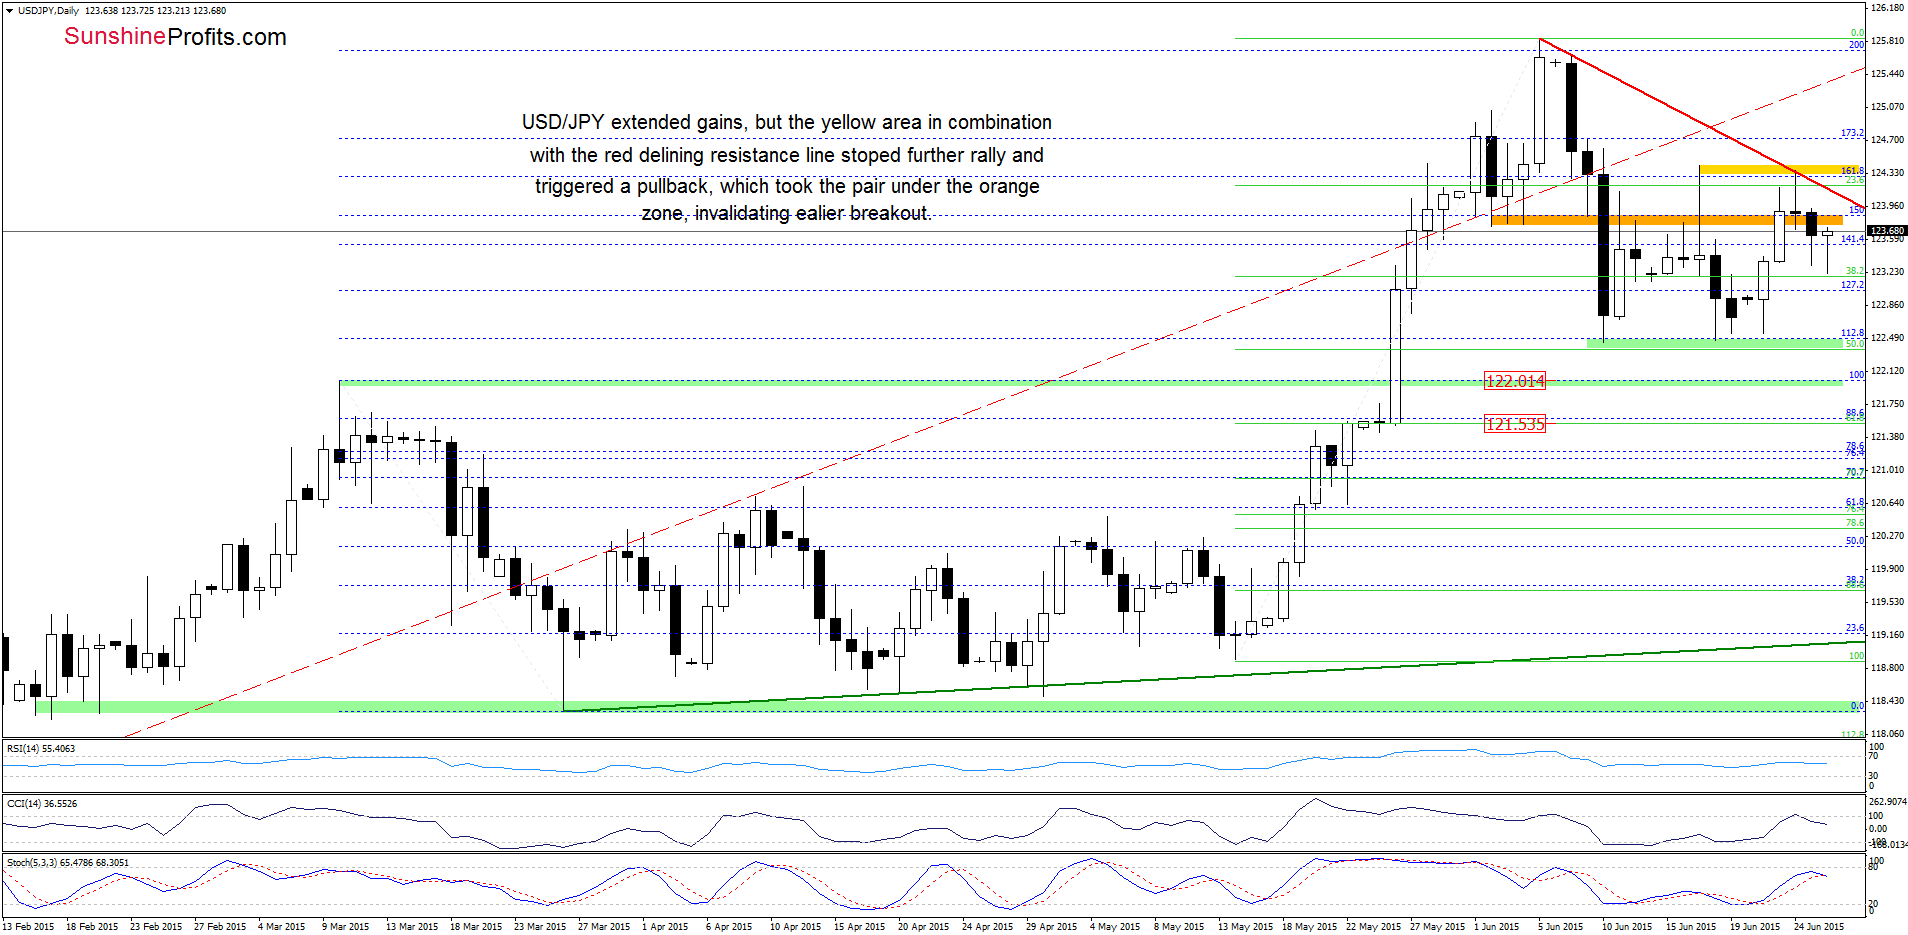
As you see on the chart, USD/JPY extended gains earlier this week, but the combination of the yellow area (based on the last week’s high) and the red declining resistance line stopped further improvement, triggering a pullback, which took the pair below the previously-broke orange zone. In this way, the exchange rate invalidated earlier breakout, which resulted in a drop to the 38.2% Fibonacci retracement. Although USD/JPY could rebound from here (and re-test the strength of the red resistance line), we think that as long as there is no breakout above the yellow area, further improvement is not likely to be seen - especially when we factor in the medium-term resistance level and the current position of daily indicators (the CCI generated a sell signal, while the Stochastic Oscillator is very close to doing the same).
Very short-term outlook: mixed with bearish bias
Short-term outlook: mixed
MT outlook: mixed
LT outlook: bullish
Trading position (short-term; our opinion): No positions are justified from the risk/reward perspective at the moment. We will keep you informed should anything change, or should we see a confirmation/invalidation of the above.
USD/CAD
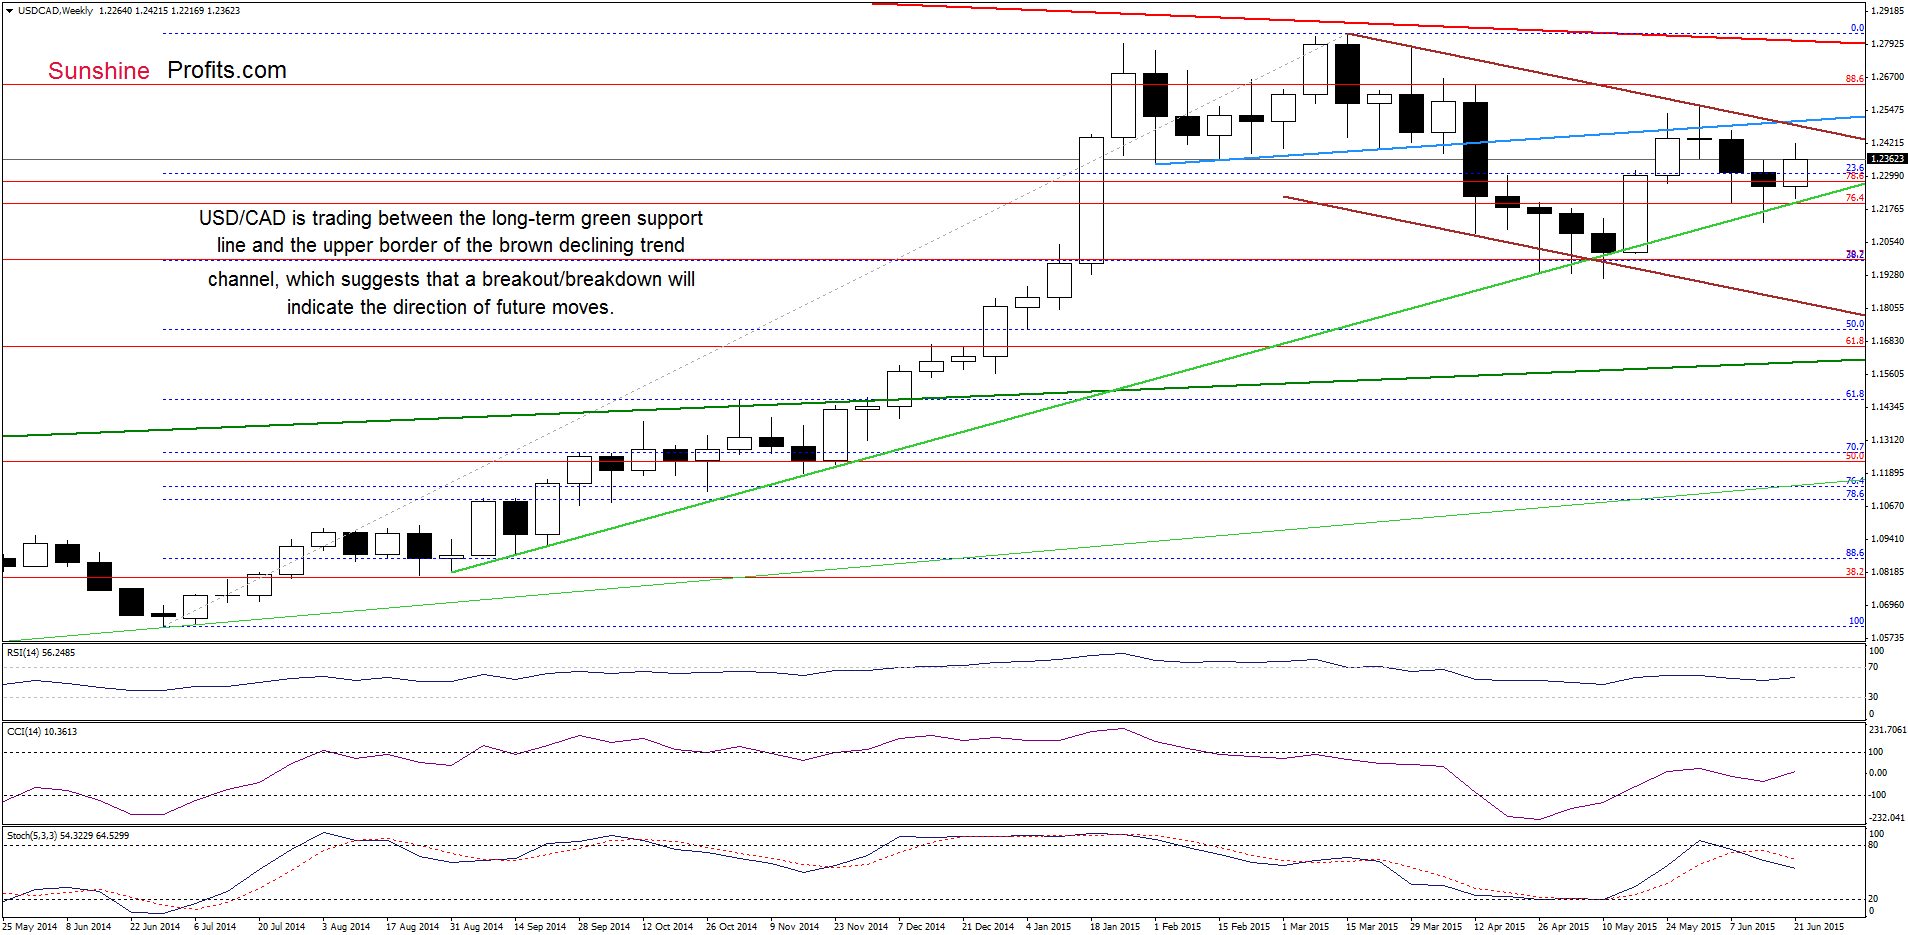
From today’s point of view we see that the situation in the medium term hasn’t changed much as USD/CAD is trading between the long-term green support line and the upper border of the brown declining trend channel. This suggests that a breakout/breakdown will indicate the direction of future moves.
Will the daily chart give us more clues? Let’s take a closer look and find out.
Quoting our yesterday’s Forex Trading Alert:
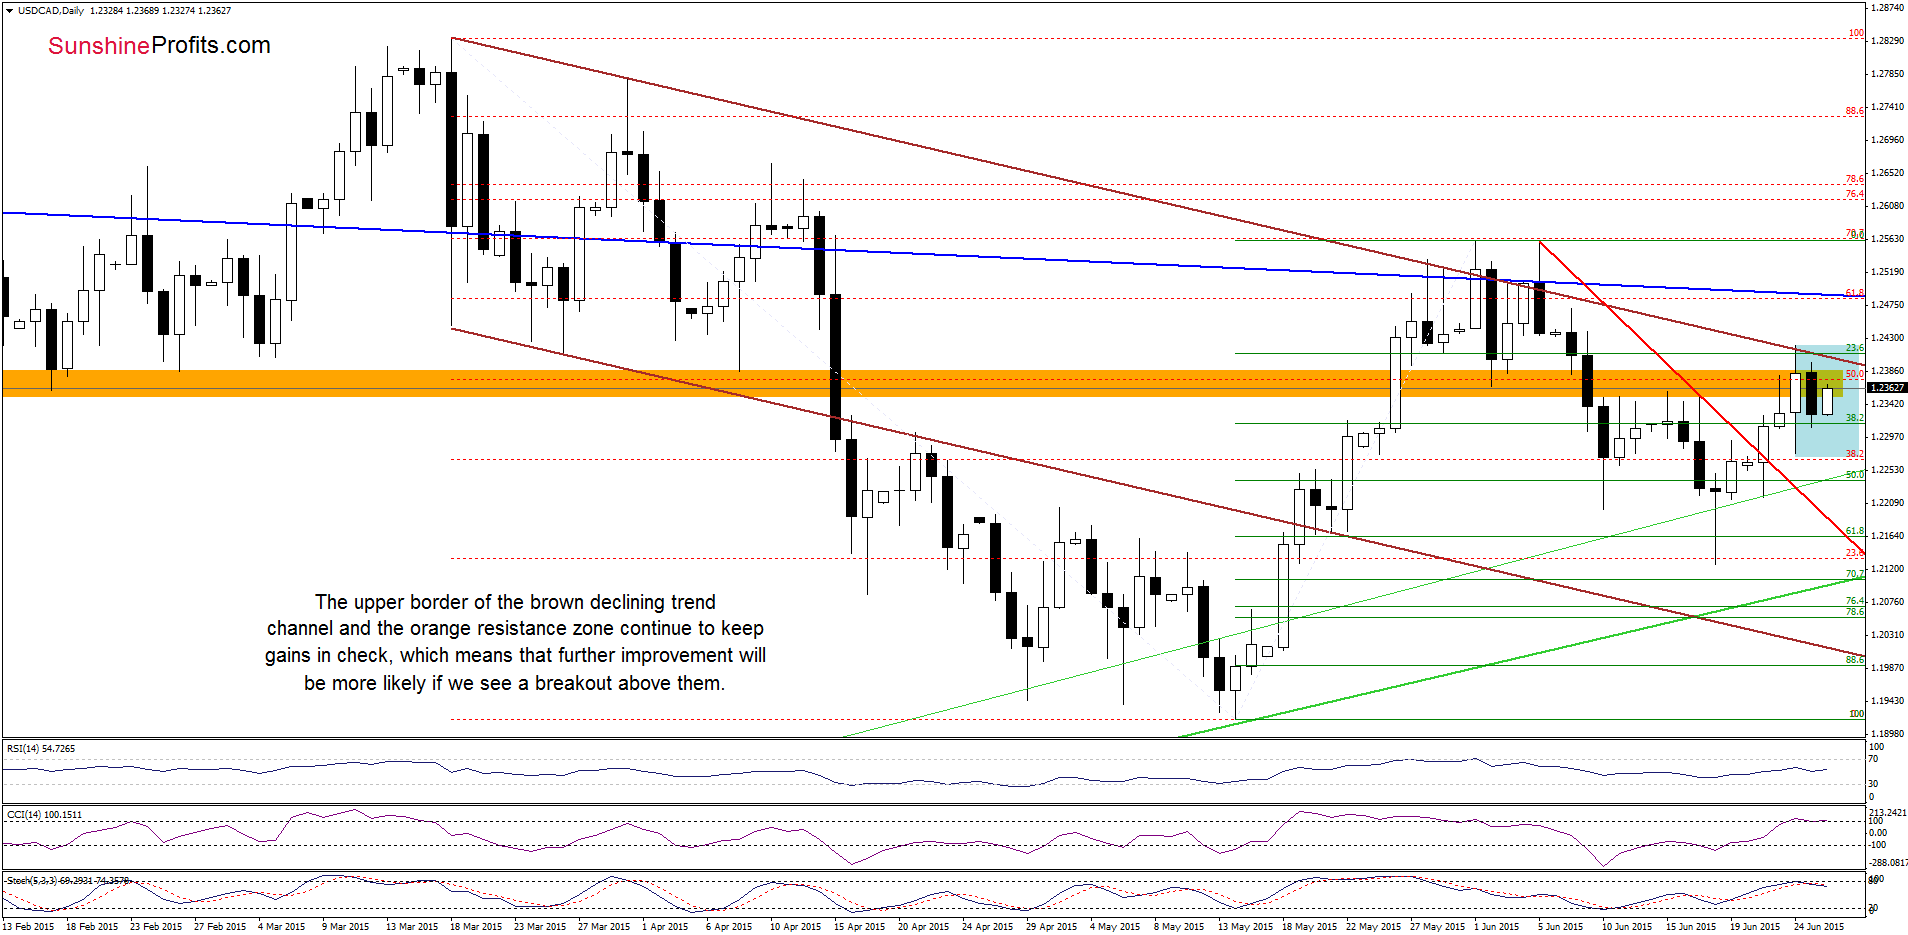
(…) the orange resistance zone and the upper border of the brown declining trend channel. At the beginning of the month this solid resistance line was strong enough to stop further rally and trigger a correction. Taking this fact into account, and combining it with the current position of the indicators (the CCI is overbought, while the Stochastic Oscillator climbed to the level of 80), it seems that a pullback from here is more likely than not.
Looking at the daily chart, we see that currency bears pushed USD/CAD lower as we had expected. With this downswing, the pair invalidated earlier breakout above the orange resistance zone, which is a negative signal that suggests lower values of the exchange rate. Although the pair rebounded slightly earlier today, we believe that as long as there is no breakout above the upper border of the brown declining trend channel further rally is not likely to be seen (especially when we take into account the position of the indicators).
Very short-term outlook: mixed with bearish bias
Short-term outlook: mixed
MT outlook: mixed
LT outlook: mixed
Trading position (short-term; our opinion): No positions are justified from the risk/reward perspective at the moment. We will keep you informed should anything change, or should we see a confirmation/invalidation of the above.
USD/CHF
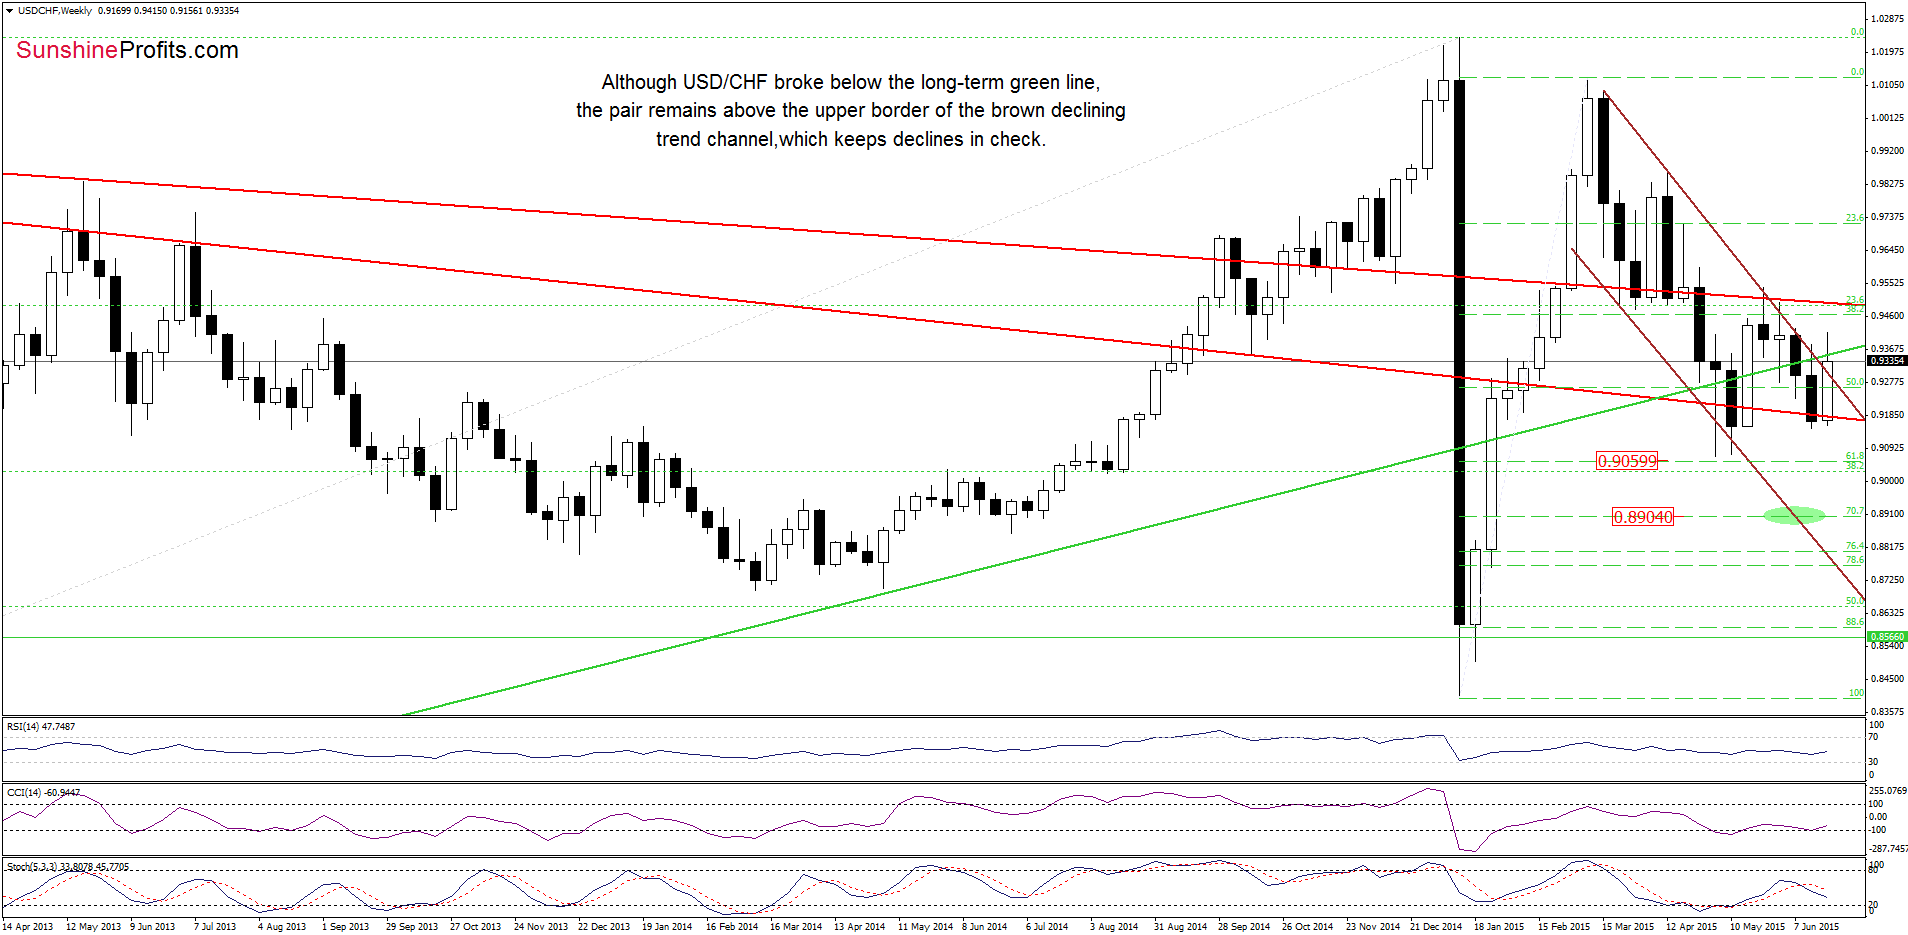
On the weekly chart, we see that the situation in the medium term has deteriorated slightly as USD/CHF pulled back and slipped under the long-term green line, invalidating earlier breakout. Although this is a negative signal that suggests further deterioration, the pair remains above the previously-broken upper border of the brown declining trend channel, which keeps declines in check. Nevertheless, if the exchange rate extends losses and closes the week below it, this would be a bearish signal that will likely trigger a drop to the long-term red support line in the following week.
How did this drop affect the very short-term picture? Let’s check.
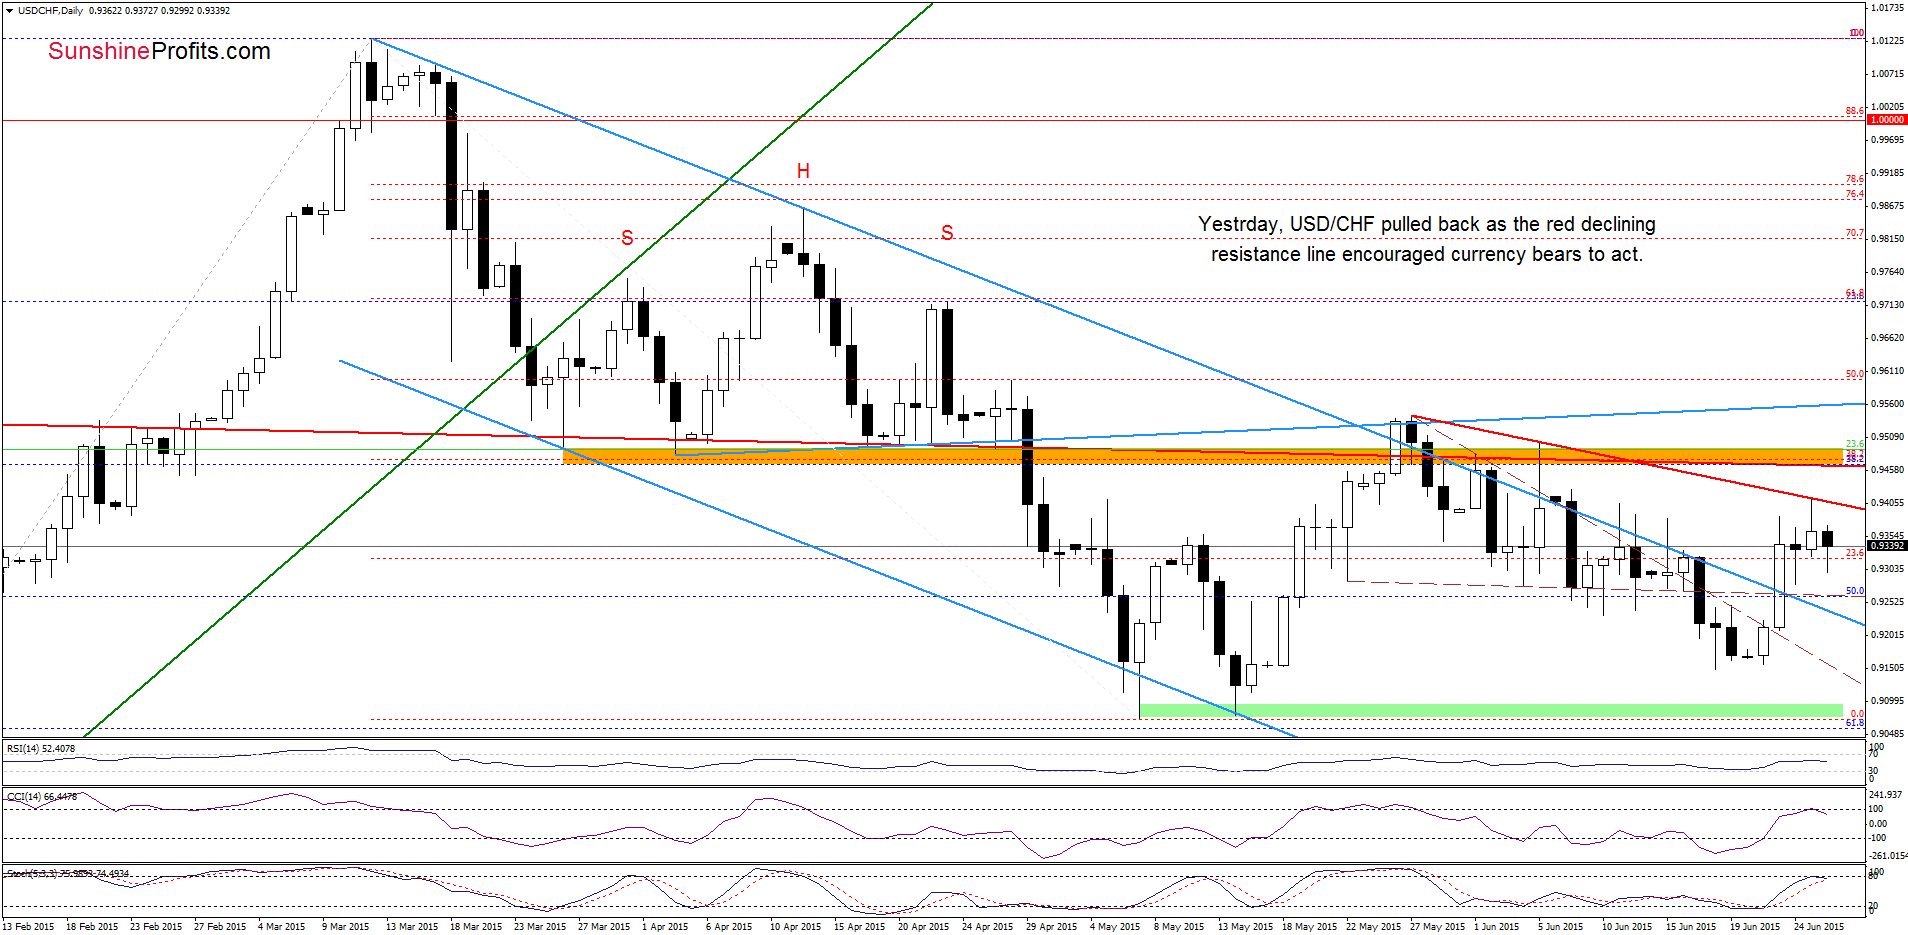
Yesterday, USD/CHF moved sharply higher and reached the red resistance line based on the May 27 and June5 highs, which encouraged currency bears to act. As a result, the pair pulled back and erased almost 40% of earlier upward move. What’s next? Taking into account the current position of the indicators (the CCI and Stochastic Oscillator generated sell signals) and combining it with the medium-term picture, we think that lower values of USD/CHF in the coming week are likely. If this is the case, and the pair moves lower from here, the downside target for currency bears would be around 0.9242, where the previously-broken upper border of the blue declining trend channel currently is.
Very short-term outlook: mixed with bearish bias
Short-term outlook: mixed
MT outlook: mixed
LT outlook: mixed
Trading position (short-term; our opinion): No positions are justified from the risk/reward perspective at the moment. We will keep you informed should anything change, or should we see a confirmation/invalidation of the above.
AUD/USD
On Wednesday, we wrote the following:
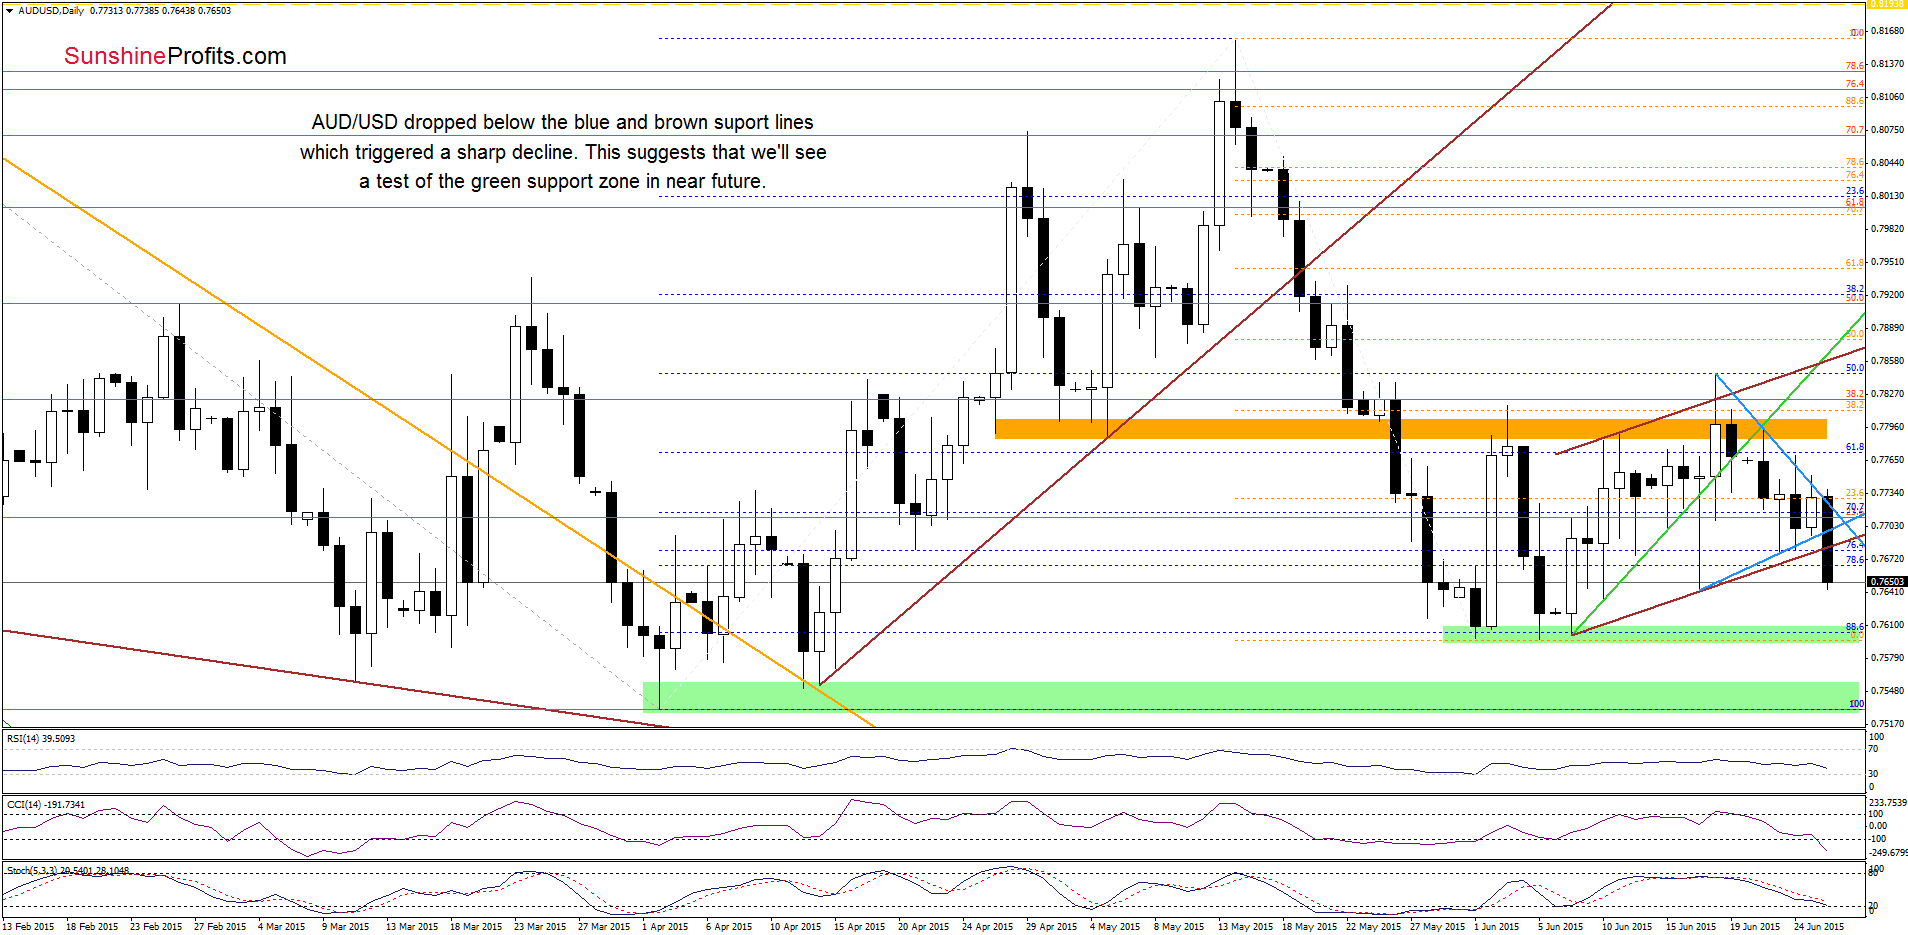
(…) the exchange rate rebounded and reached the blue resistance line created by the recent highs. When we take a closer look at the daily chart, we notice that this line is also the upper border of the blue triangle. Taking this fact into account, we think that as long as there is no successful breakout (a daily close) above this line further rally is not likely to be seen and another downswing (to the lower border of the formation) should not surprise us.
Earlier today, currency bulls tried to push AUD/USD above the blue resistance line, but they failed once again, which translated to a sharp decline that took the exchange rate not only to our initial downside target (the lower border of the triangle), but also below the brown support line (the lower line of the rising trend channel). This is a bearish signal, which suggests further deterioration and a test of the green support zone created by the recent lows.
Are there any technical factors that could hinder the realization of the above scenario? Let’s examine the weekly chart and find out.
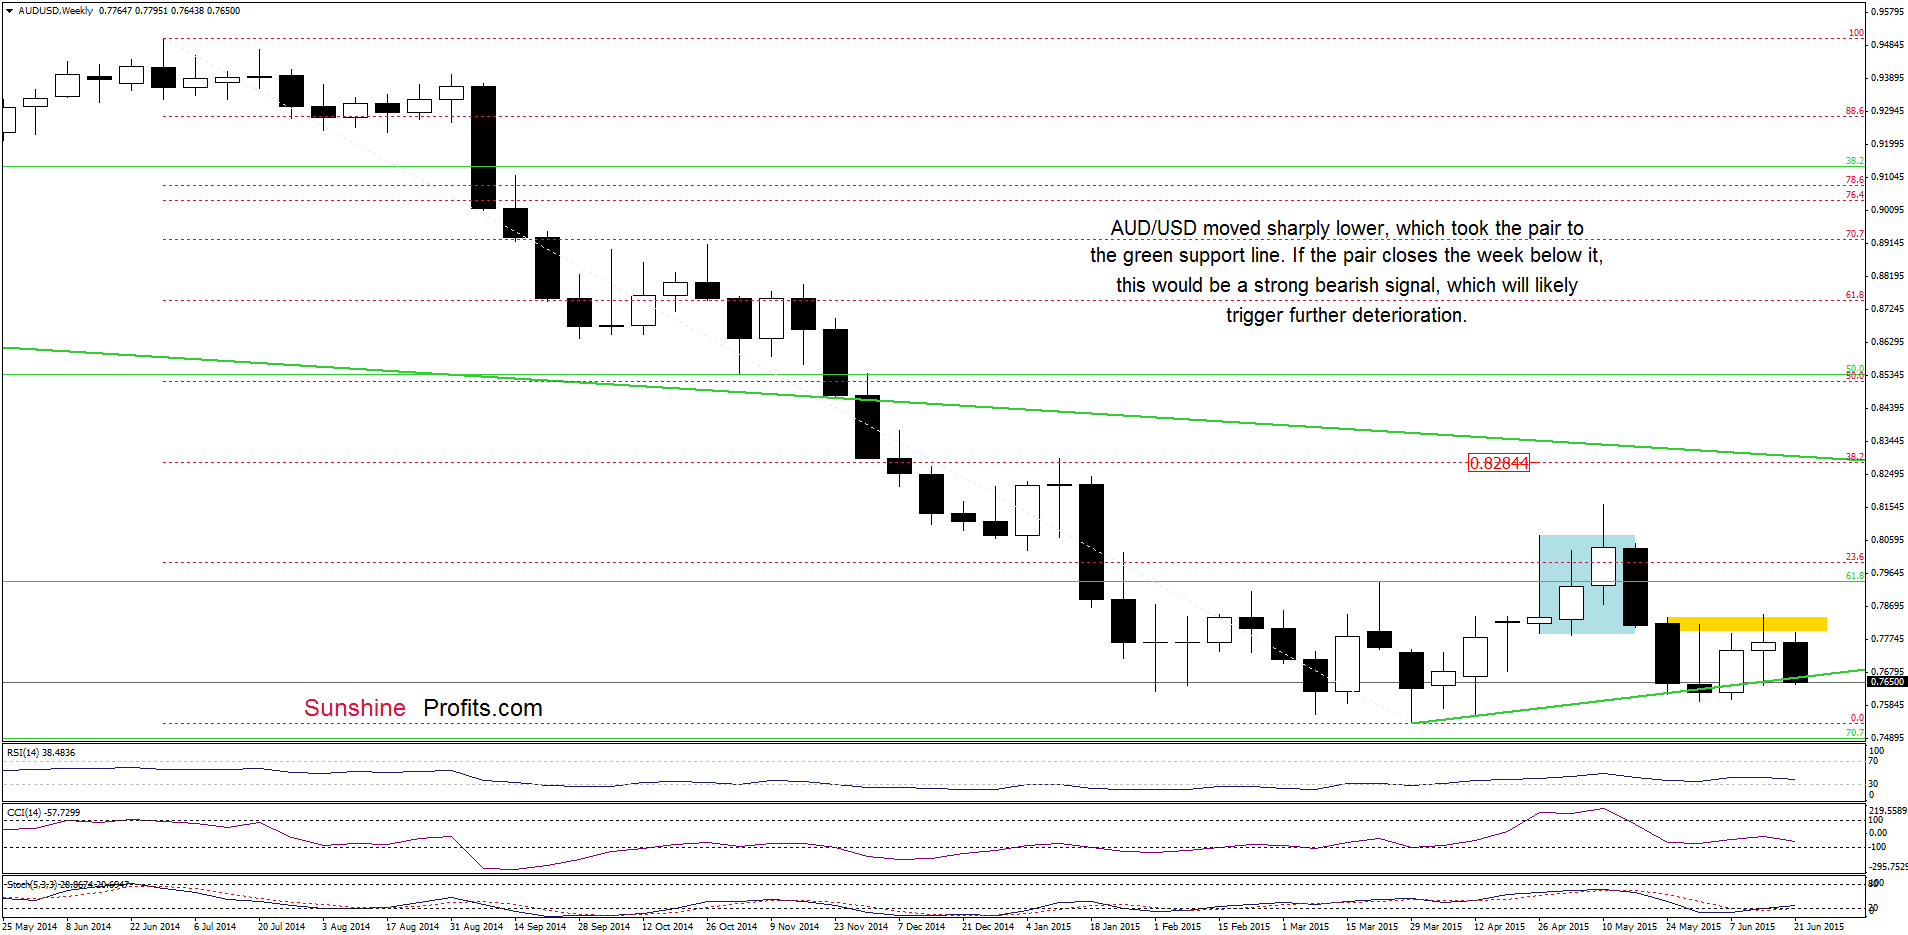
From this perspective, we see that the situation in the medium term has deteriorated as AUD/USD declined sharply to the green line. In the previous weeks, this support was strong enough to stop further declines and trigger a rebound, which suggests that we could see similar price action in the near future. Nevertheless, if the pair closes the week under this line, it would be a strong bearish signal, which will likely encourage currency bears to push the exchange rate to around 0.7596-0.7601, where the May and June lows are.
Very short-term outlook: mixed with bearish bias
Short-term outlook: mixed
MT outlook: mixed
LT outlook: mixed
Trading position (short-term; our opinion): No positions are justified from the risk/reward perspective at the moment. We will keep you informed should anything change, or should we see a confirmation/invalidation of the above.
Thank you.
Nadia Simmons
Forex & Oil Trading Strategist
Przemyslaw Radomski, CFA
Founder, Editor-in-chief
Gold & Silver Trading Alerts
Forex Trading Alerts
Oil Investment Updates
Oil Trading Alerts

