

Ongoing concerns over Greece’s repayments to the International Monetary Fund boosted the safe-haven buying and pushed the Swiss franc to a one-month high against the U.S. dollar. In this way, USD/CHF reached the short-term support, but will it withstand the selling pressure in the coming days?
In our opinion the following forex trading positions are justified - summary:
- EUR/USD: Short positions (stop-loss order at 1.1667)
- GBP/USD: Short positions (stop-loss order at 1.5913)
- USD/JPY: none
- USD/CAD: Long positions (stop-loss order at 1.1706)
- USD/CHF: none
- AUD/USD: Short positions (stop-loss order at 0.8194)
EUR/USD
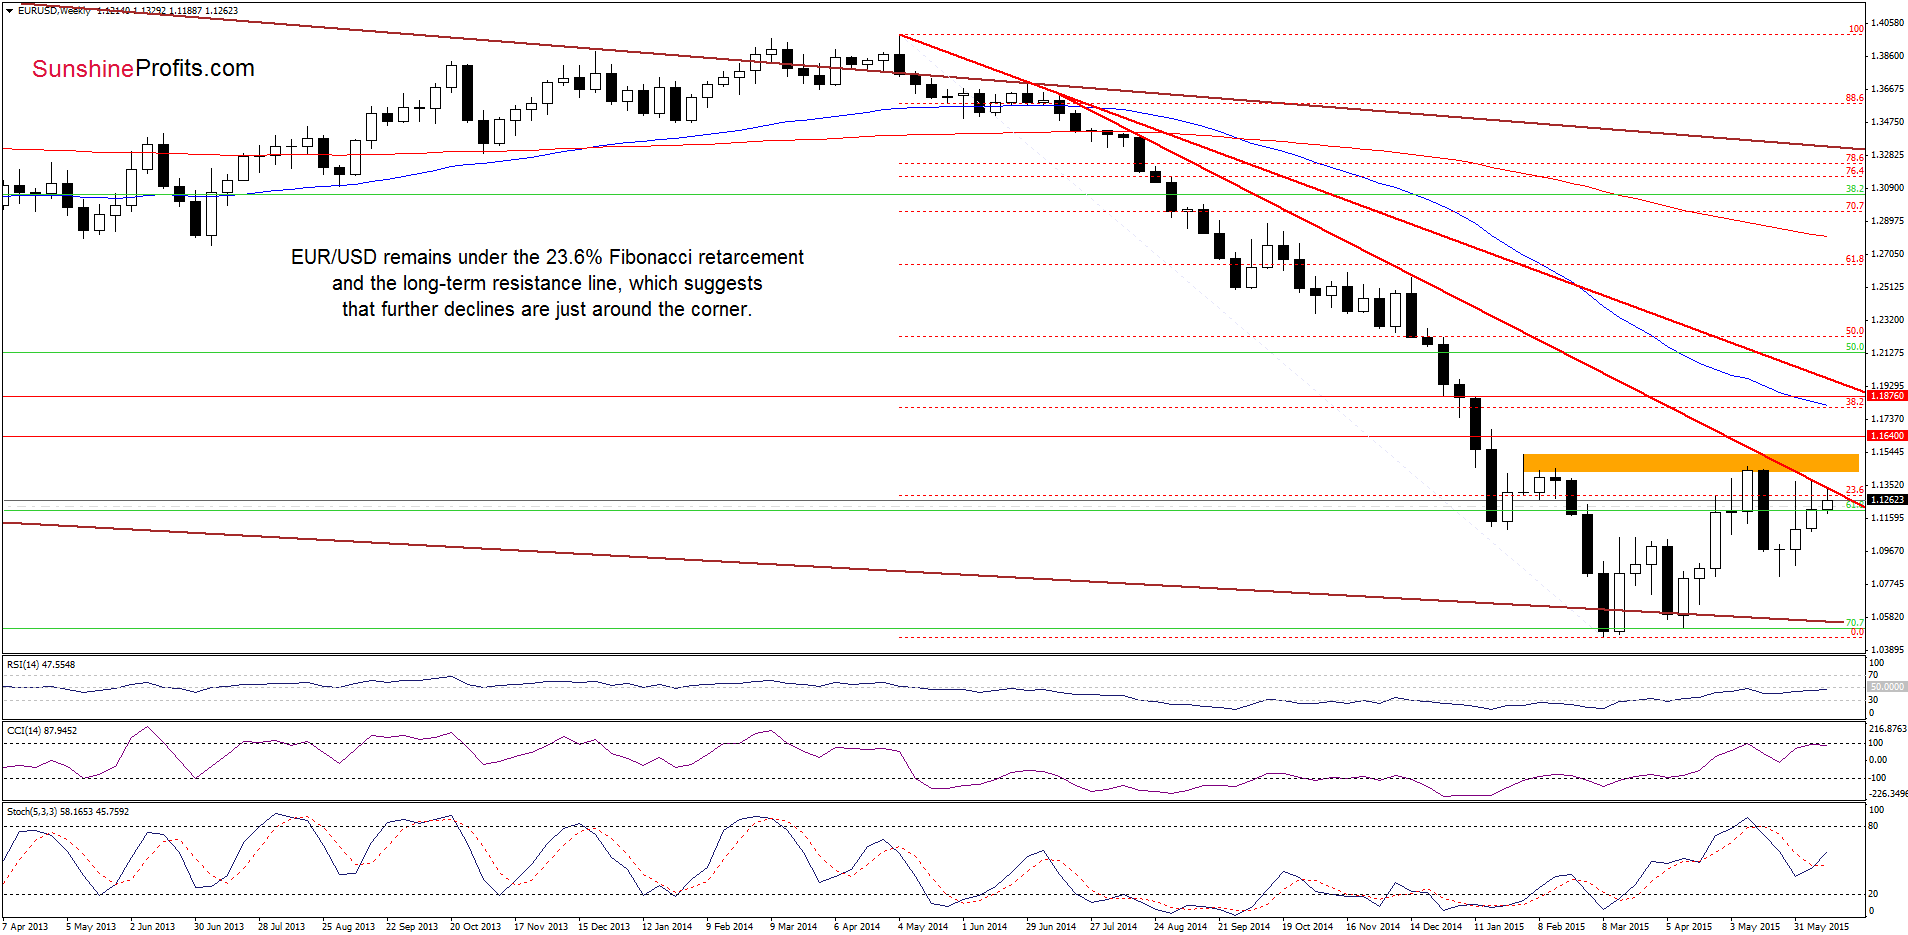
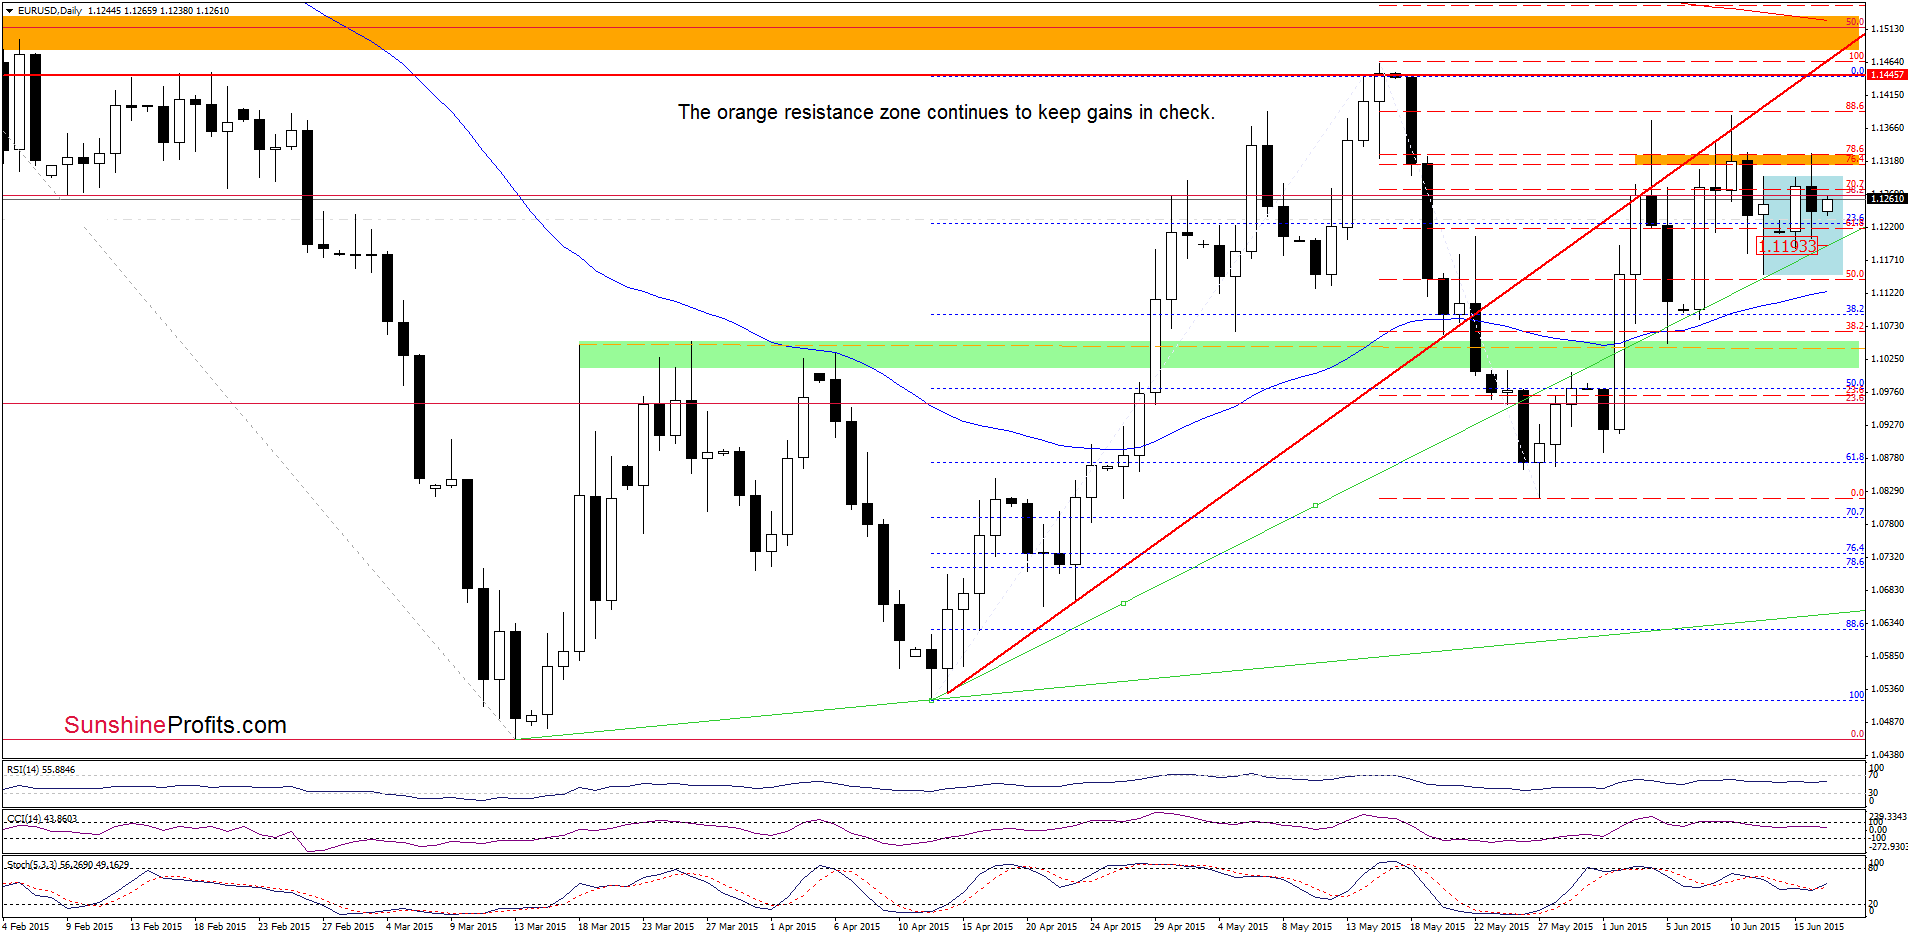
Looking at the above charts we see that EUR/USD is trading in the consolidation (marked with blue) under the very strong resistance area created by the orange resistance zone (seen on the daily chart), the long-term red declining line and the 23.6% Fibonacci retracement (marked on the weekly chart), which means that as long as there is no successful breakout above these levels further improvement is not likely to be seen and another attempt to move lower should not surprise us. If this is the case, and the pair moves lower from here, the initial downside target would be around 1.1193, where the green support line is.
Very short-term outlook: bearish
Short-term outlook: mixed with bearish bias
MT outlook: mixed
LT outlook: mixed
Trading position (short-term; our opinion): Short positions with a stop-loss order at 1.1667 are justified from the risk/reward perspective at the moment. We will keep you informed should anything change, or should we see a confirmation/invalidation of the above.
USD/CHF
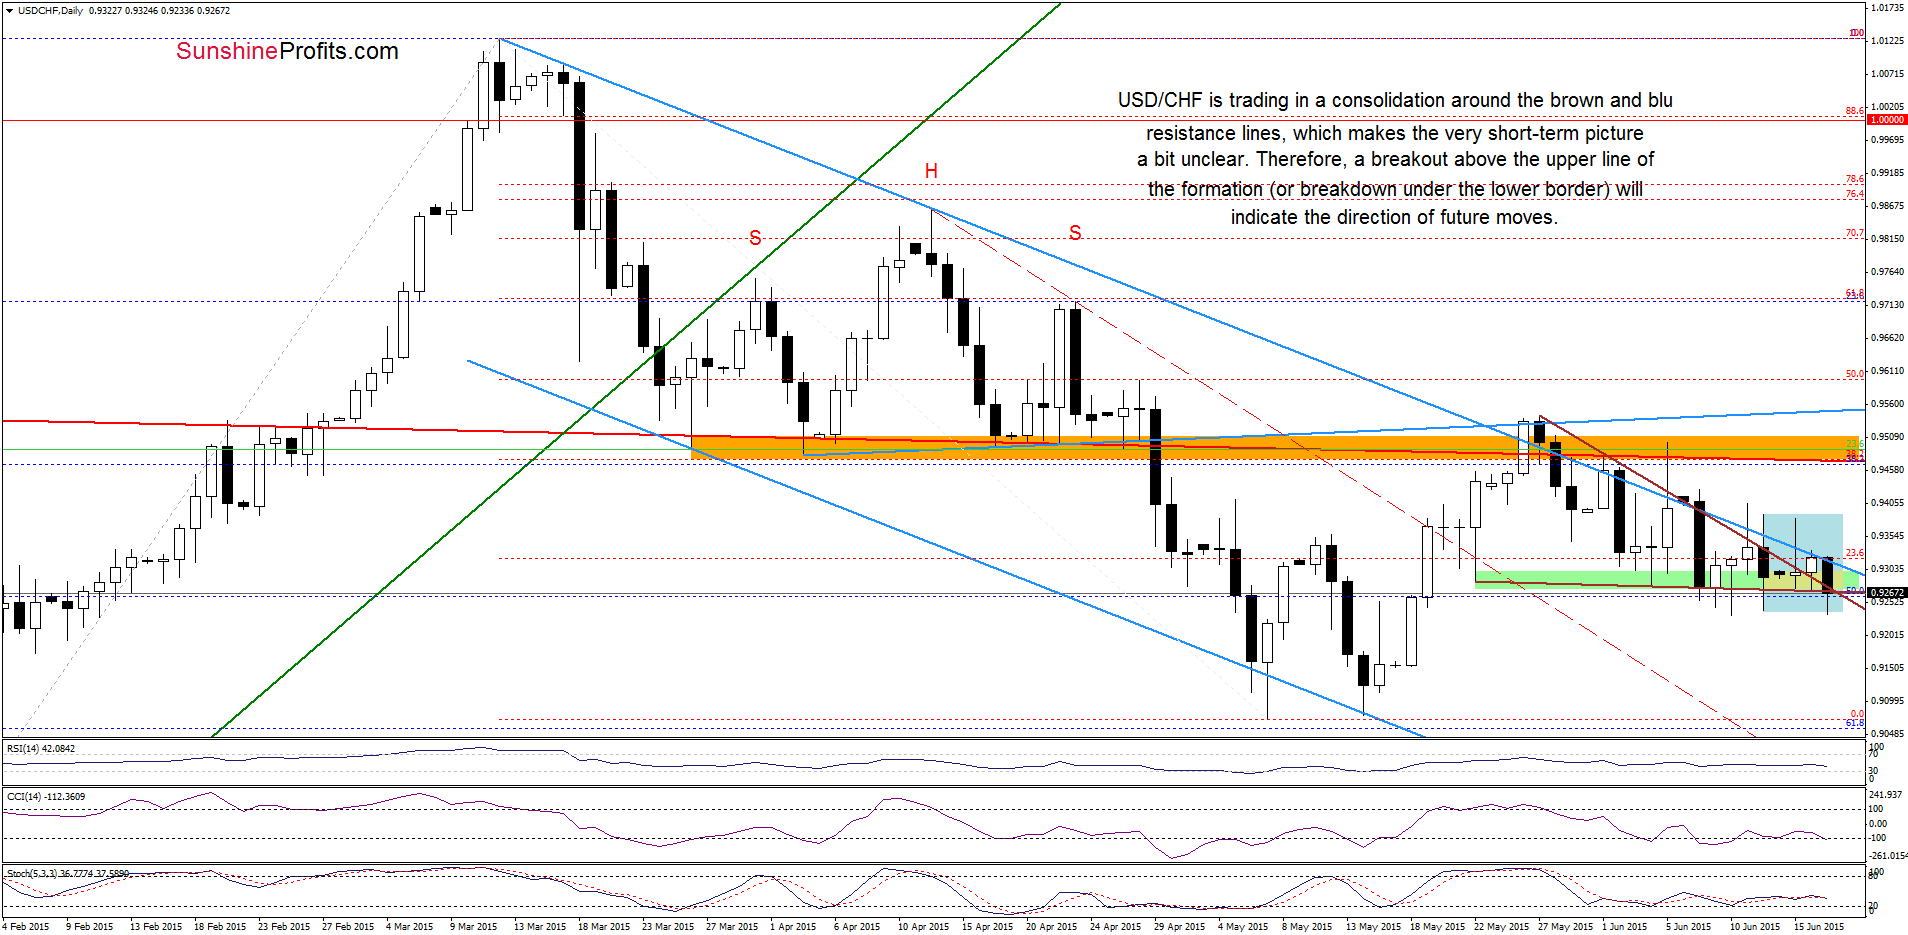
As you see on the daily chart, although currency bulls tried to push USD/CHF above the upper line of the declining trend channel several times in recent days, all their attempts failed (a negative signal). Earlier today, the blue resistance line triggered a decline, which took the exchange rate to the lower border of the consolidation (marked with blue). If this area withstands the selling pressure, we’ll see a rebound from here and another test of the blue resistance line. However, if the pair closes the day under the recent lows, it would be a bearish signal, which will likely trigger a decline to around 0.9070-0.9080, where the May lows are (additionally, in this area the size of the downswing will correspond to the height of the consolidation).
Where the exchange rate head next? Will the weekly chart give us more clues about future moves? Let’s check.
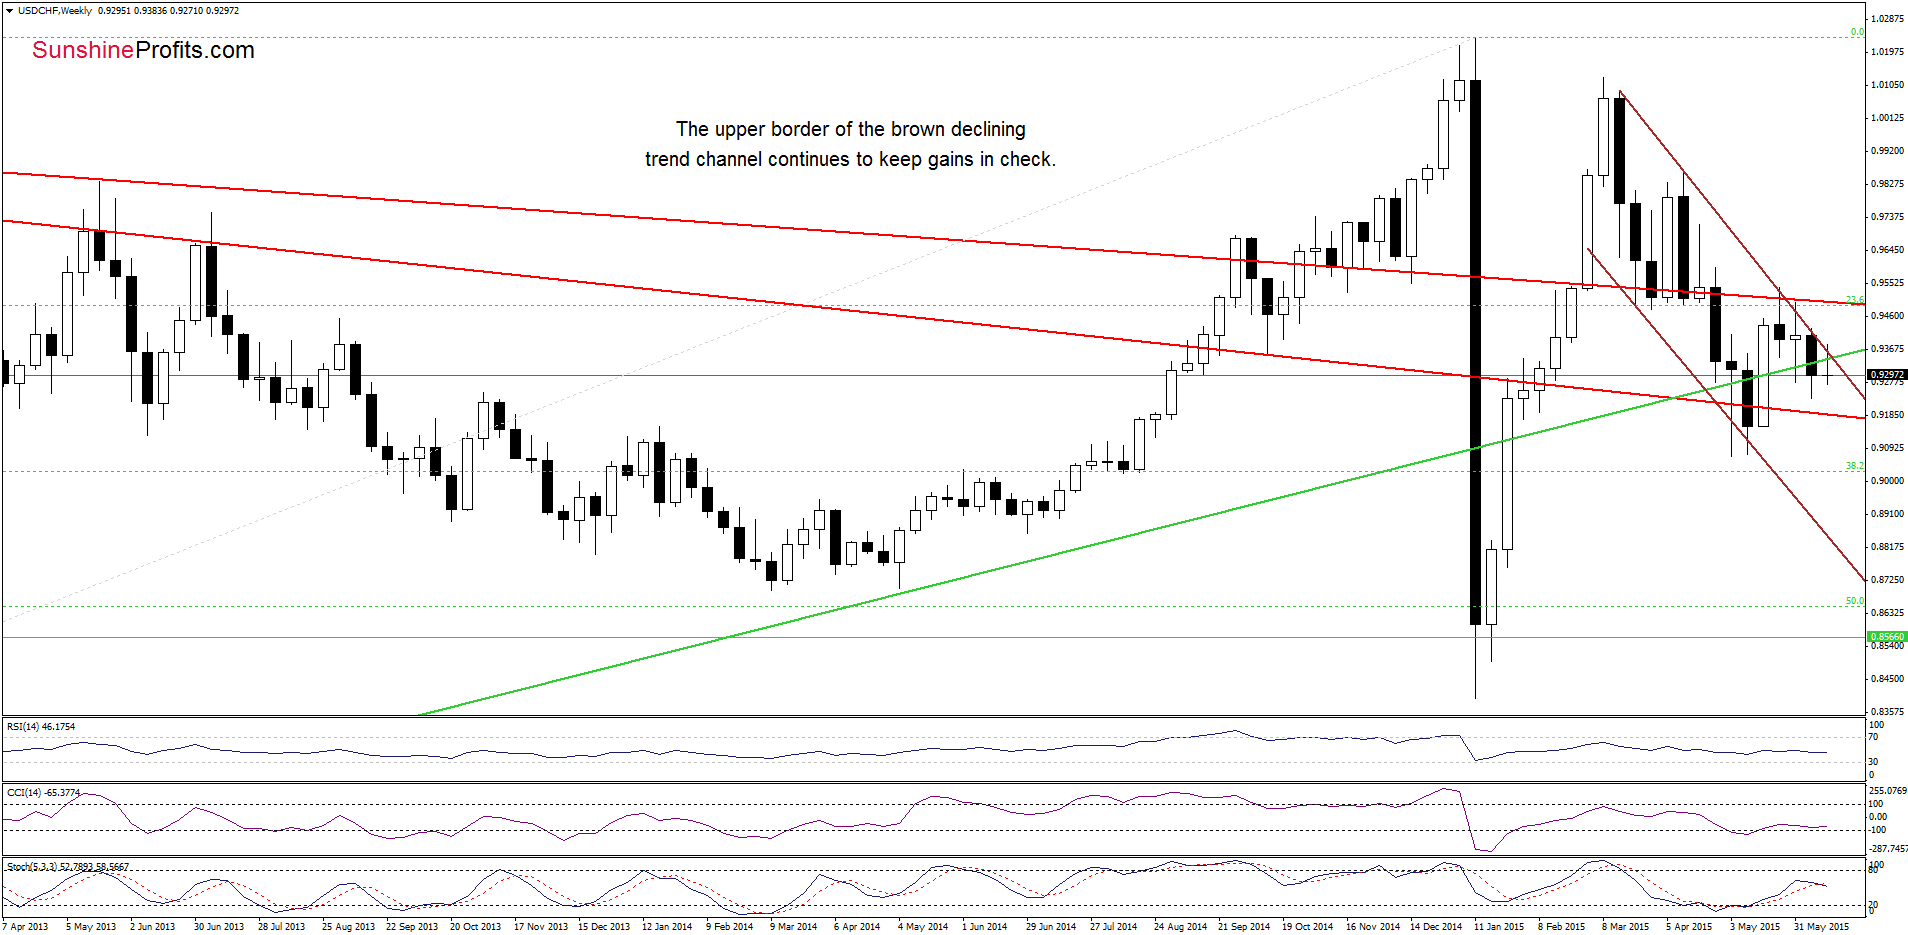
Looking at the weekly chart, we see that USD/CHF still remains under the upper border of the brown declining trend channel. Therefore, in our opinion, as long as there is no breakout above this important resistance line further rally is not likely to be seen and another attempt to move lower should not surprise us (especially when we factor in the fact that the exchange rate declined below the long-term green support line once again).
Very short-term outlook: mixed with bearish bias
Short-term outlook: mixed
MT outlook: mixed
LT outlook: bearish
Trading position (short-term; our opinion): No positions are justified from the risk/reward perspective at the moment. We will keep you informed should anything change, or should we see a confirmation/invalidation of the above.
AUD/USD
The situation in the medium term hasn’t changed much as AUD/USD is trading under the last week’s high, but still above the green support line (based on the previous lows).
Can we infer something more from the very short-term picture? Let’s check.
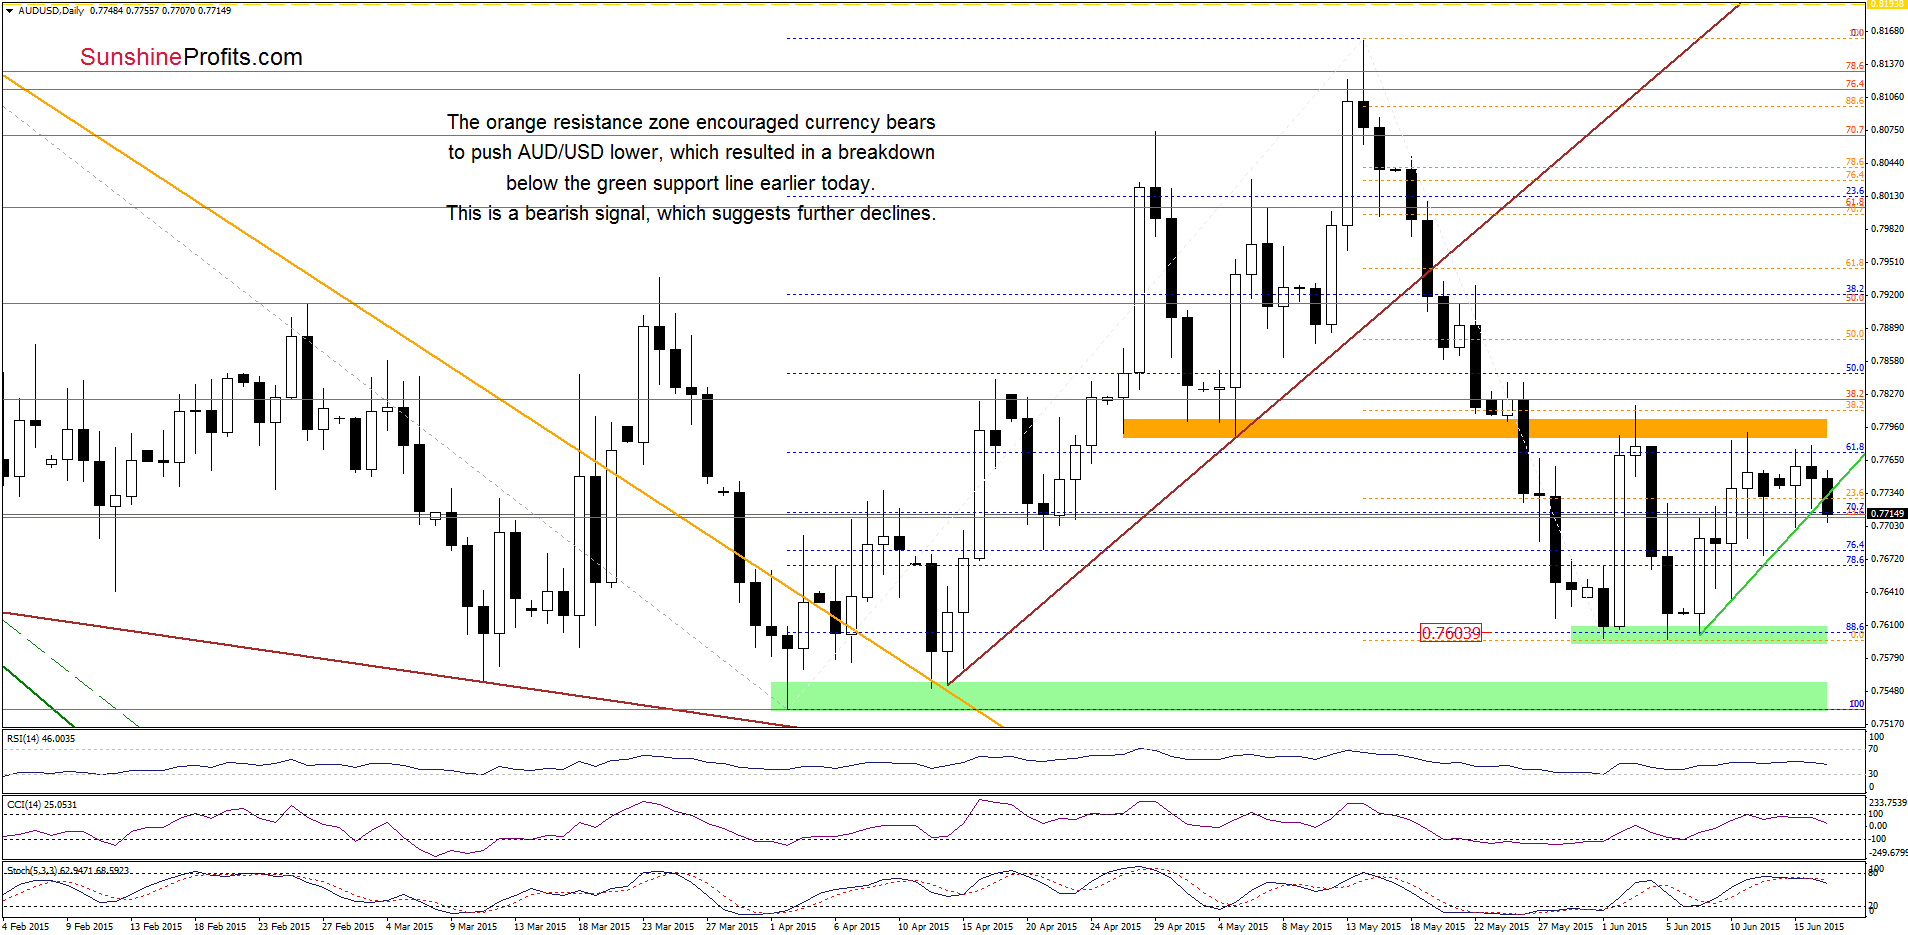
Quoting our last commentary on this currency pair:
(…) the exchange rate closed the day under the orange resistance zone, which pushed AUD/USD lower and resulted in re-test of the green line earlier today. If it withstands the selling pressure, we’ll see a rebound from here and another increase to the key resistance area. However, taking into account the current position of the indicators (the CCI and Stochastic Oscillator generated sell signals), we think that lower values of the exchange rate are ahead us. If this is the case, and the pair drops under the support line, it would be a bearish signal, which will trigger a decline to around 0.7676, where the Friday’s low is.
On the daily chart, we see that the situation developed in line with the above scenario and AUD/USD declined below the green support line earlier today. This is a bearish signal, which suggests a decline to our initial downside target later in the day. If this support is broken, we’ll likely see further deterioration and a drop to around 0.7634 (the June 10 low) or even a test of the green support zone based on the June lows.
Very short-term outlook: bearish
Short-term outlook: mixed with bearish bias
MT outlook: mixed
LT outlook: mixed
Trading position (short-term; our opinion): Short positions (which are profitable) with a stop-loss order at 0.8194 are justified from the risk/reward perspective at the moment. We will keep you informed should anything change, or should we see a confirmation/invalidation of the above.
Thank you.
Nadia Simmons
Forex & Oil Trading Strategist
Przemyslaw Radomski, CFA
Founder, Editor-in-chief
Gold & Silver Trading Alerts
Forex Trading Alerts
Oil Investment Updates
Oil Trading Alerts

