

Although the Office for National Statistics reported that British GDP expanded 2.4% on a year-over-year basis, the data also showed that gross domestic product confirmed growth of 0.3% % in the first quarter, missing expectations for a reading of 0.4%. Thanks to these disappointing numbers GBP/USD extended declines, slipping below the support levels. How low could the exchange rate go in the coming days?
In our opinion the following forex trading positions are justified - summary:
- EUR/USD: Short positions (stop-loss order at 1.1667)
- GBP/USD: Short positions (stop-loss order at 1.5913)
- USD/JPY: none
- USD/CAD: Long positions (stop-loss order at 1.1706)
- USD/CHF: none
- AUD/USD: Short positions (stop-loss order at 0.8194)
EUR/USD
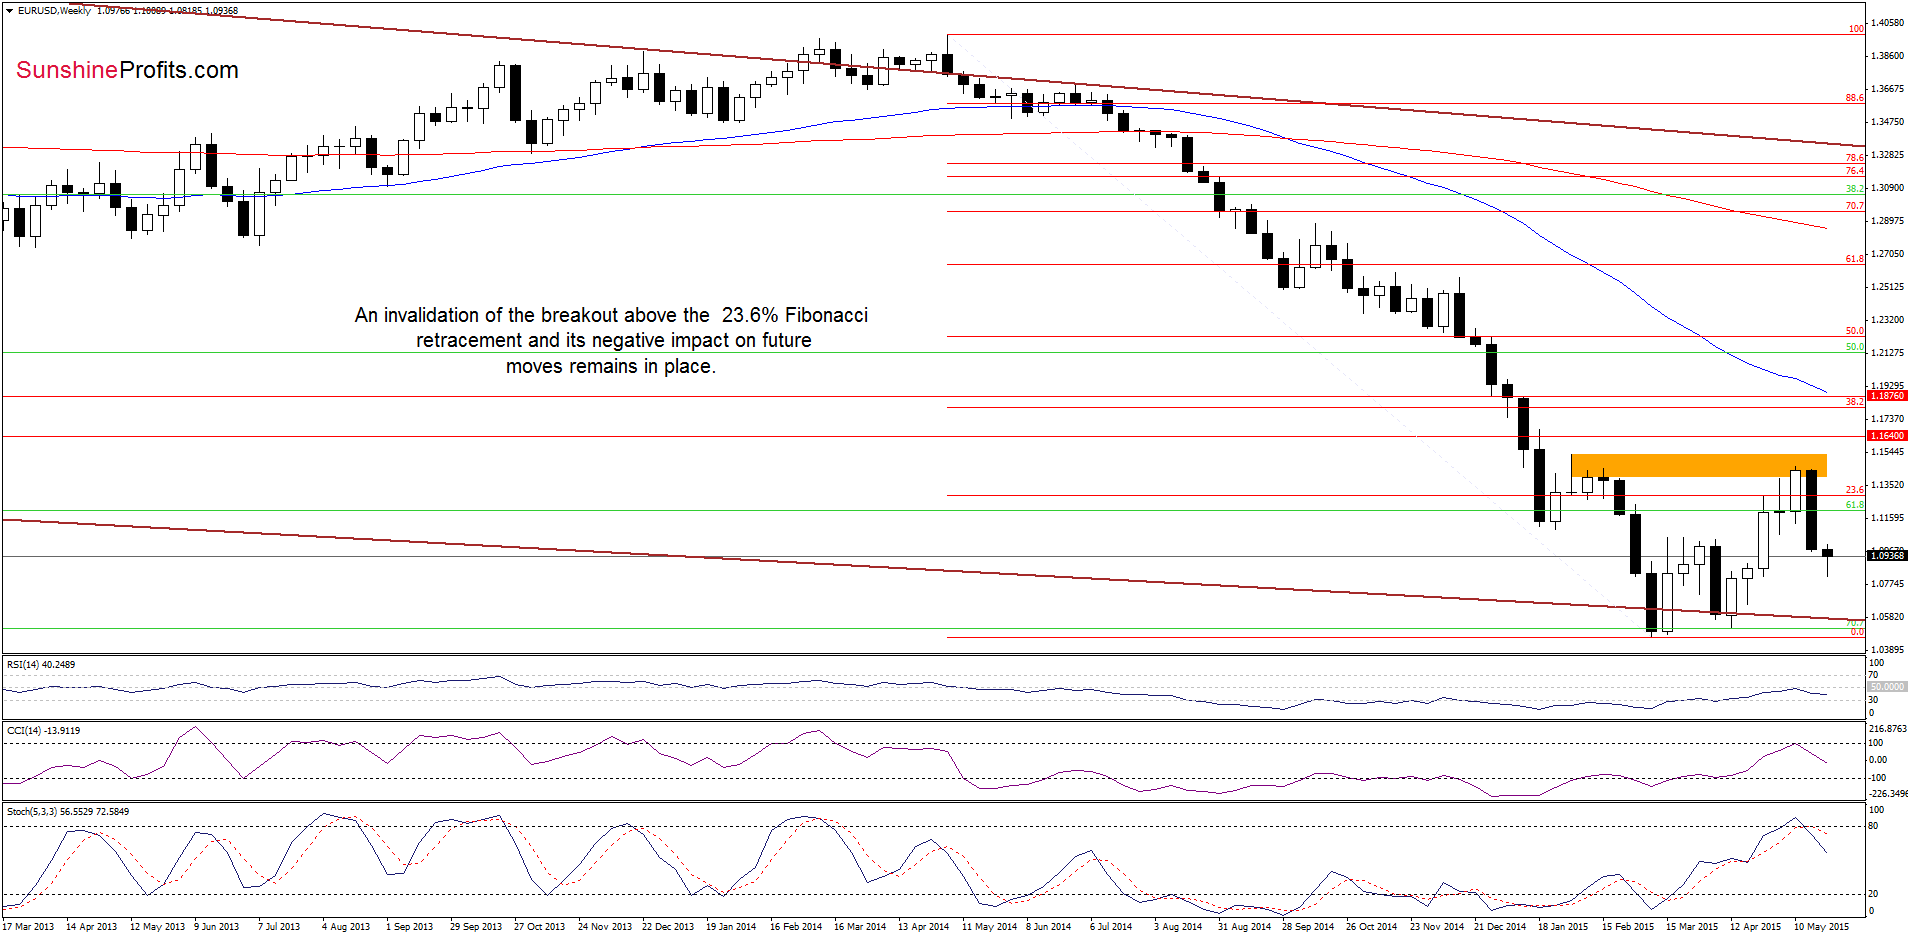
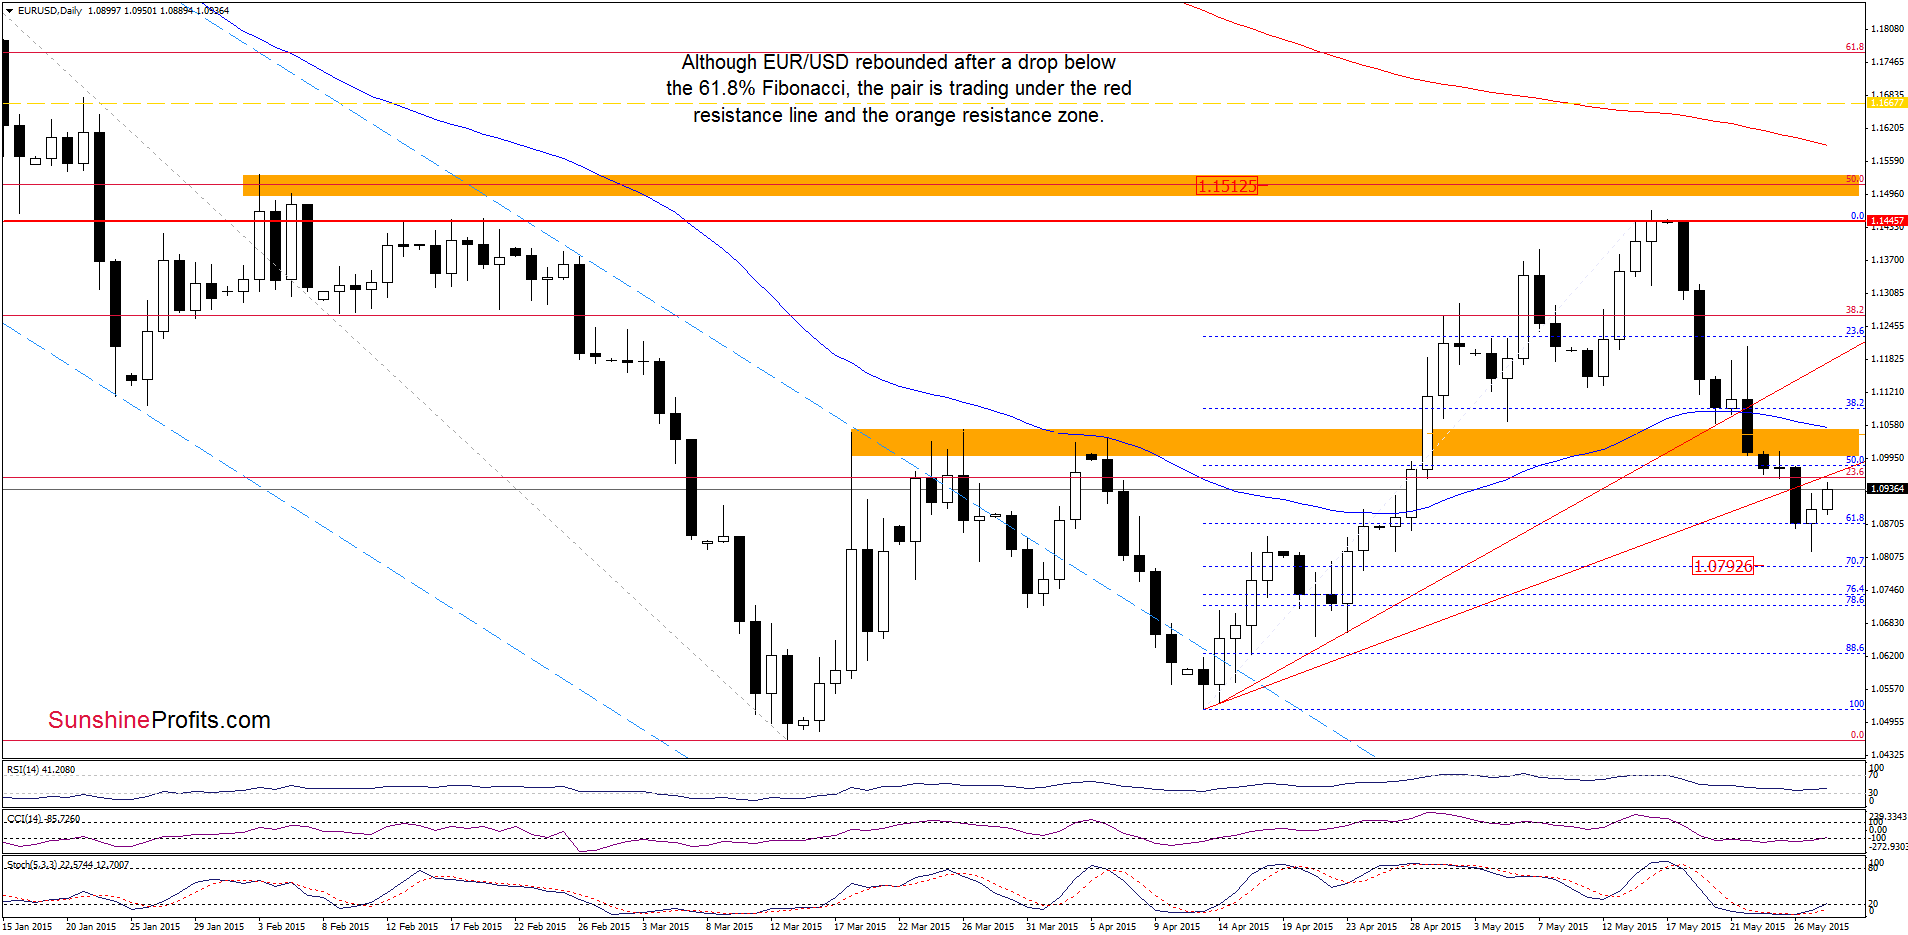
Looking at the daily chart, we see that the 61.8% Fibonacci retracement triggered an upward move, but EUR/USD remains under the previously-broken red resistance line and the orange zone. Taking this fact into account, we think that as long as there is no invalidation of the breakdown below them further improvement is not likely to be seen. In our opinion, if the pair declines from here, it would be a negative signal, which will likely encourage currency bears to push EUR/USD to the 70.7% Fibonacci retracement in the coming days.
Very short-term outlook: bearish
Short-term outlook: mixed with bearish bias
MT outlook: mixed
LT outlook: mixed
Trading position (short-term; our opinion): Short positions (which are profitable) with a stop-loss order at 1.1667 are justified from the risk/reward perspective at the moment. We will keep you informed should anything change, or should we see a confirmation/invalidation of the above.
GBP/USD
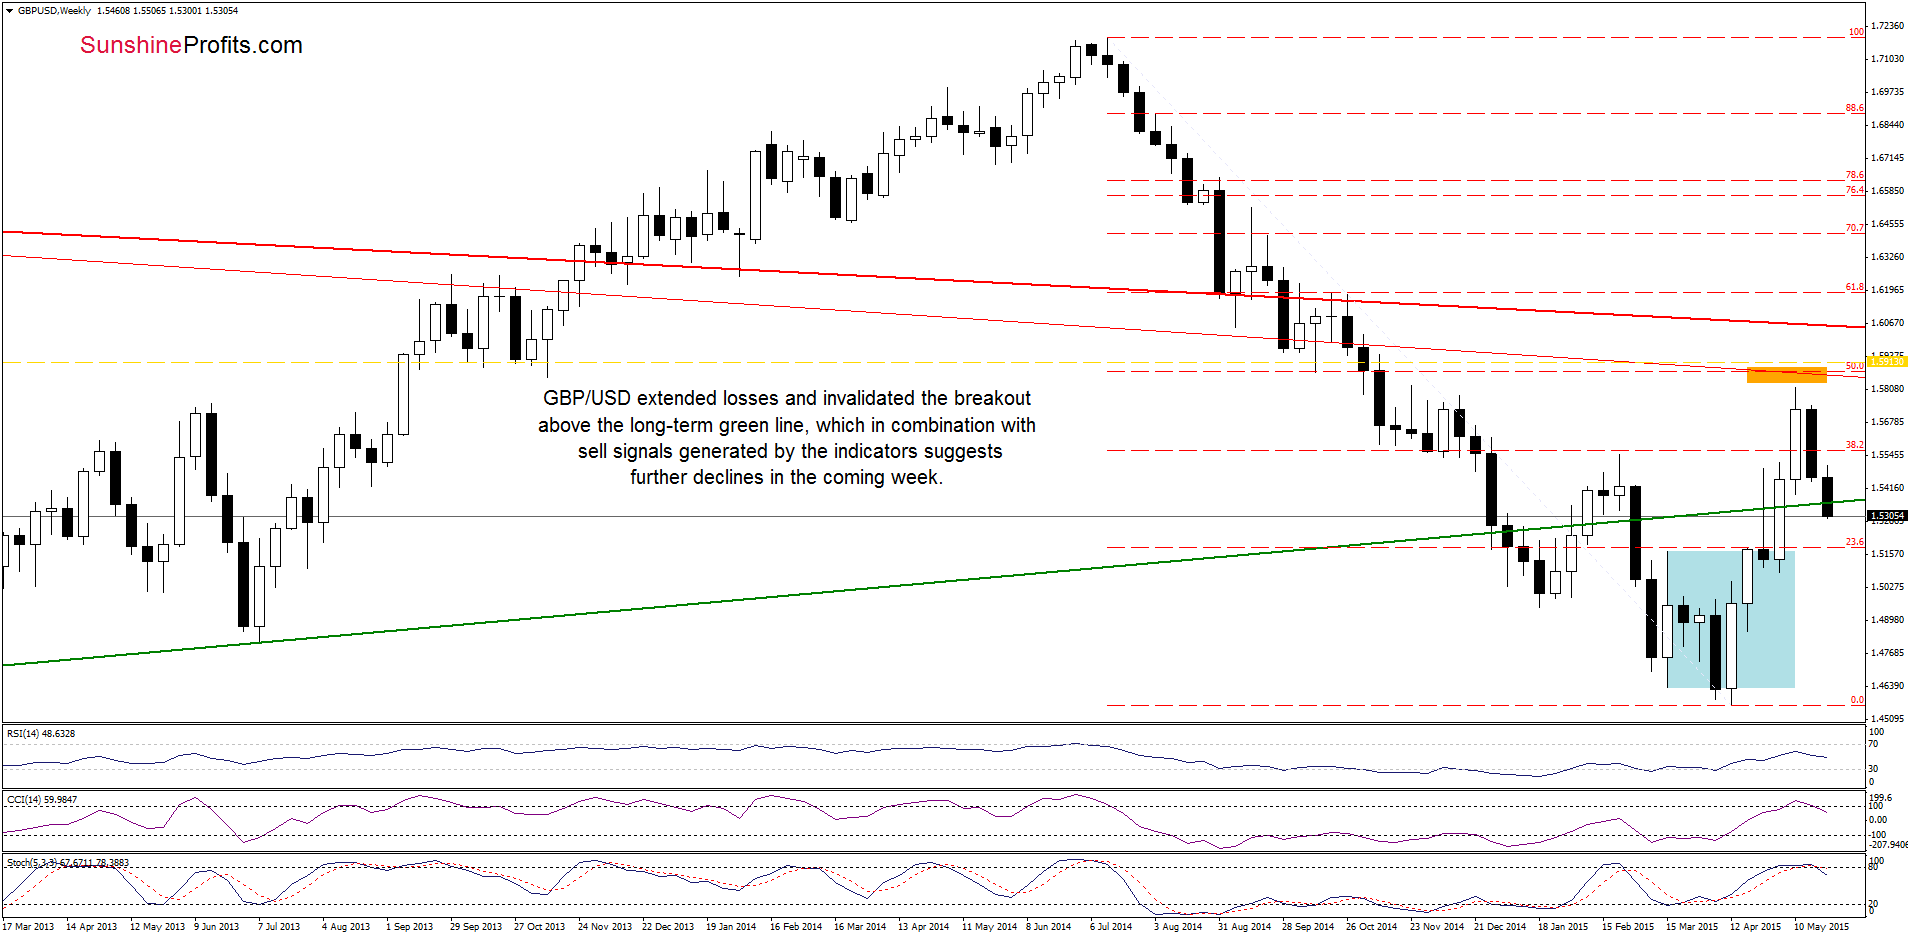
The situation in the medium term has deteriorated as GBP/USD extended declines and invalidated earlier breakout above the long-term green support line (which serves a resistance at the moment). This bearish event in combination with sell signals generated by the indicators suggests further deterioration in the coming week.
How low could the exchange rate go? Let’s examine the daily chart and find out.
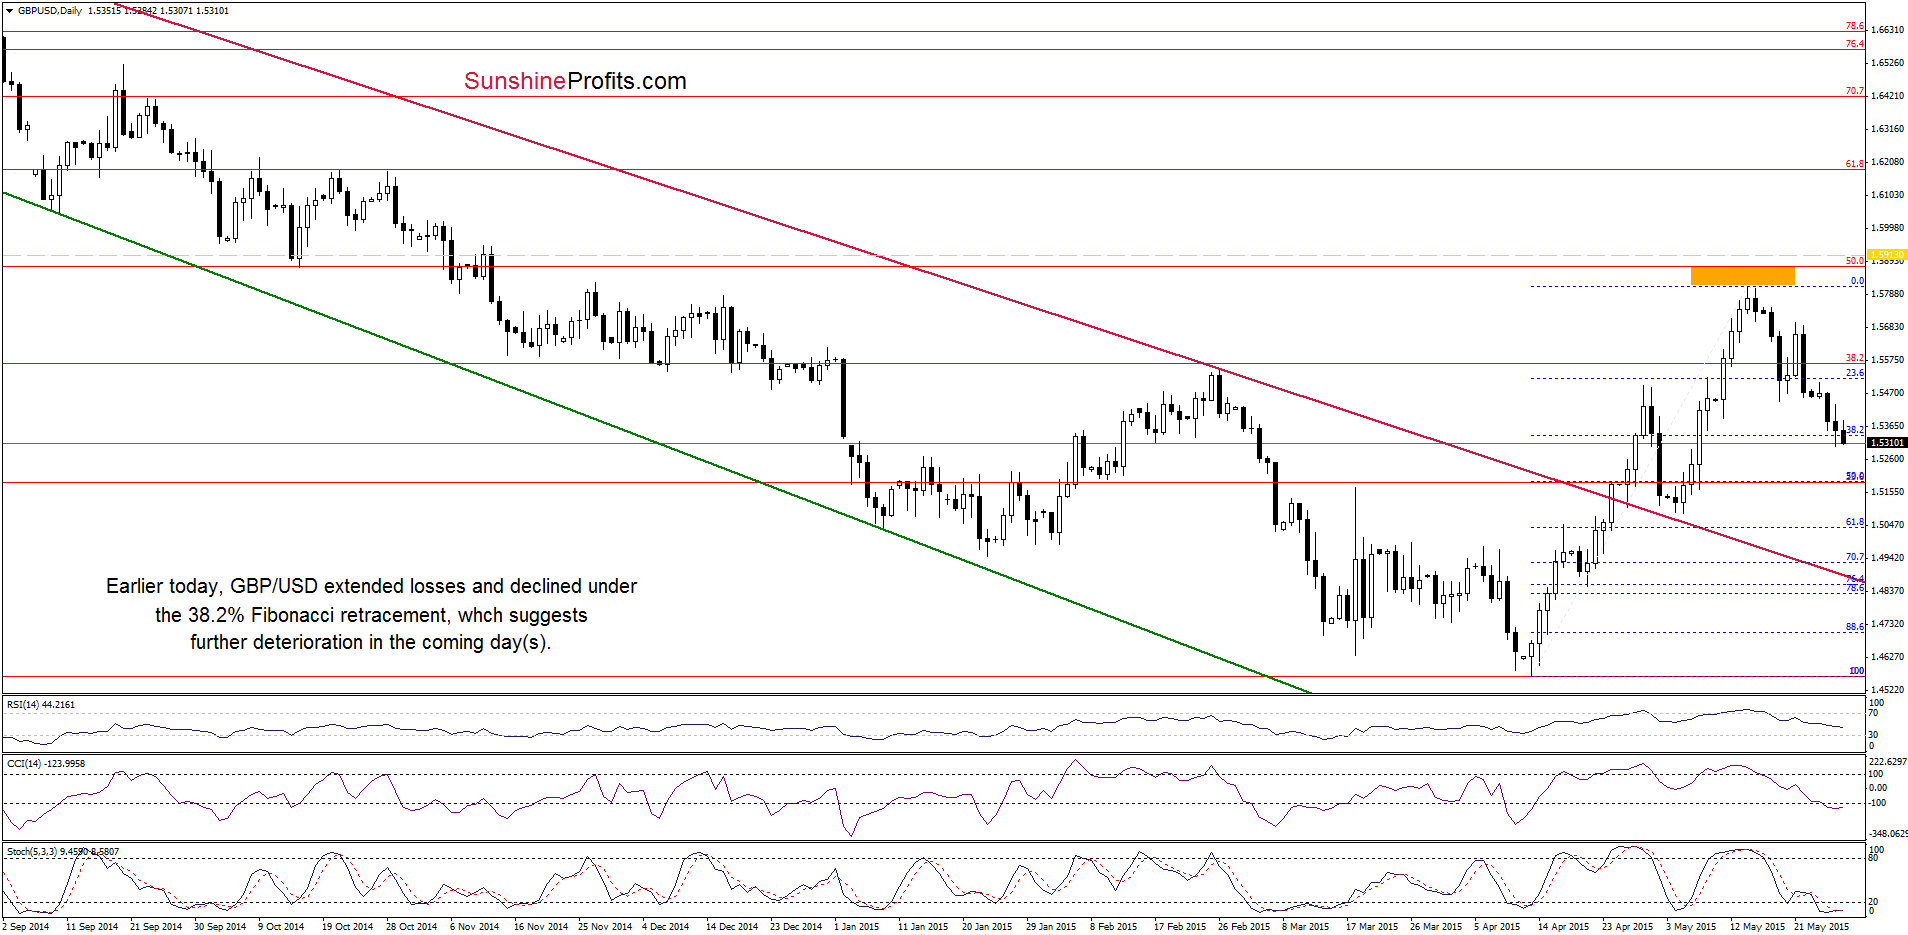
In our Forex Trading Alert posted on Tuesday, we wrote:
(…) GBP/USD extended losses (…), which suggests that currency bears will try to push the pair to the next target - the 38.2% Fibonacci retracement (around 1.5337)
As you see on the daily chart, the situation developed in line with the above scenario and GBP/USD reached our downside target yesterday. Earlier today, the pair extended losses and declined under the 38.2% Fibonacci retracement, which suggests further correction and a drop to the 50% retracement (around 1.5190) in the coming days.
Very short-term outlook: bearish
Short-term outlook: mixed with bearish bias
MT outlook: mixed
LT outlook: mixed
Trading position (short-term; our opinion): Short positions (which are profitable) with a stop-loss order at 1.5913 are justified from the risk/reward perspective at the moment. We will keep you informed should anything change, or should we see a confirmation/invalidation of the above.
USD/CAD
In our last commentary on this currency pair, we wrote:
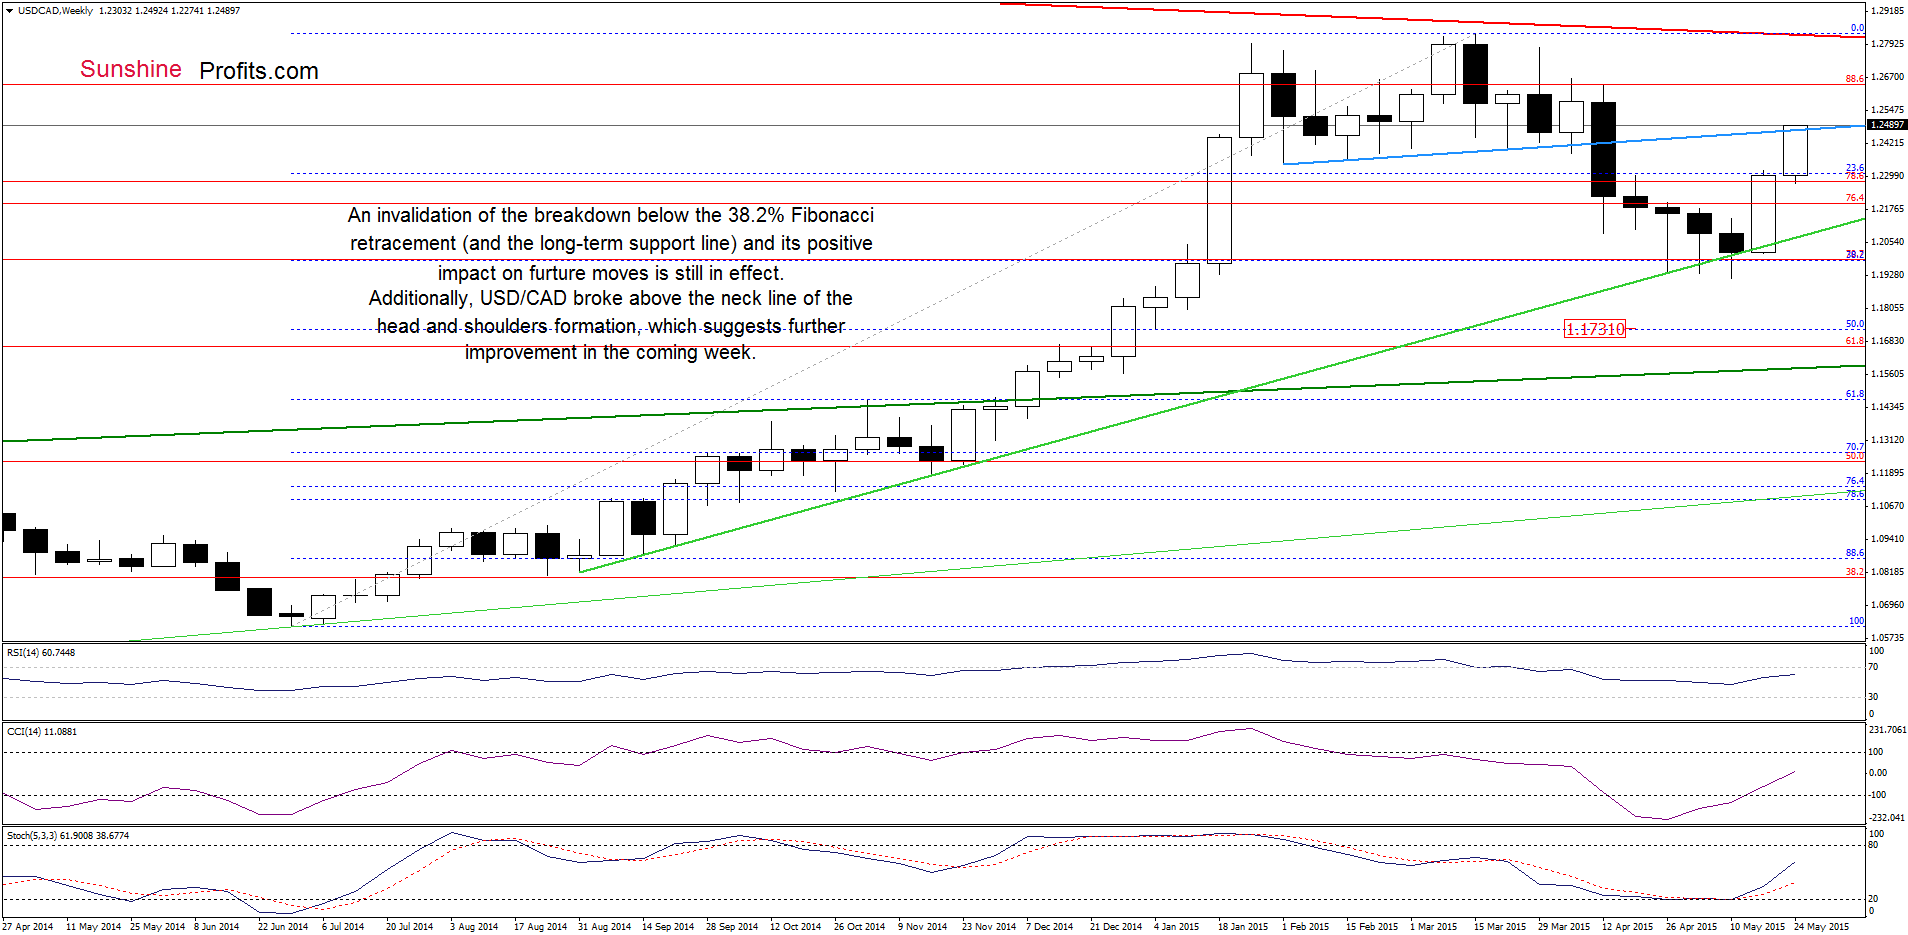
(…) USD/CAD moved higher, which means that an invalidation of the breakdown under the 38.2% Fibonacci retracement level (and the long-term green line) and its positive impact on price moves is still in effect. Additionally, buy signals reain in place, supporting further improvement. If this is the case, we might see an increase even to around 1.2464, where the previously-broken neck line (marked with blue) of the head and shoulders formation is.
From today’s point of view we see that currency bulls not only took USD/CAD to our upside target, but also managed to push the pair above the blue resistance line, which is a bullish signal that suggests further rally (especially if the exchange rate closes the week above this line).
How high could USD/CAD climb in the coming days? Let’s take a closer look at the daily chart and find out.

Quoting our Tuesday’s alert:
(…) Although (…) the orange resistance zone suggest that we could see a pullback from here in the coming day(s), we think that as long as there are no sell signals another upswing is likely (especially when we factor in the medium-term picture). If this is the case, and USD/CAD breaks above the orange zone, we might see an increase to around 1.2482, where the 61.8% Fibonacci retracement (based on the entire March-May declines) is.
Looking at the daily chart, we see that USD/CAD broke above the orange resistance zone, which triggered further rally and resulted in an increase to our upside target. Although the current position of the indicators suggests that a pullback is just around the corner, we think that the medium-term picture will encourage currency bulls to act and we’ll see a test the blue resistance line and the upper line of the brown declining trend channel in the coming day(s).
Very short-term outlook: bullish
Short-term outlook: mixed with bullish bias
MT outlook: mixed
LT outlook: mixed
Trading position (short-term; our opinion): Long positions (which are profitable) with a stop-loss order at 1.1706 are justified from the risk/reward perspective at the moment. We will keep you informed should anything change, or should we see a confirmation/invalidation of the above.
Thank you.
Nadia Simmons
Forex & Oil Trading Strategist
Przemyslaw Radomski, CFA
Founder, Editor-in-chief
Gold & Silver Trading Alerts
Forex Trading Alerts
Oil Investment Updates
Oil Trading Alerts

