

Earlier today, the Westpac Banking Corporation showed that Australian consumer sentiment fell 3.2% in April, after a 1.2% decline in March. As a result, AUD/USD moved lower once again, approaching this week’s lows. Will we see further deterioration in the near future?
In our opinion the following forex trading positions are justified - summary:
- EUR/USD: none
- GBP/USD: none
- USD/JPY: none
- USD/CAD: short (stop loss order at 1.2876)
- USD/CHF: none
- AUD/USD: none
EUR/USD
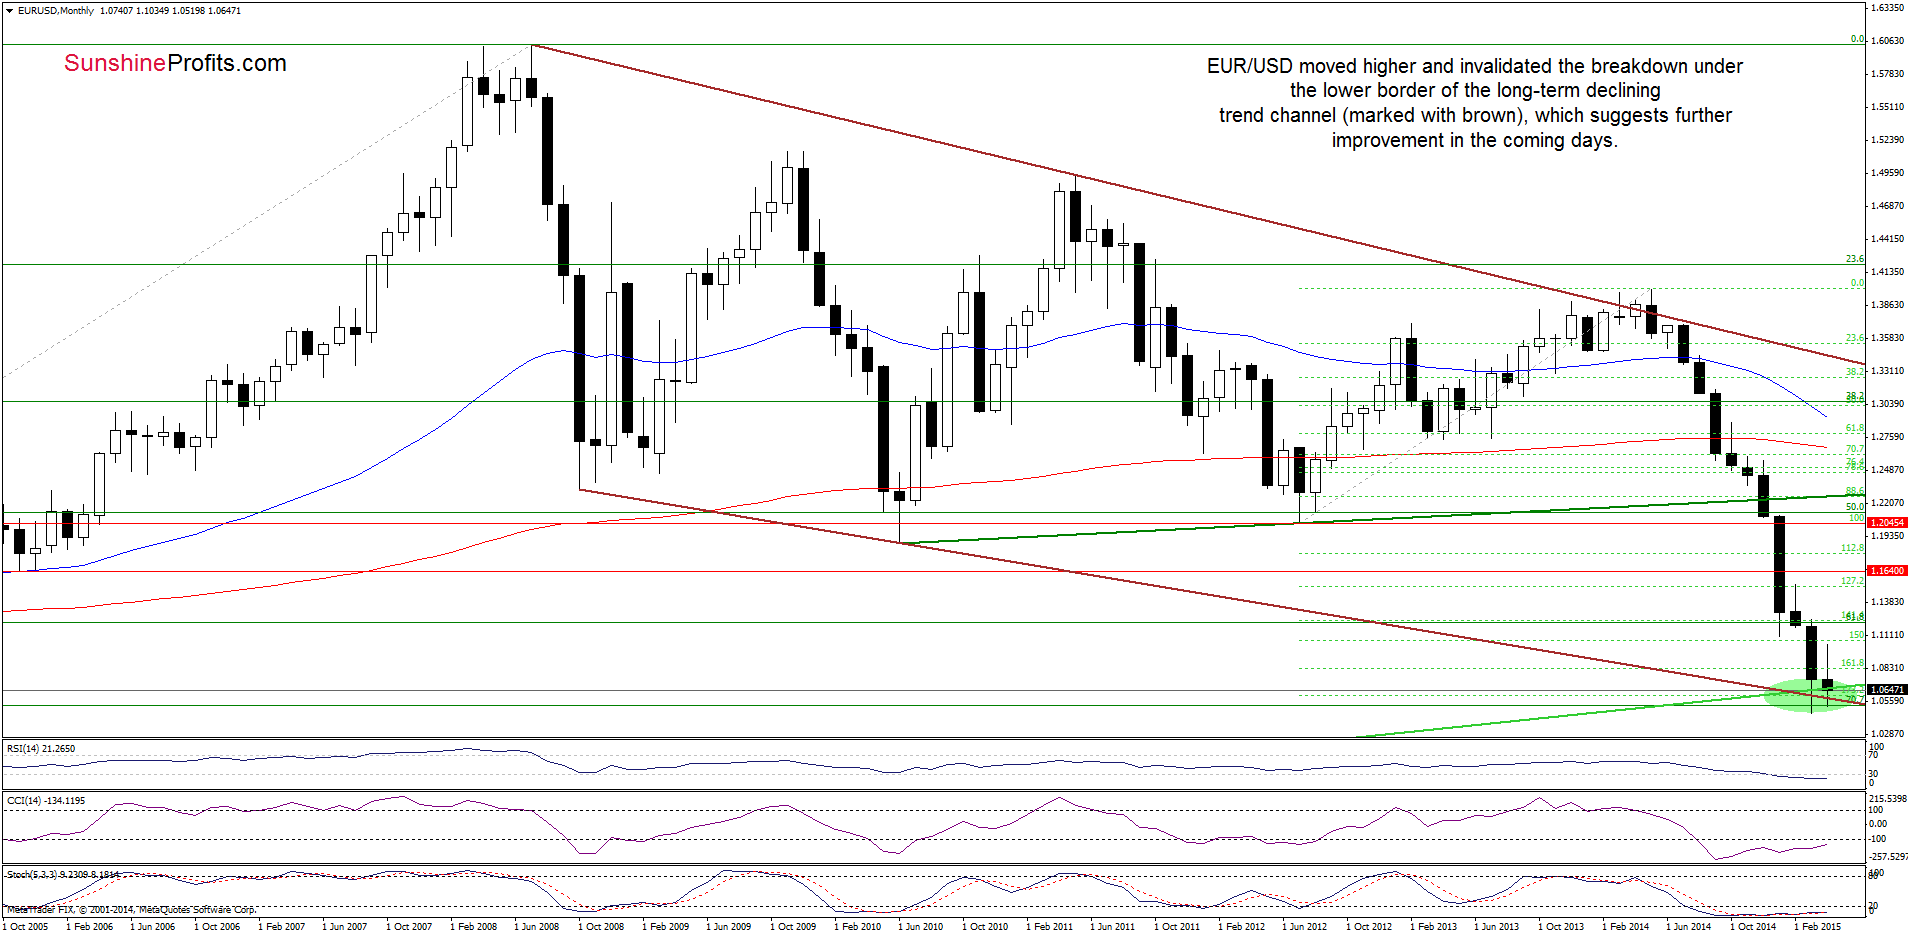
Looking at the above chart, we see that EUR/USD moved higher and invalidated the breakdown under the lower border of the declining trend channel, which is a positive signal that suggests further improvement in the coming days.
Are there any short-term factors that could support the realization of the above scenario? Let’s examine the daily chart and find out.
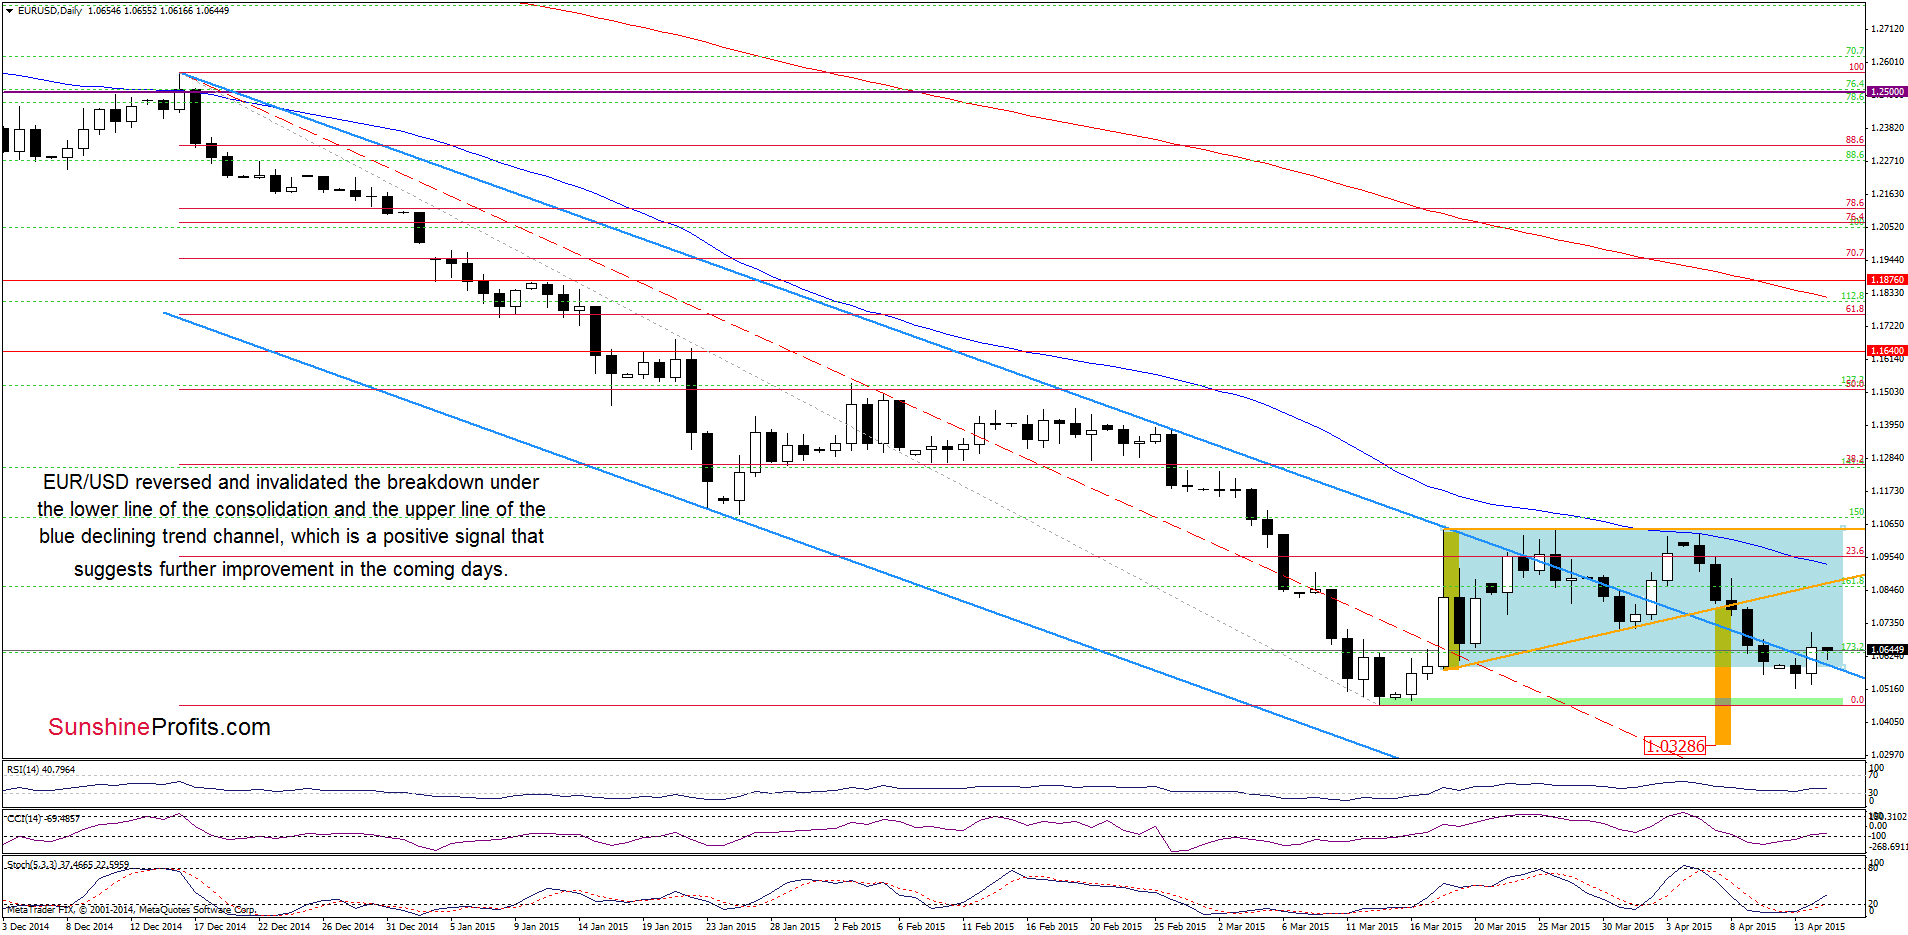
Yesterday, we wrote the following:
(…) the CCI and Stochastic Oscillator are oversold and very close to generate buy signals, which could translate to rebound in the coming day(s).
As you see on the daily chart, the situation developed in line with the above scenario and EUR/USD moved higher yesterday. With this upswing, the pair invalidated the breakdown under the upper border of the blue declining trend channel and the lower line of the consolidation, which is a positive sign. Additionally, buy signals generated by the indicators remain in place, supporting further improvement. If this is the case, and the exchange rate moves higher from here, the initial upside target would be the previously-broken orange resistance line (currently around 1.0854).
Very short-term outlook: mixed
Short-term outlook: mixed
MT outlook: mixed
LT outlook: mixed
Trading position (short-term; our opinion): No positions are justified from the risk/reward perspective at the moment. We will keep you informed should anything change, or should we see a confirmation/invalidation of the above.
USD/CAD
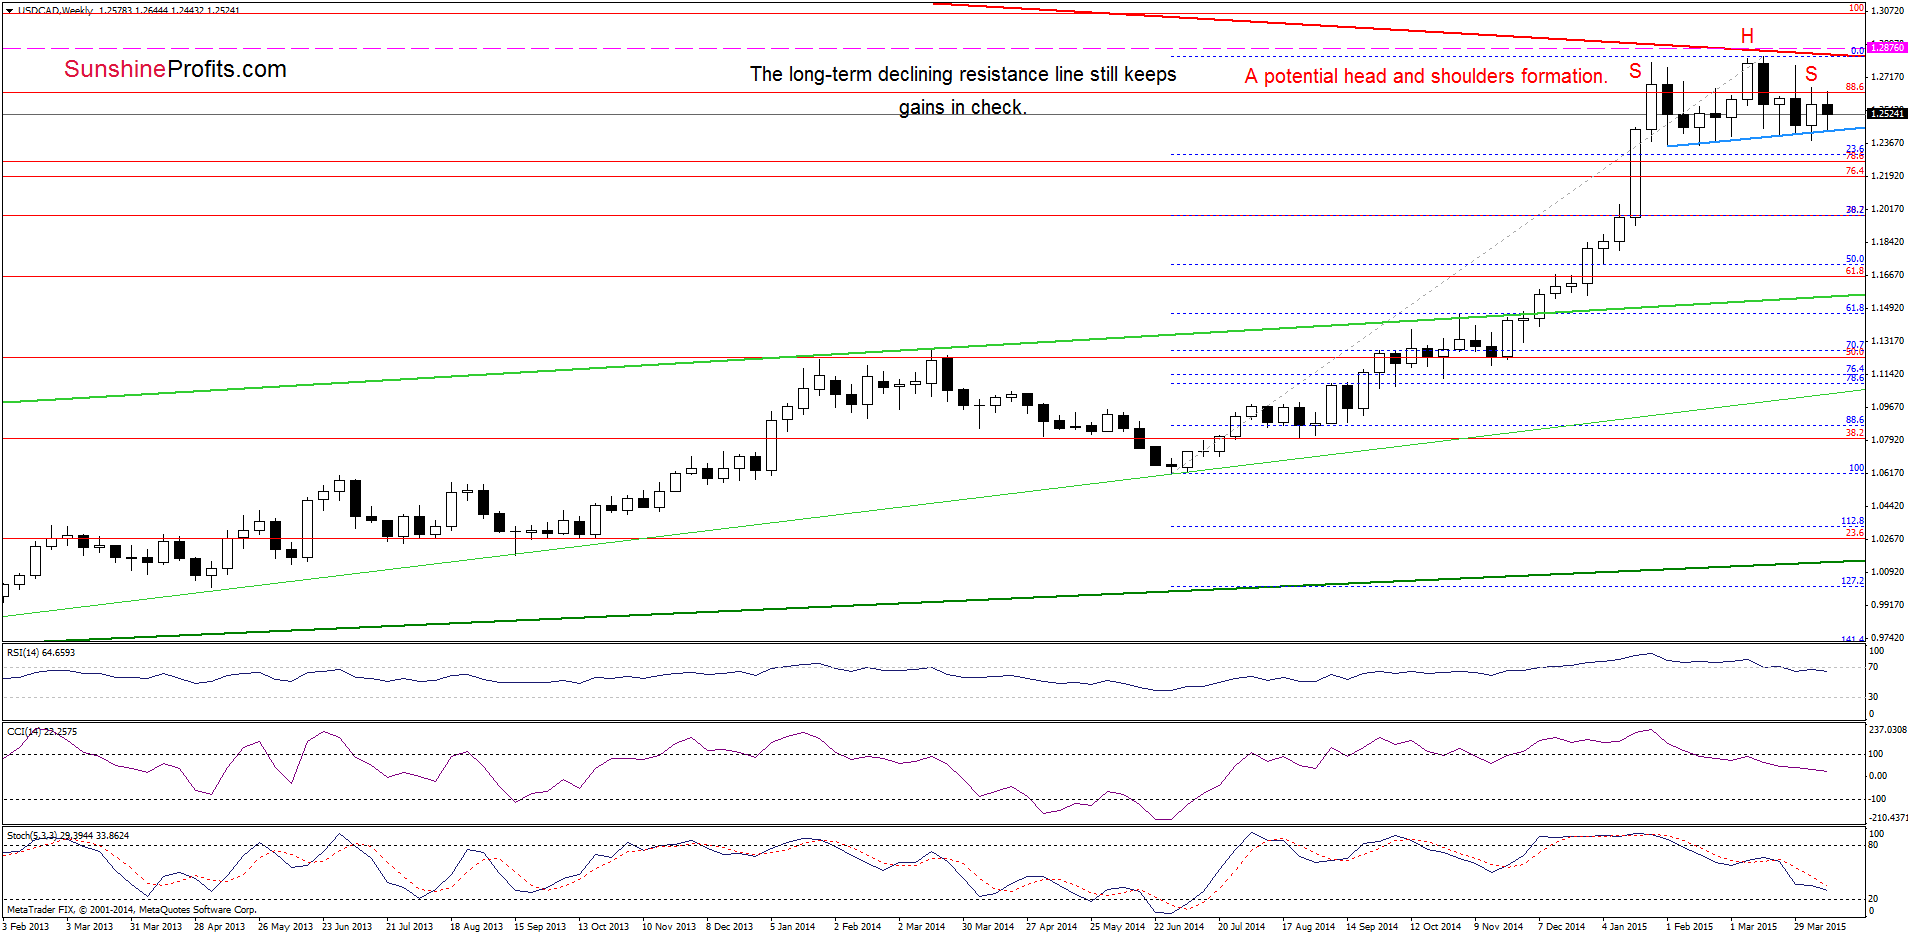
The situation in the medium term hasn’t changed much as USD/CAD is still trading in a narrow range between the recent lows and the long-term red declining resistance line, which keeps gains in check. Nevertheless, when we take a closer look at the chart, we can see a potential head and shoulders formation. Therefore, if USD/CAD declines below the neck line (the blue support line around 1.2428), it would be a bearish signal, which will likely trigger further deterioration.
Will we see such price action in the coming days? Let’s take a look at the daily chart and look for more clues about future moves.
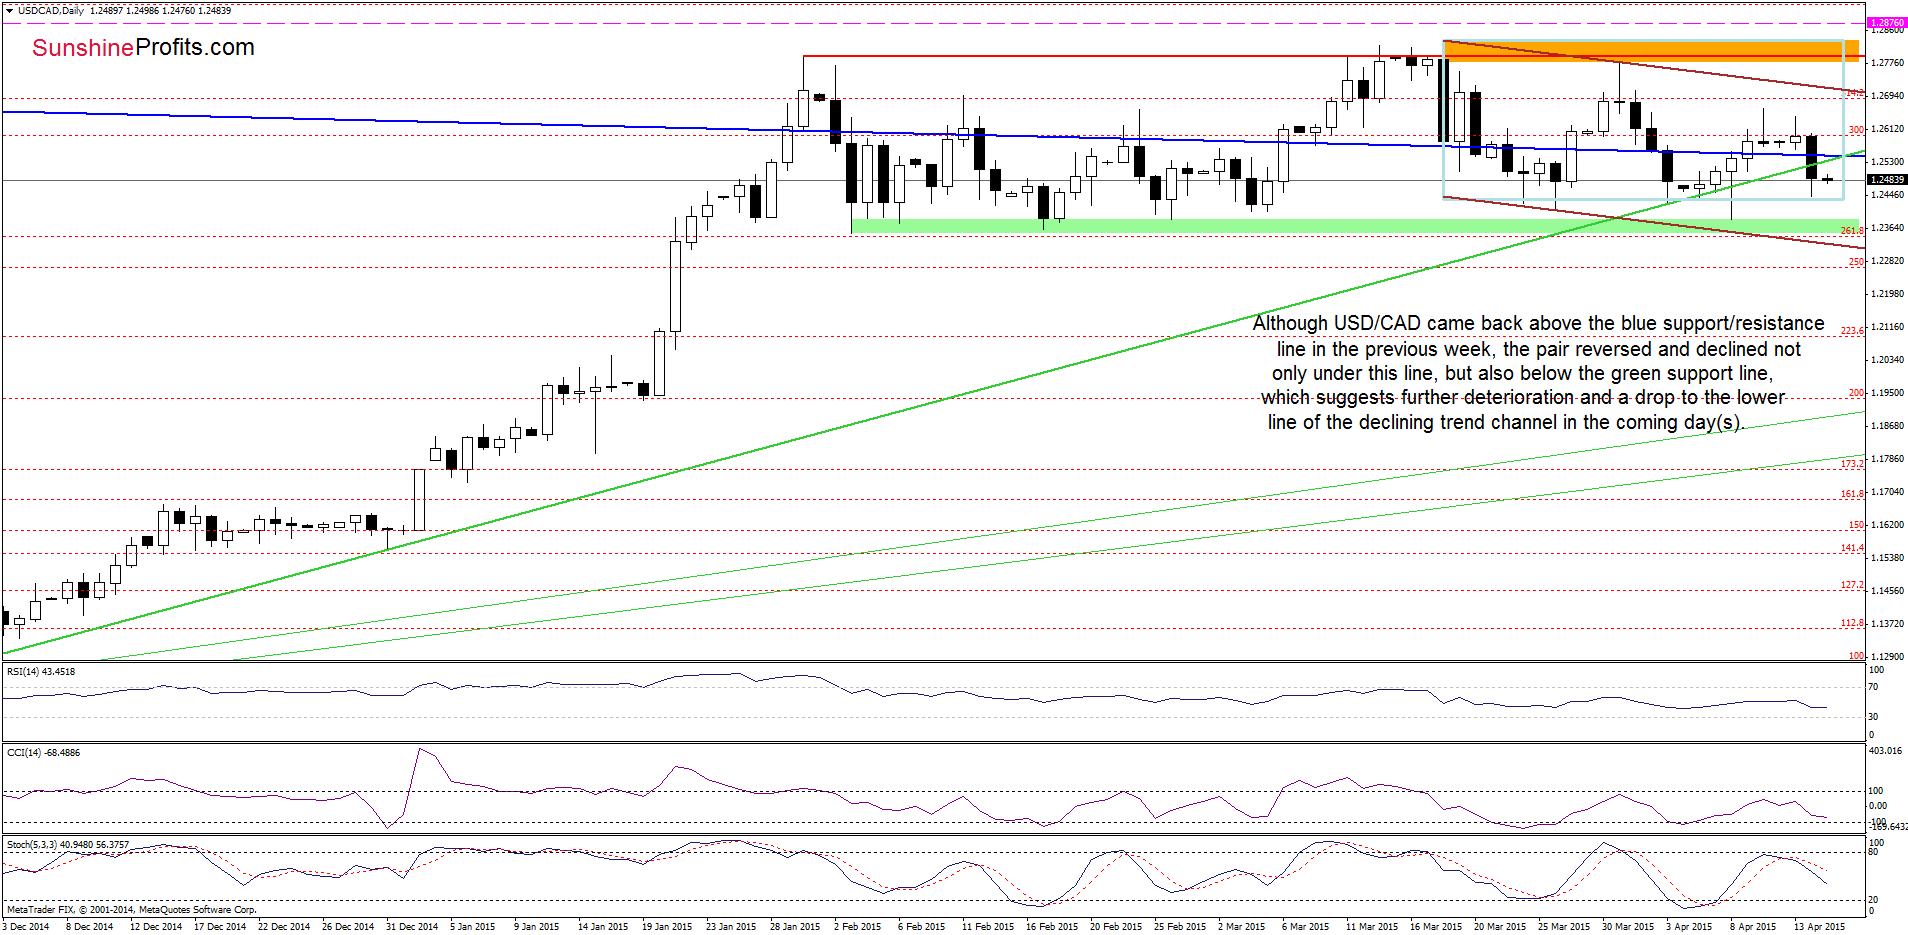
From this perspective, we see that although USD/CAD came back above the blue support/resistance line in the previous week, currency bulls were not strong enough to push the pair to the upper line of the declining trend channel. As a result, the exchange reversed and declined not only below the blue line, but also under the green support line, which suggests further deterioration and another test of the green support zone or even a drop to the lower border of the declining trend channel (currently around 1.2326) in the coming day(s). Please note that this scenario is also reinforced by the sell signal generated by the Stochastic Oscillator at the moment.
Very short-term outlook: bearish
Short-term outlook: mixed with bearish bias
MT outlook: mixed
LT outlook: mixed
Trading position (short-term; our opinion): Short positions with a stop loss order at 1.2876 are justified from the risk/reward perspective. We will keep you informed should anything change, or should we see a confirmation/invalidation of the above.
AUD/USD
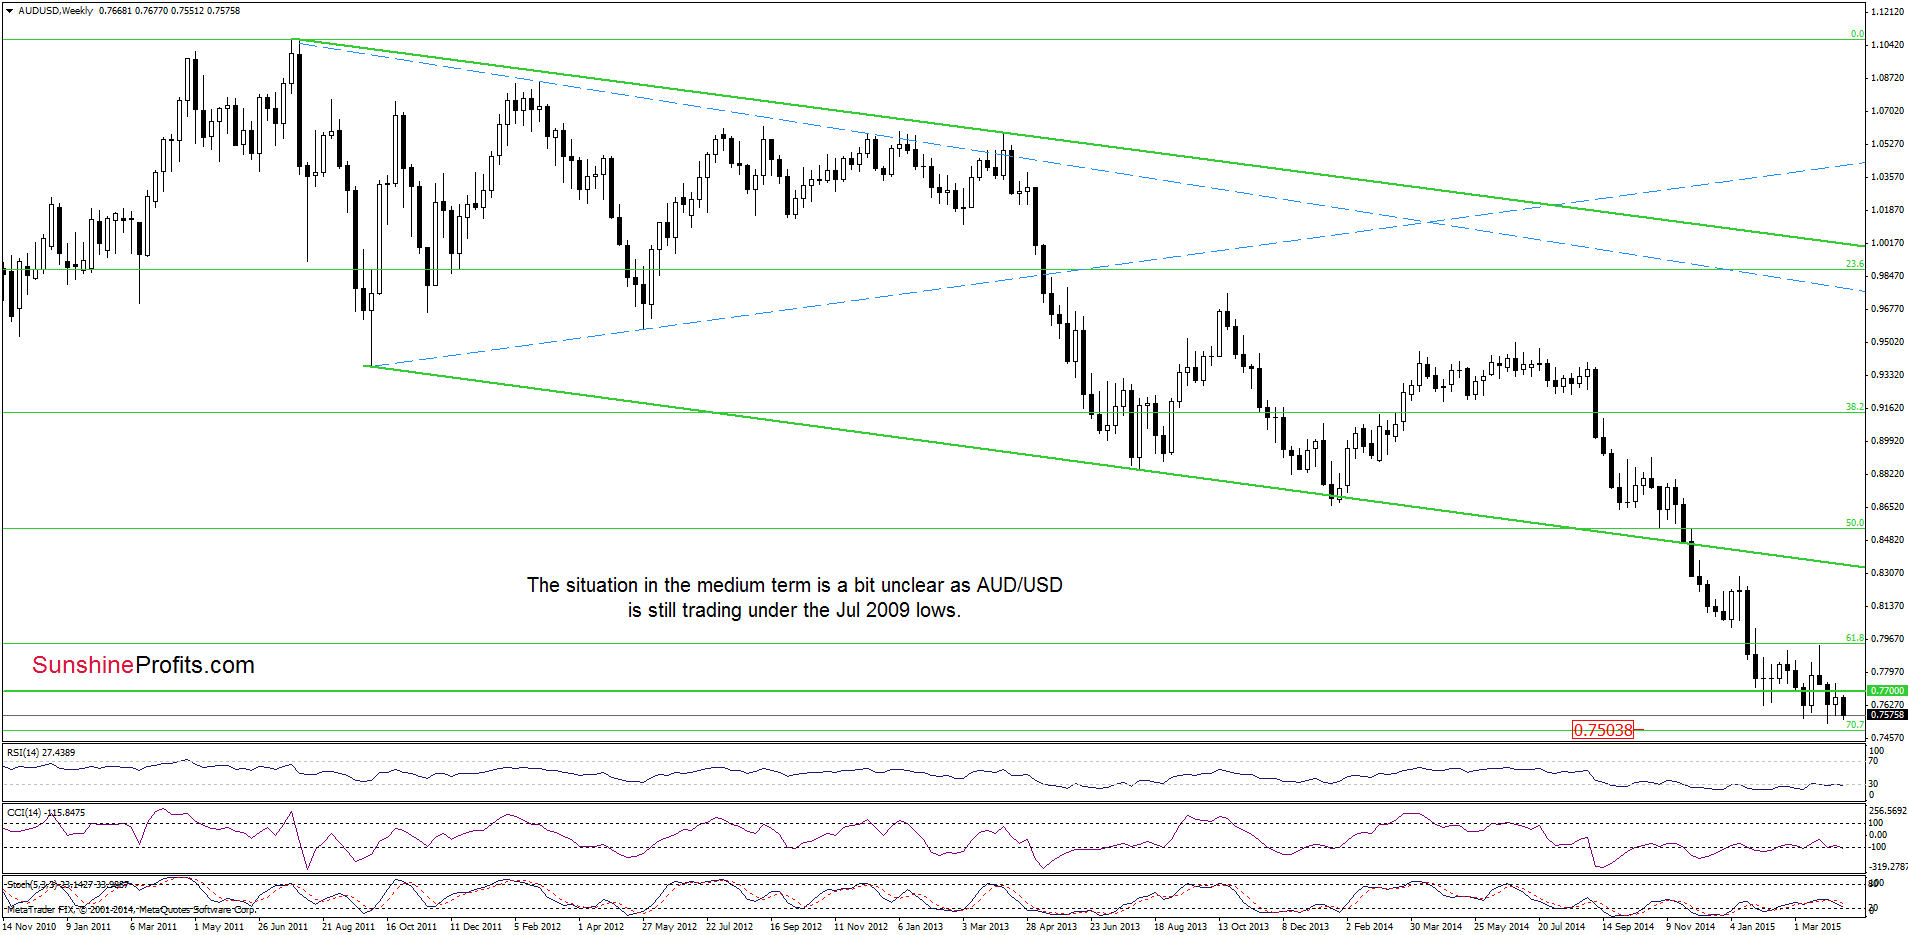
The medium-term outlook hasn’t changed much as AUD/USD still remains under the Jul 2009 lows. Today, we’ll focus on the very short-term changes and examine the daily chart.
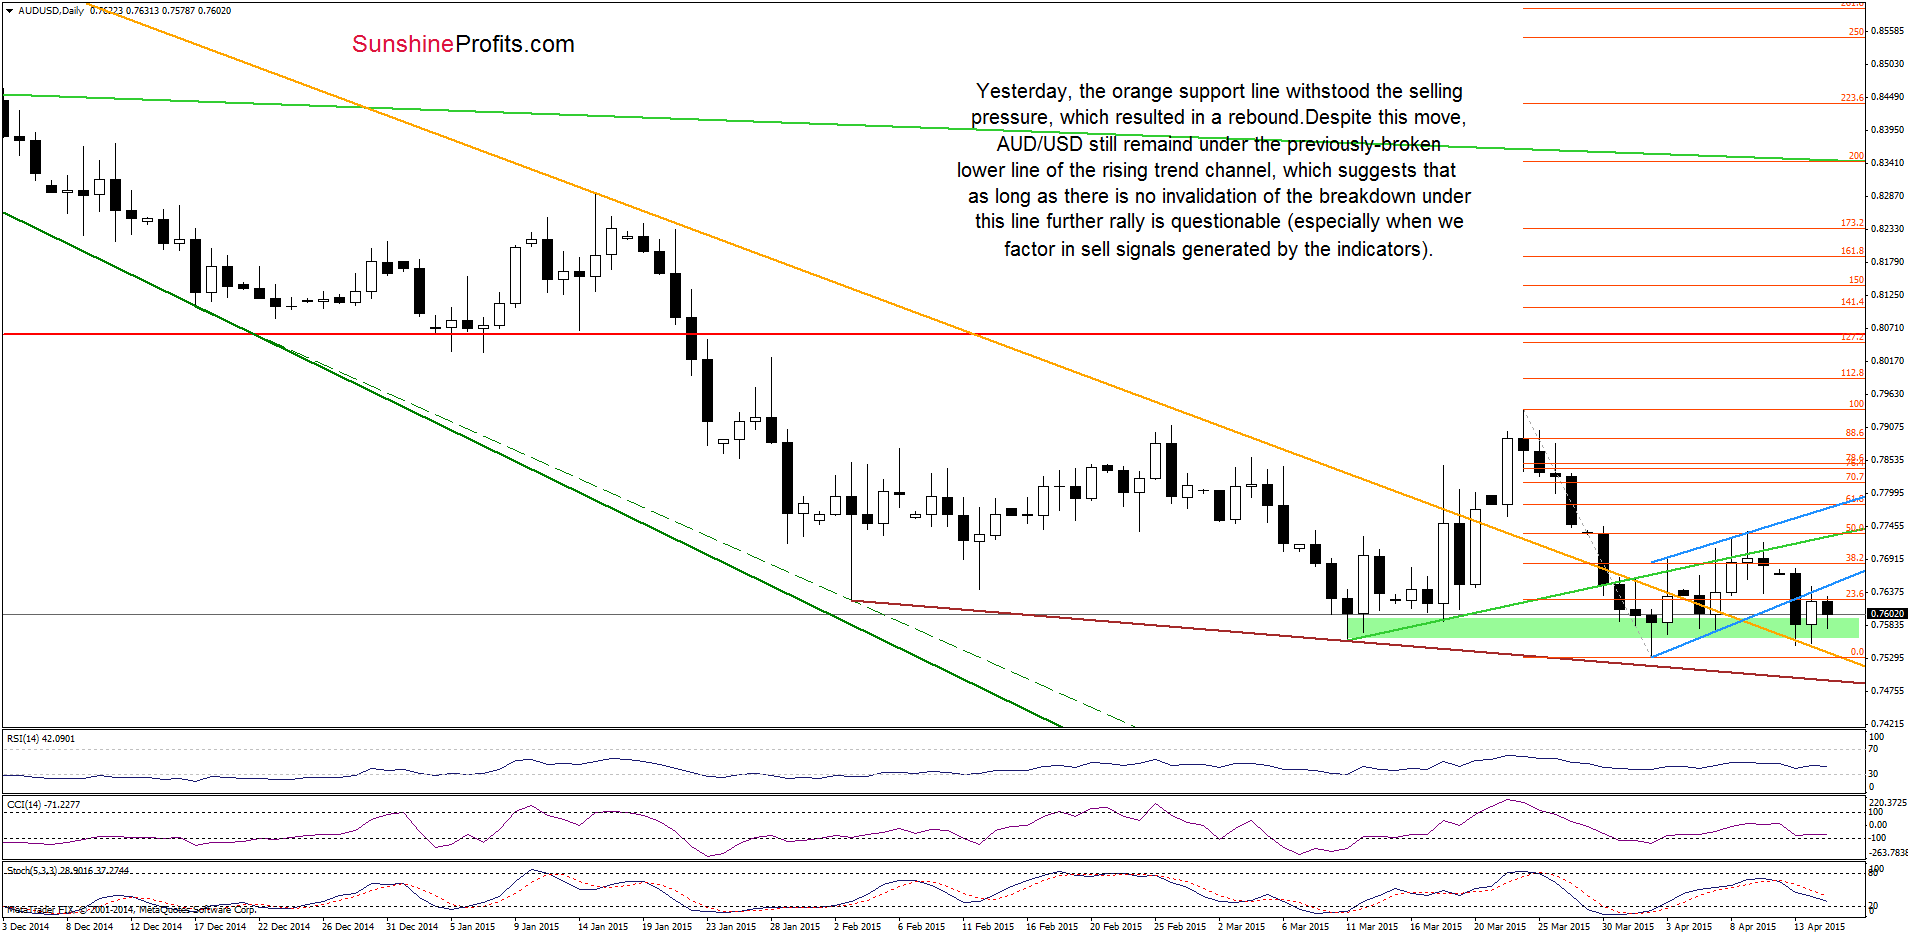
As you see on the above chart, the orange support line withstood the selling pressure, which resulted in a rebound yesterday. Despite this move, AUD/USD is still trading under the previously-broken lower line of the declining trend channel, which suggests that as long as there is no invalidation of the breakdown under this line further improvement is questionable (especially when we factor in sell signals generated by the indicators) and another test of the orange support line is likely. Please keep in mind if AUD/USD drops under this support, we’ll see a test of the recent low or even a drop to the 70.7% Fibonacci retracement around 0.7504 (marked on the weekly chart).
Very short-term outlook: mixed with bearish bias
Short-term outlook: mixed
MT outlook: mixed
LT outlook: mixed
Trading position (short-term; our opinion): No positions are justified from the risk/reward perspective at the moment. We will keep you informed should anything change, or should we see a confirmation/invalidation of the above.
Thank you.
Nadia Simmons
Forex & Oil Trading Strategist
Przemyslaw Radomski, CFA
Founder, Editor-in-chief
Gold & Silver Trading Alerts
Forex Trading Alerts
Oil Investment Updates
Oil Trading Alerts

