

Earlier today, the U.S. Commerce Department showed that personal spending increased by 0.1% in the previous month, while personal income rose 0.4% in February, beating expectations for a 0.3% gain. Thanks to these positive numbers, the USD Index climbed above 98, approaching the last week’s high. How did this increase affect the short-term pictures of our six currency pairs?
In our opinion the following forex trading positions are justified - summary:
- EUR/USD: none
- GBP/USD: none
- USD/JPY: none
- USD/CAD: short (stop loss order at 1.2876)
- USD/CHF: none
- AUD/USD: none
EUR/USD
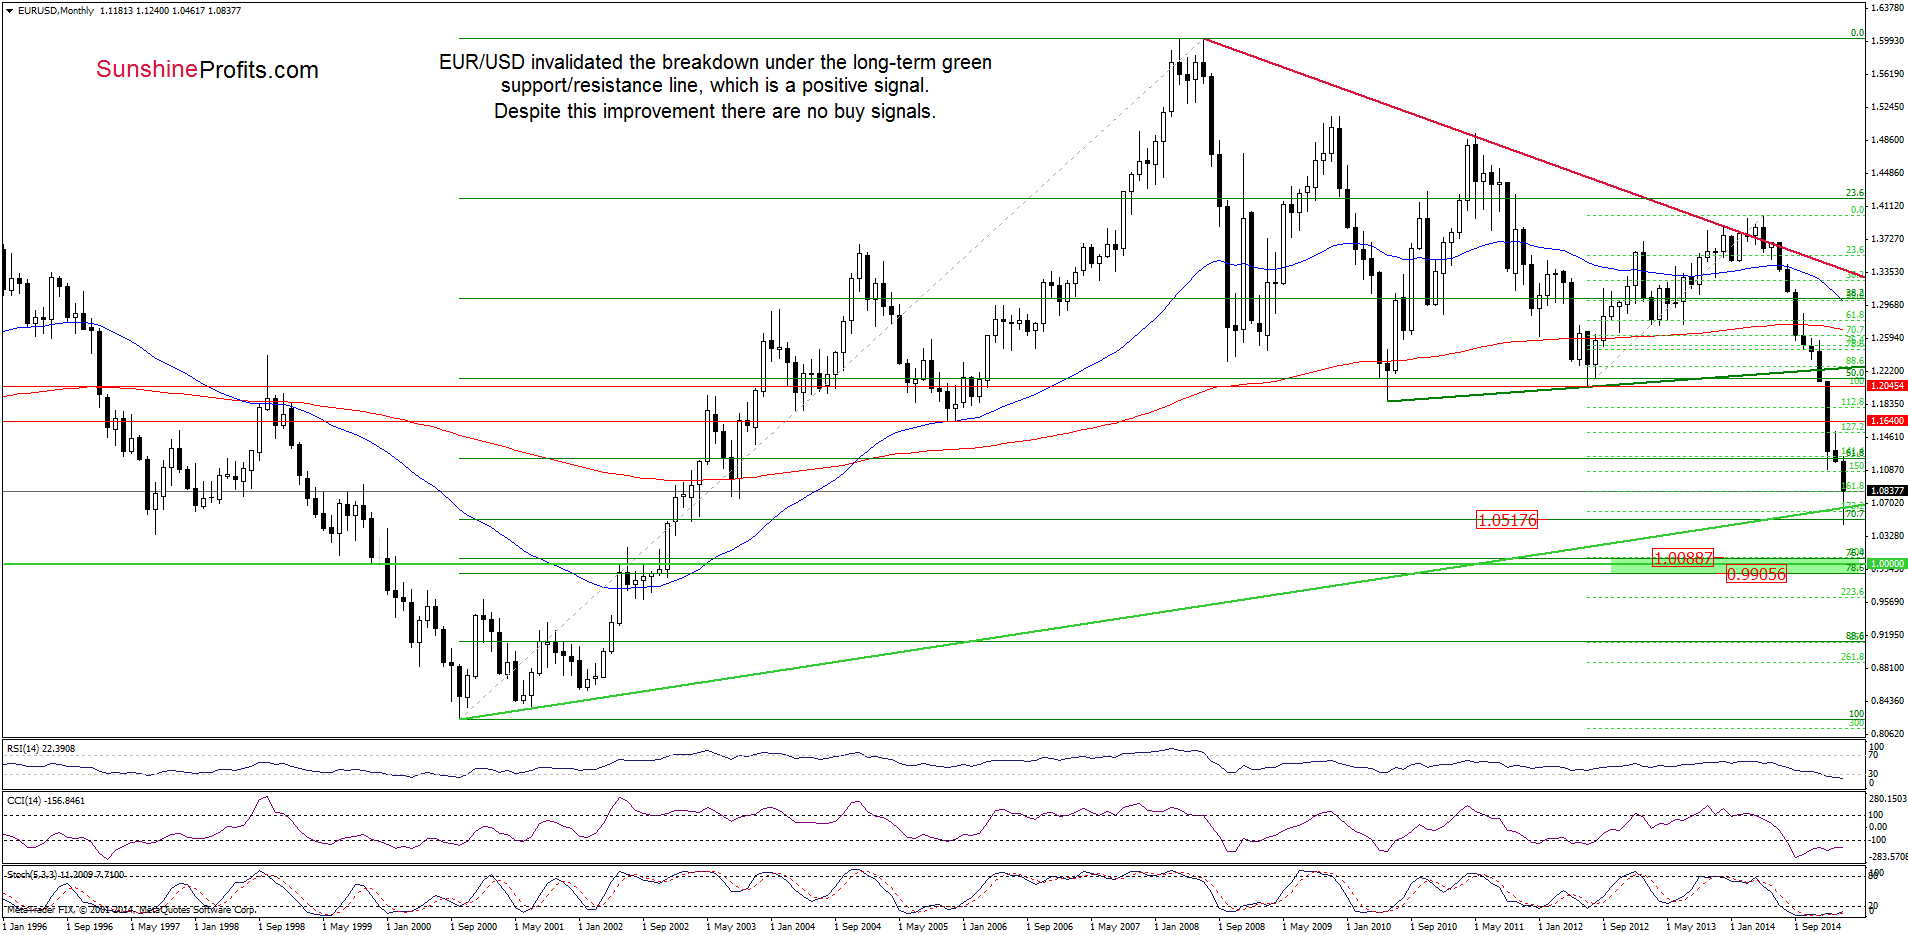
Looking at the weekly chart, we see that EUR/USD invalidated the breakdown under the long-term green support/resistance line, which is a positive signal that suggests further improvement. Nevertheless, we should keep in mind that although the indicators are oversold there are no buy signals, supporting the bullish case.
Having said that, let’s examine the daily chart and look for more clues about future moves.
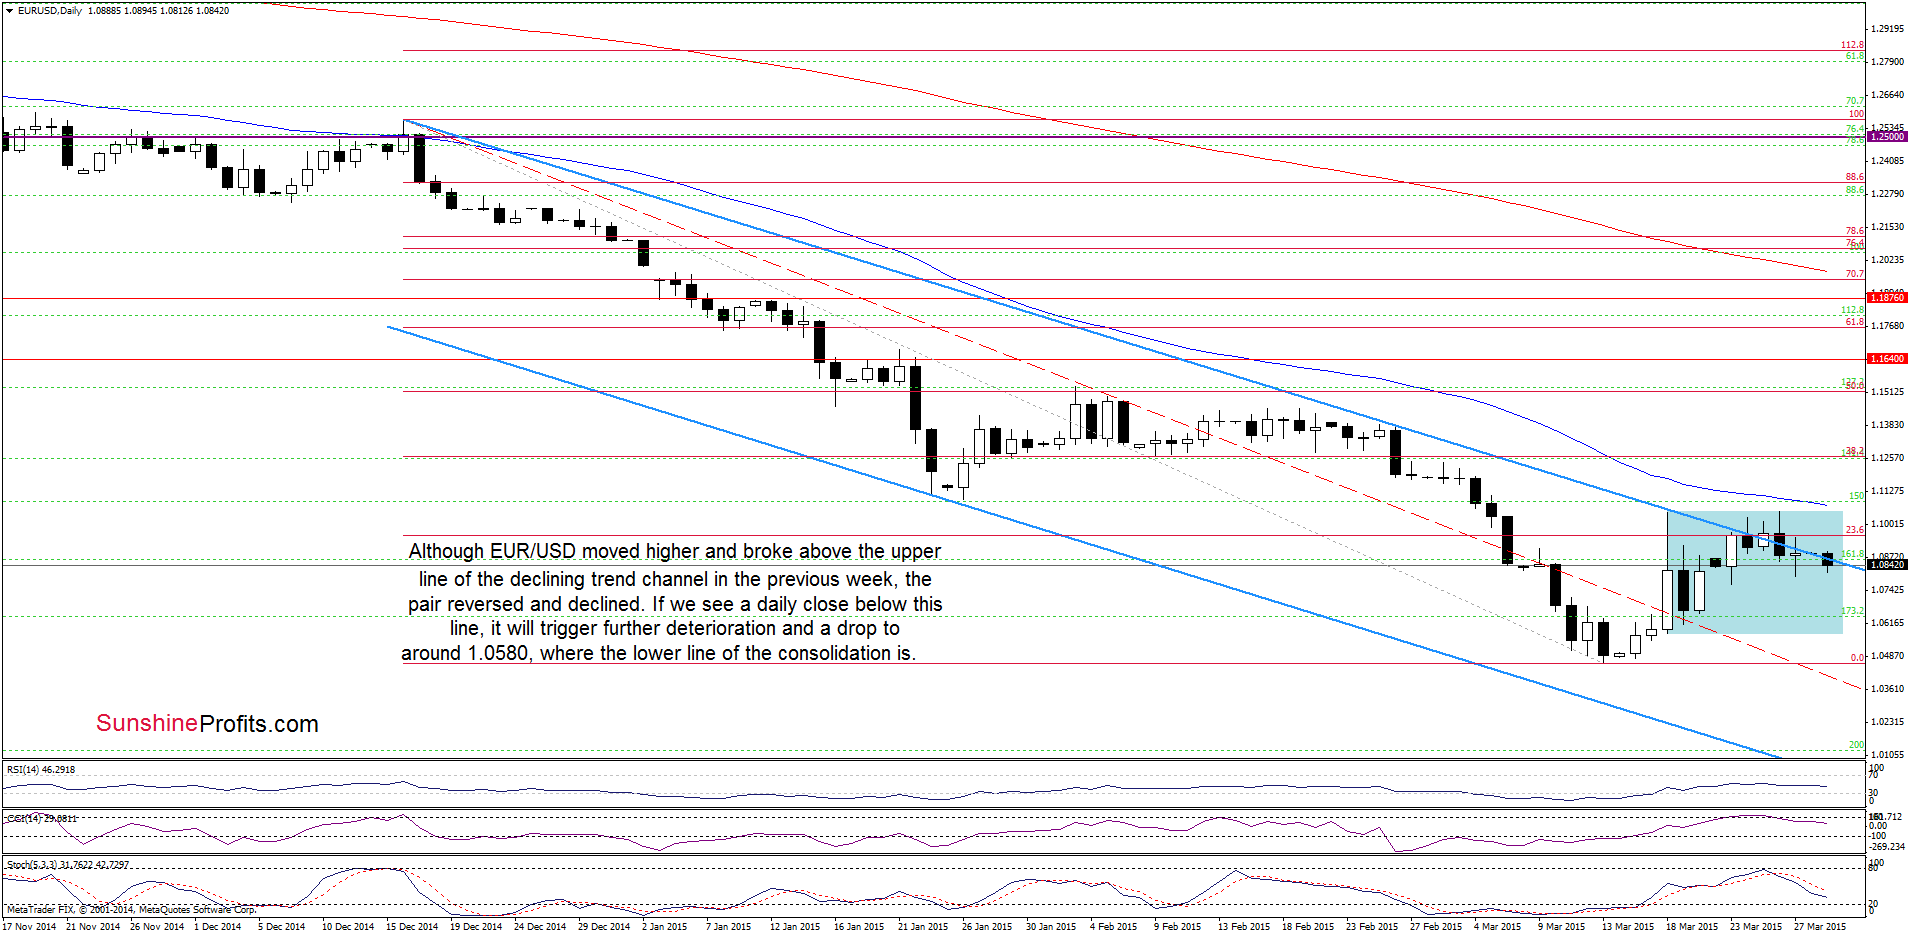
Looking at the daily chart, we see that although currency bulls managed to push the exchange rate above the upper line of the trend channel, the upper border of the consolidation in combination with the proximity to the 50-day moving average stopped further improvement, triggering a pullback. With this downward move, EUR/USD came back to the trend channel, which is a negative signal. In our opinion, if the pair closes the day below the upper line of the formation, we might see further deterioration and a drop to around 1.0580, where the lower line of the consolidation (and the Mar 18 low) is. At this point, it is worth noting that sell signals generated by the CCI and Stochastic Oscillator are still in place, supporting the bearish case.
Very short-term outlook: mixed with bearish bias
Short-term outlook: mixed
MT outlook: mixed
LT outlook: mixed
Trading position (short-term; our opinion): No positions are justified from the risk/reward perspective at the moment. We will keep you informed should anything change, or should we see a confirmation/invalidation of the above.
GBP/USD
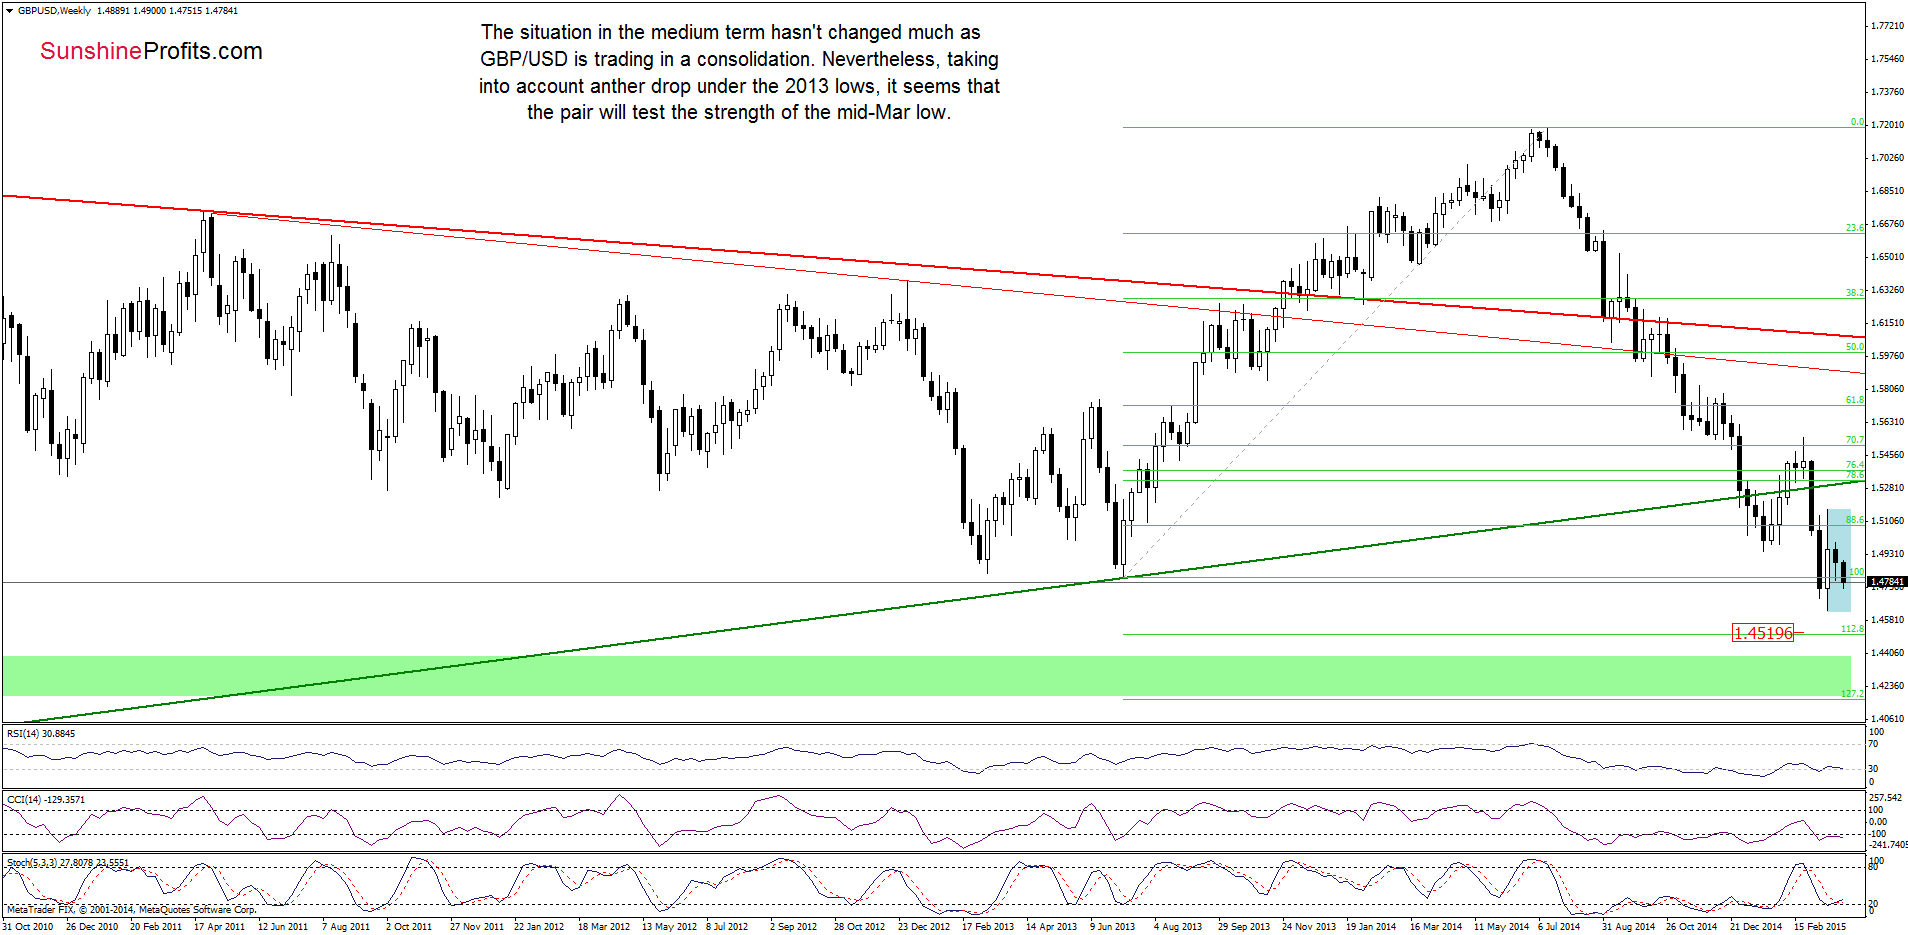
On the above chart, we see that the situation in the medium term hasn’t changed much as GBP/USD is trading in a consolidation (marked with blue). Nevertheless, taking into account te fact that the pair dropped under the 2013 lows once again, it seems that the pair will test the strength of the mid-Mar low in the coming week.
However, to have more complete picture of the exchange rate, let’s take a closer look at the daily chart below.
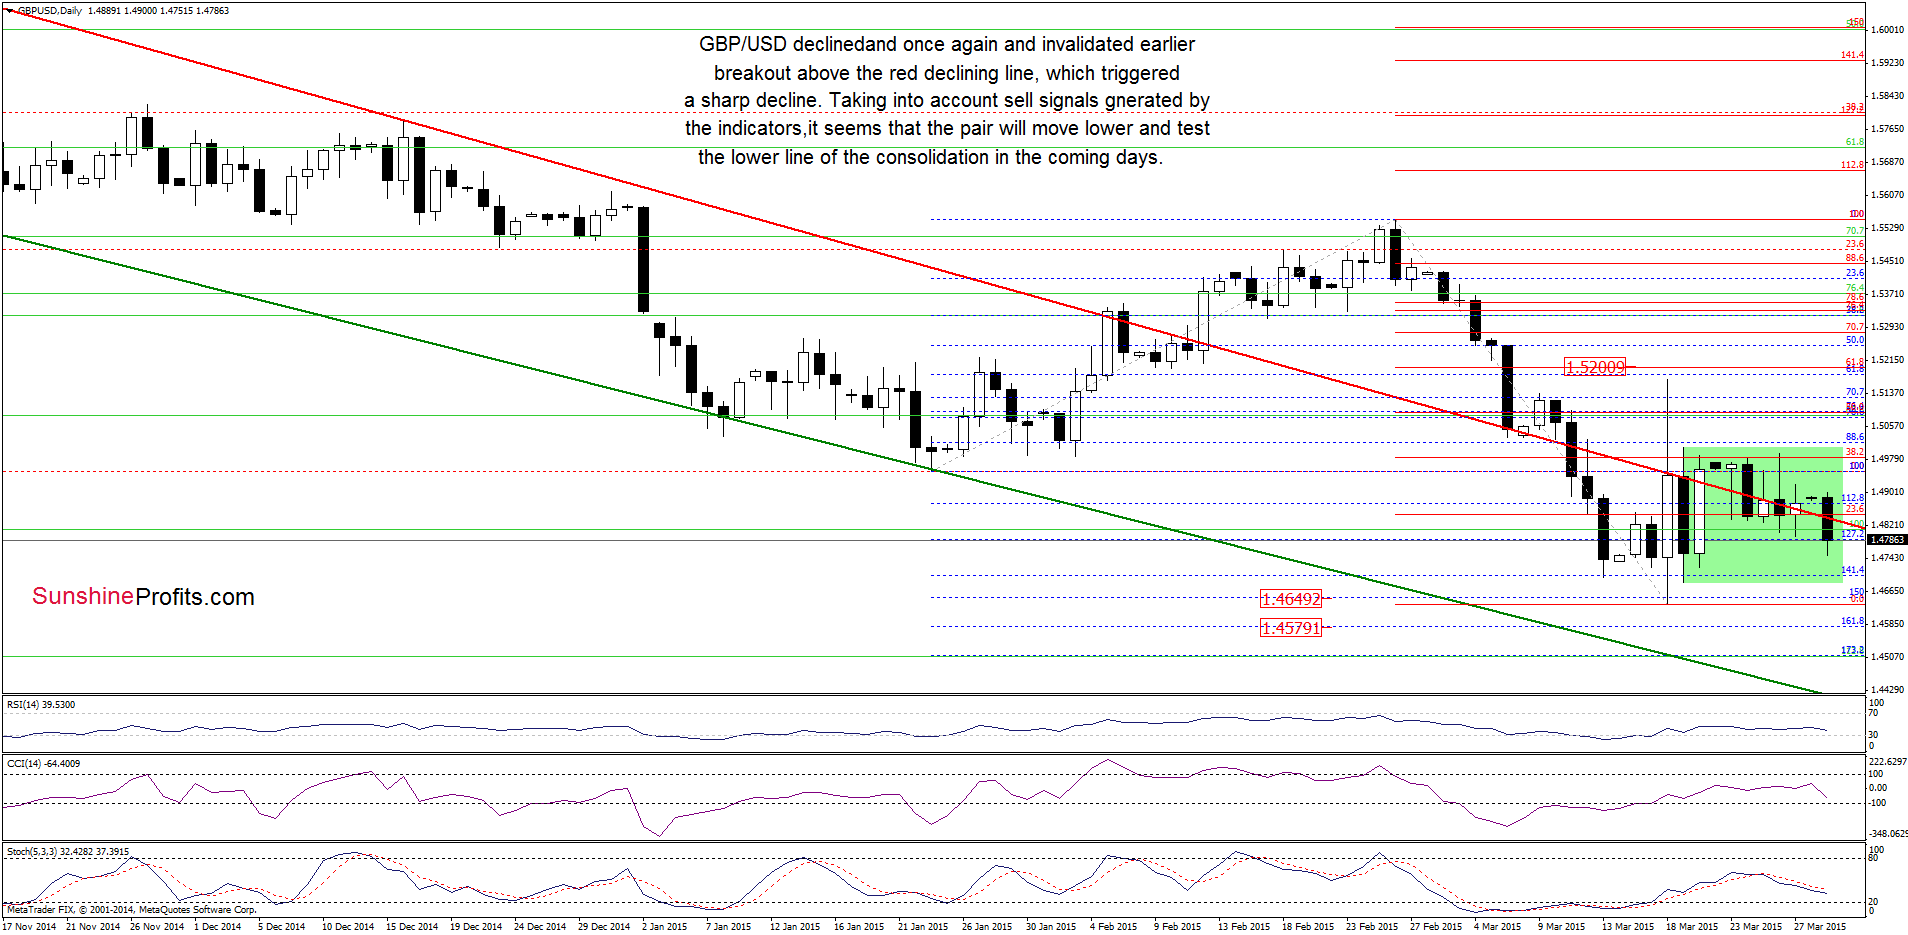
From this perspecive, we see that although GPB/USD climbed above the red resistance line, currency bulls didn’t manage to hold gained levels, which resulted in an invalidation of earlier breaktut. Taking this deterioration into account, and combining it with sell signals generated by the indicators, it seems to us that the pair will move lower and test the lower line of the consolidation in the coming days.
Very short-term outlook: mixed with bearish bias
Short-term outlook: mixed
MT outlook: mixed
LT outlook: mixed
Trading position (short-term; our opinion): No positions are justified from the risk/reward perspective at the moment. We will keep you informed should anything change, or should we see a confirmation/invalidation of the above.
USD/JPY
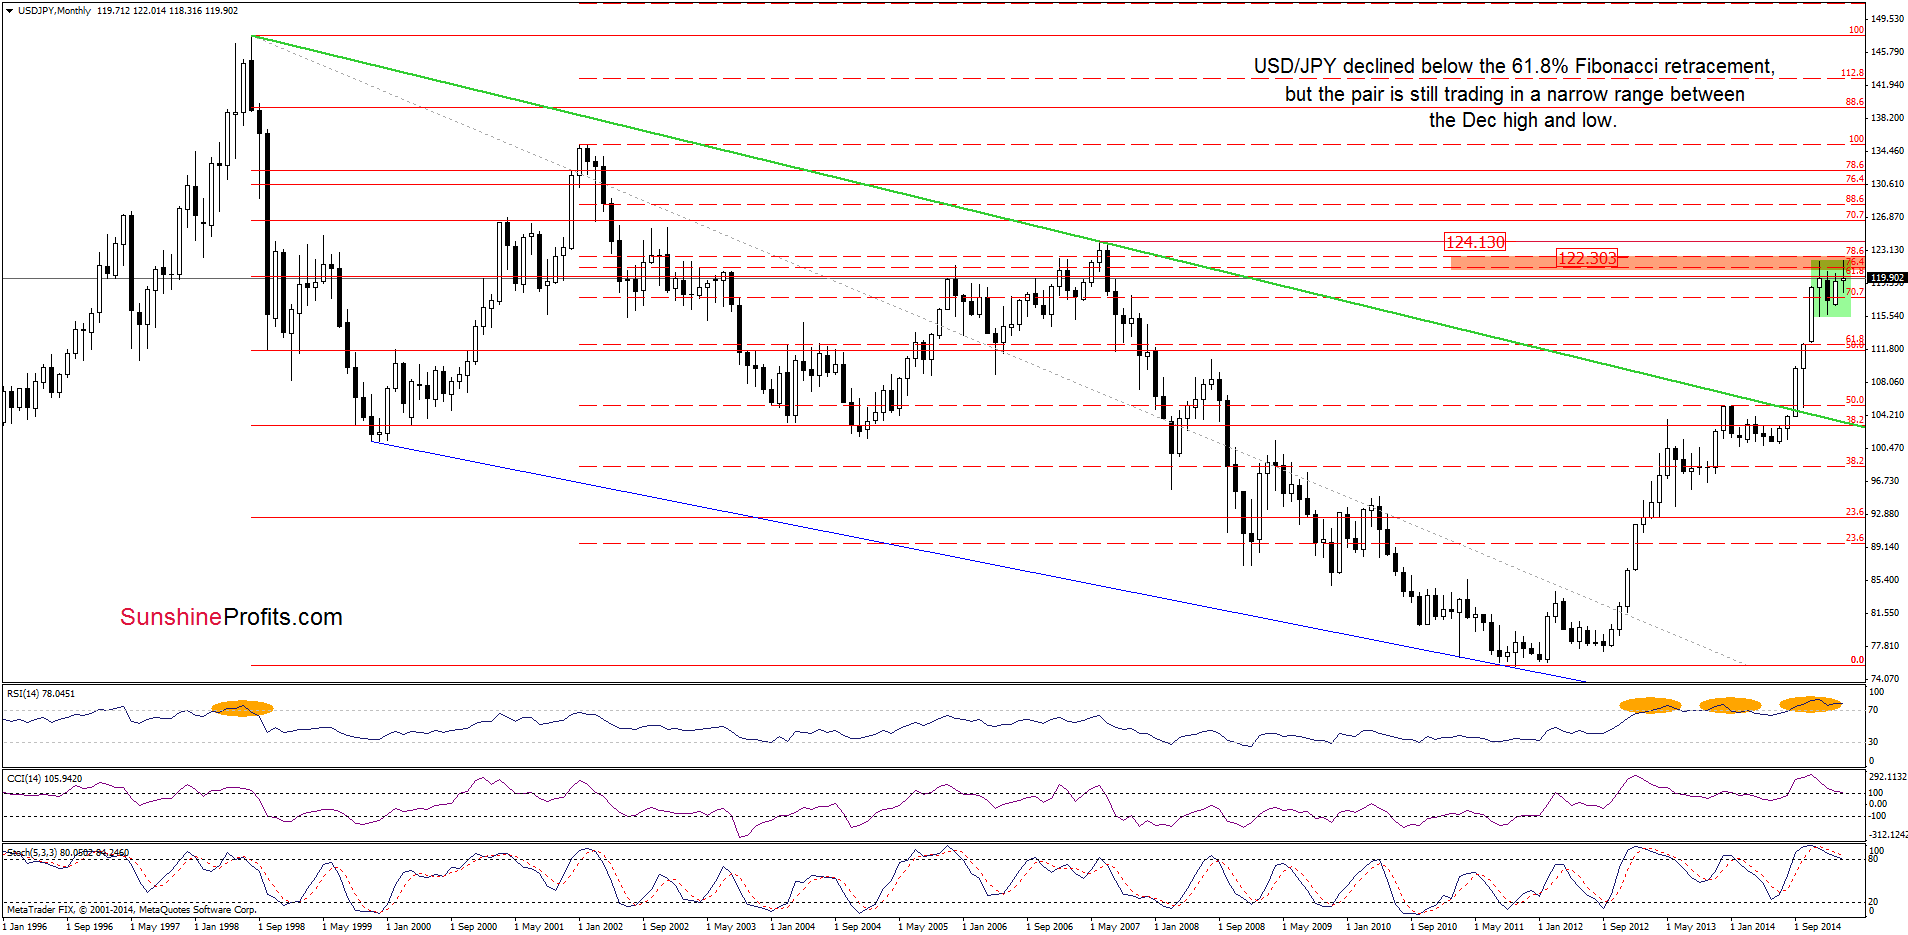
On the above chart, we see that USD/JPY declined below the 61.8% Fibonacci retracement level (based on the entire 1998-2011 declines), but the pair still remains in a narrow range between the Dec high and low. Nevertheless, the current position of the indicators suggests that a trend reversal in the coming month should not surprise us.
Having said that, let’s examine the daily chart.
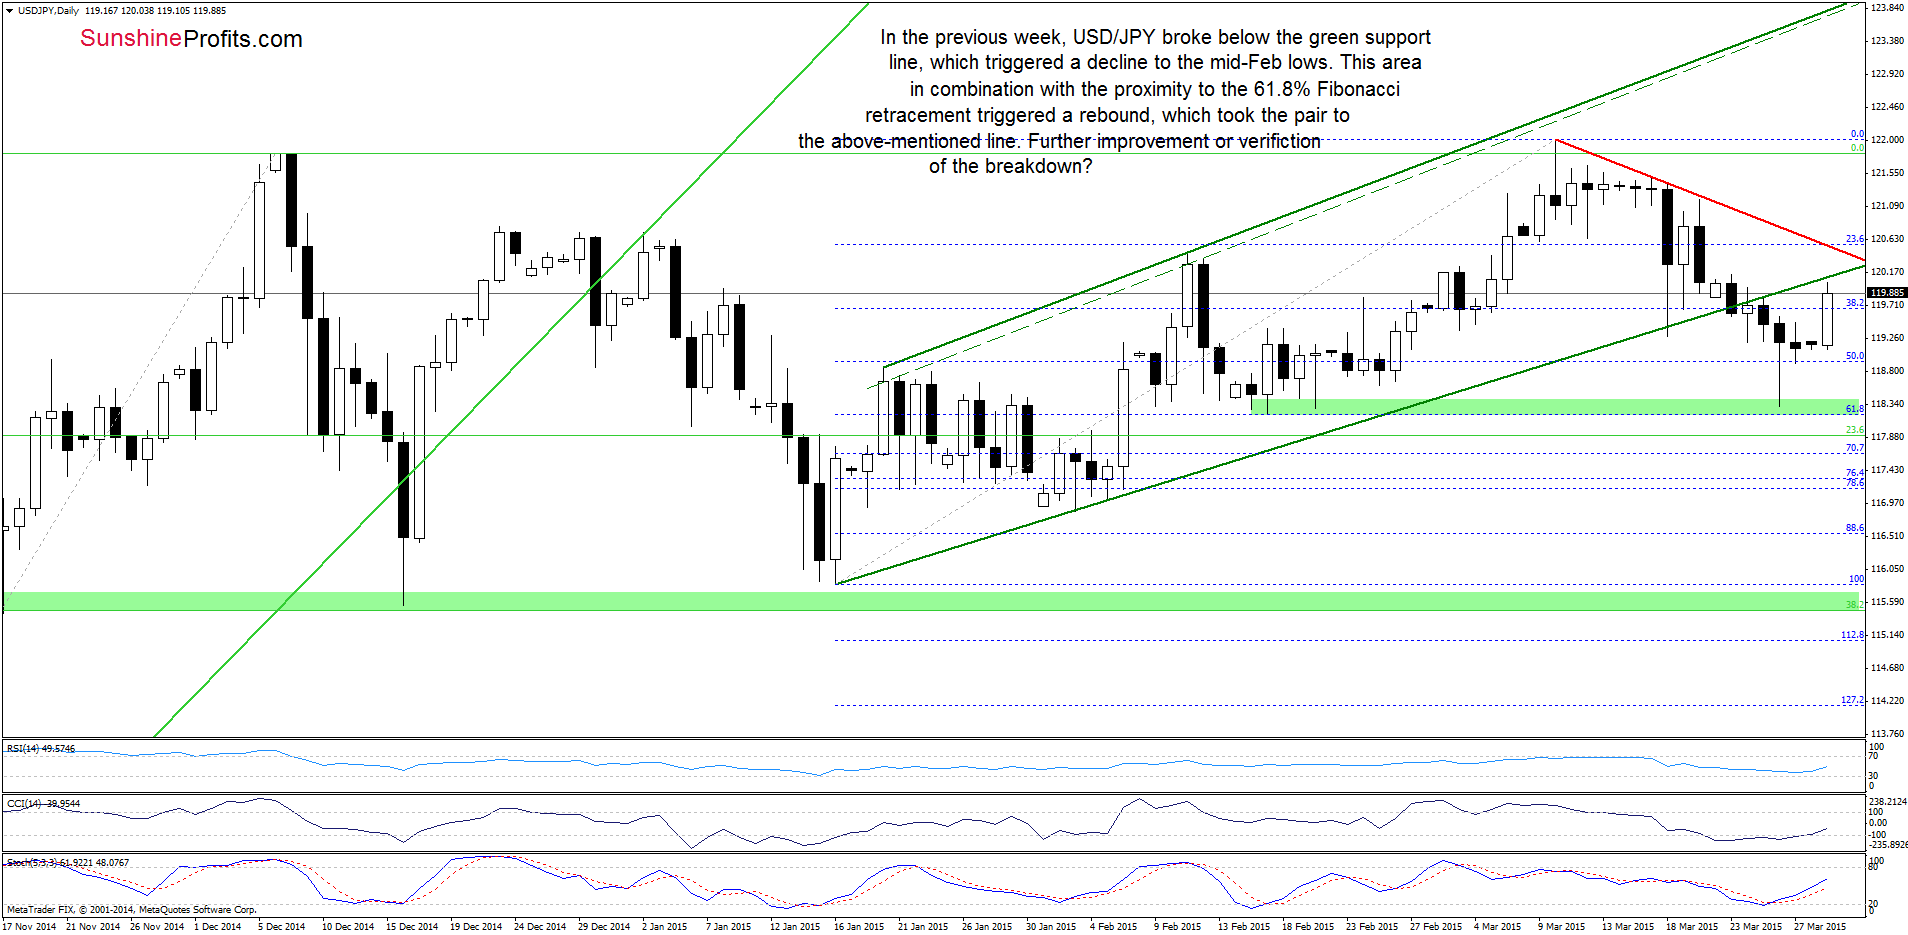
As you see on the above chart, USD/JPY broke below the green support line, which triggered a decline to the mid-Feb lows. This area, in combination with the proximity to the 61.8% Fibonacci retracement, triggered a rebound, which took the pair to its key support/resistance line once again. What’s next? Taking into account buy signals generated by the indicators it seems that currency bulls will try to push the exchange rate higher. Nevertheless, we should keep in mind that even if they succeed, we won’t see a comeback to the last week’s high as long as the red resistance line is in play (currently around 120).
Very short-term outlook: mixed with bullish bias
Short-term outlook: mixed
MT outlook: mixed
LT outlook: bullish
Trading position (short-term; our opinion): No positions are justified from the risk/reward perspective at the moment. We will keep you informed should anything change, or should we see a confirmation/invalidation of the above.
USD/CAD
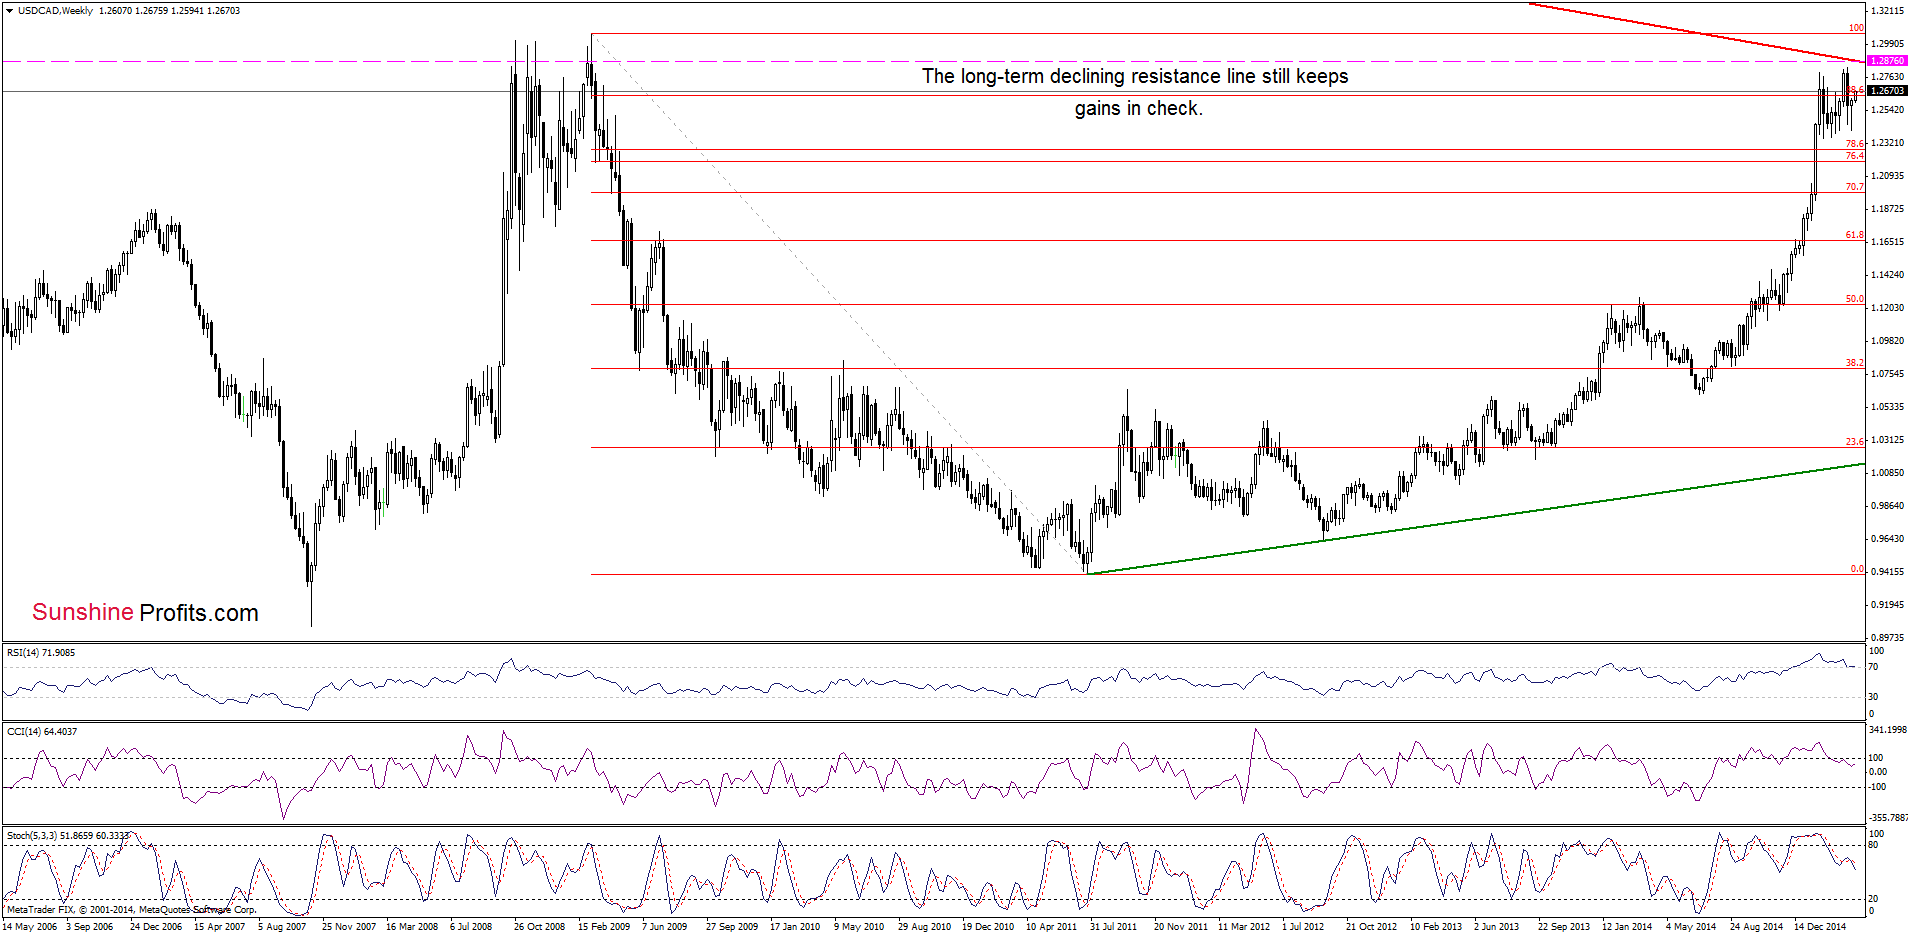
As you see on the weekly chart, the situation in the medium term hasn’t changed much as USD/CAD is still trading under the long-term red declining resistance line, which keeps gains in check. In the previous weeks, the proximity to this key resistance was enough to trigger a correction. Therefore, we think that as long as there is no breakout above this line, the probability of a reversal is high.
Are there any short-term factors that could support or hinder the realization of the above scenario? Let’s check.
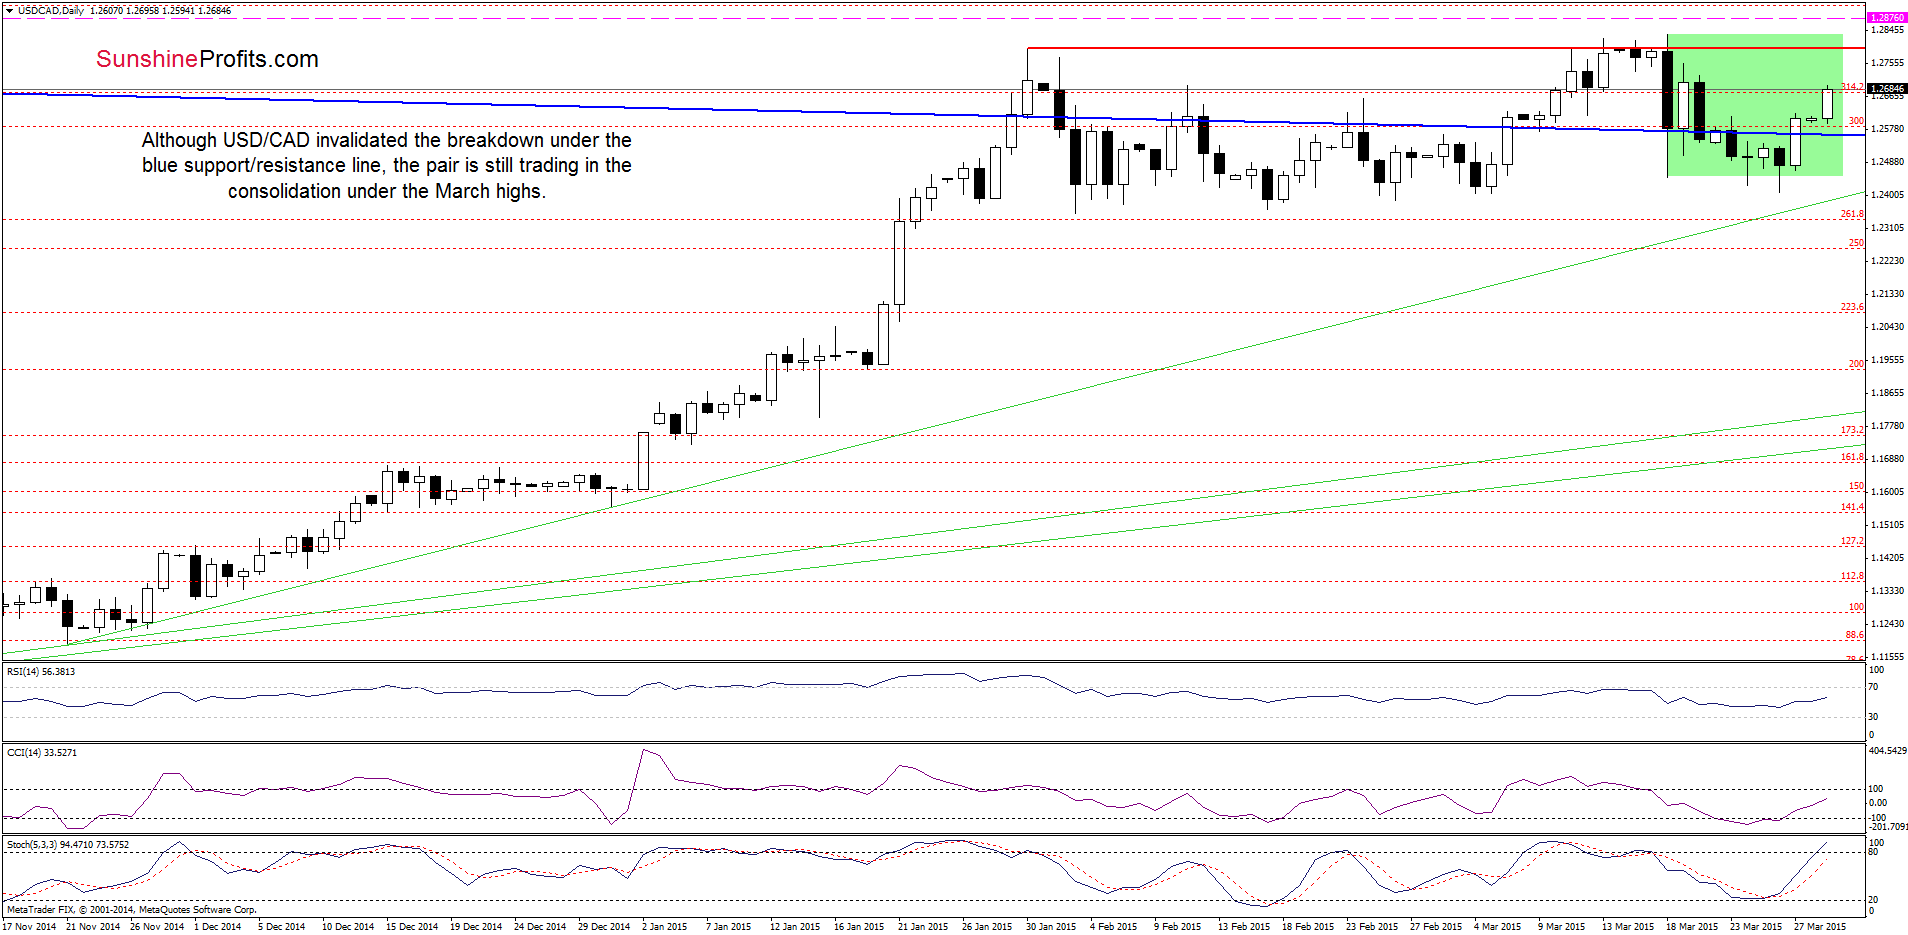
From today’s point of view, we see that although USD/CAD invalidated the breakdown under the blue support line the pair is still trading in the consolidation (marked with green) under the Mar high. Therefore, it seems to us that as long as there is no daily close above this resistance level further improvement is questionable (especially when we factor in the proximity to the long-term resistance line marked on the weekly chart) and another attempt to move lower should not surprise us.
Very short-term outlook: bearish
Short-term outlook: mixed with bearish bias
MT outlook: mixed
LT outlook: mixed
Trading position (short-term; our opinion): Short positions with a stop loss order at 1.2876 are justified from the risk/reward perspective. We will keep you informed should anything change, or should we see a confirmation/invalidation of the above.
USD/CHF
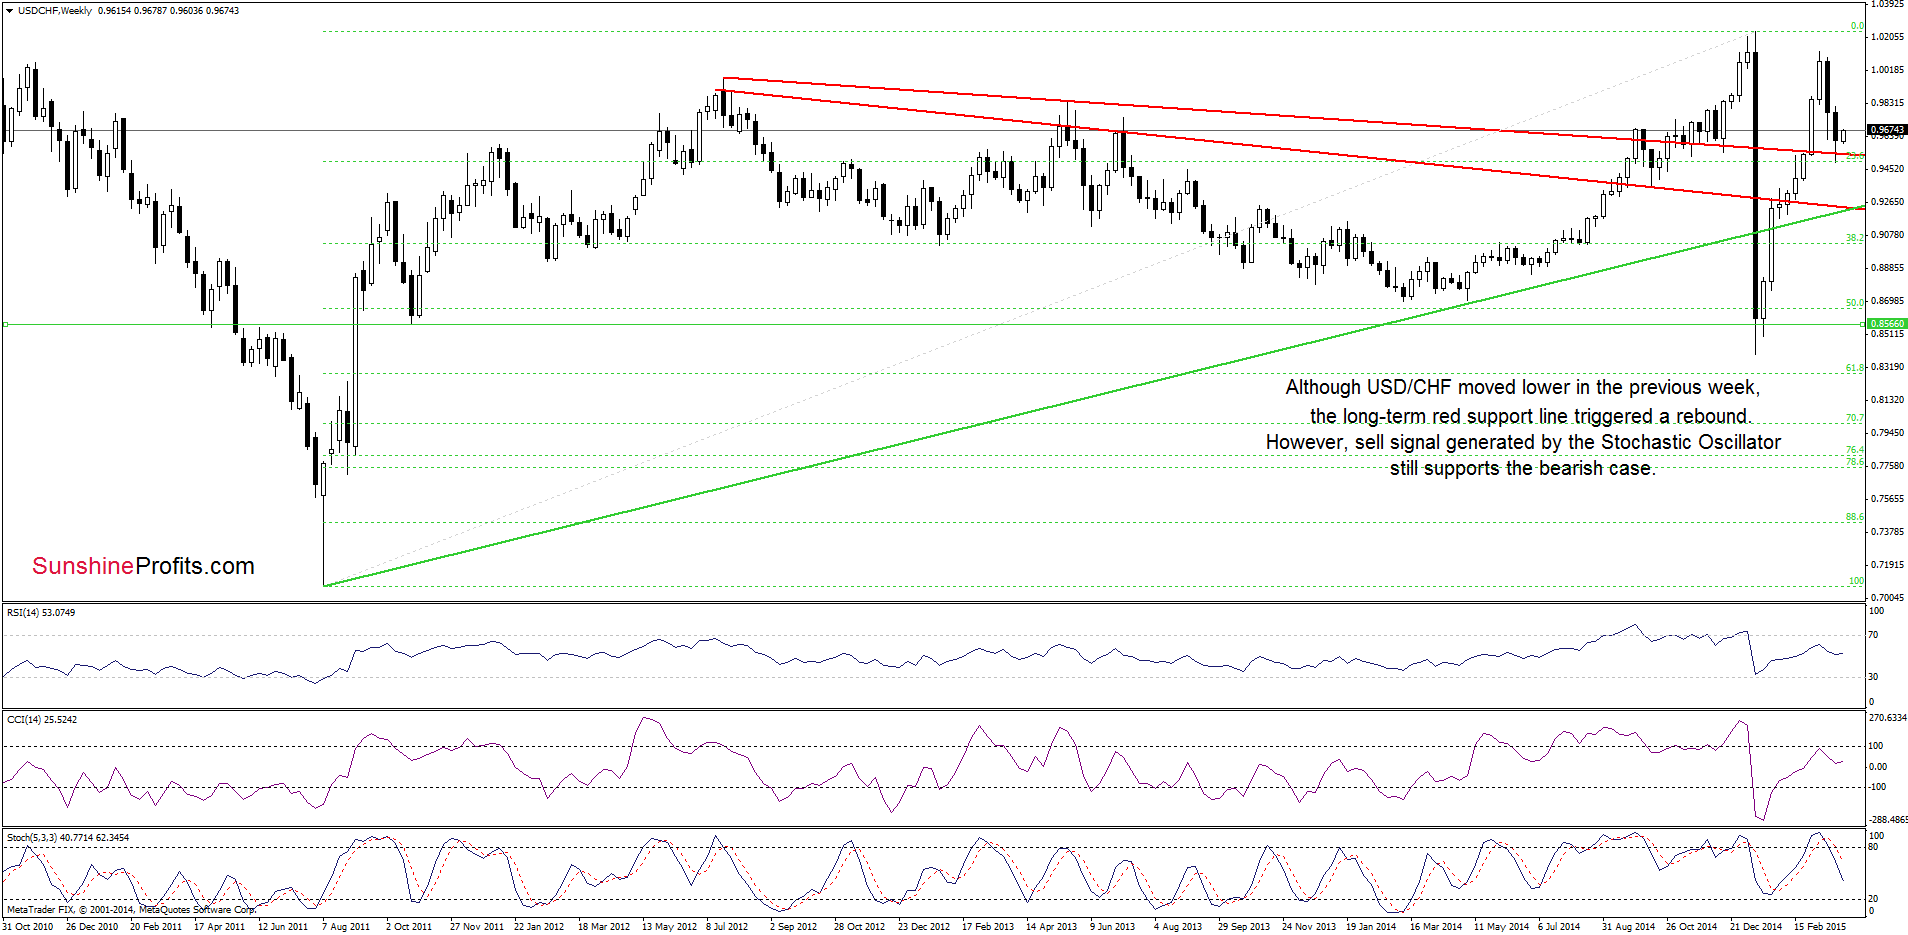
Although USD/CHF moved lower earlier in the previous week, the long-term red support line triggered a rebound. Nevertheless, we should keep in mind that the sell signal generated by the Stochastic Oscillator is still in play, supporting the bearish case.
Having said that, let’s check what we can infer from the daily chart.
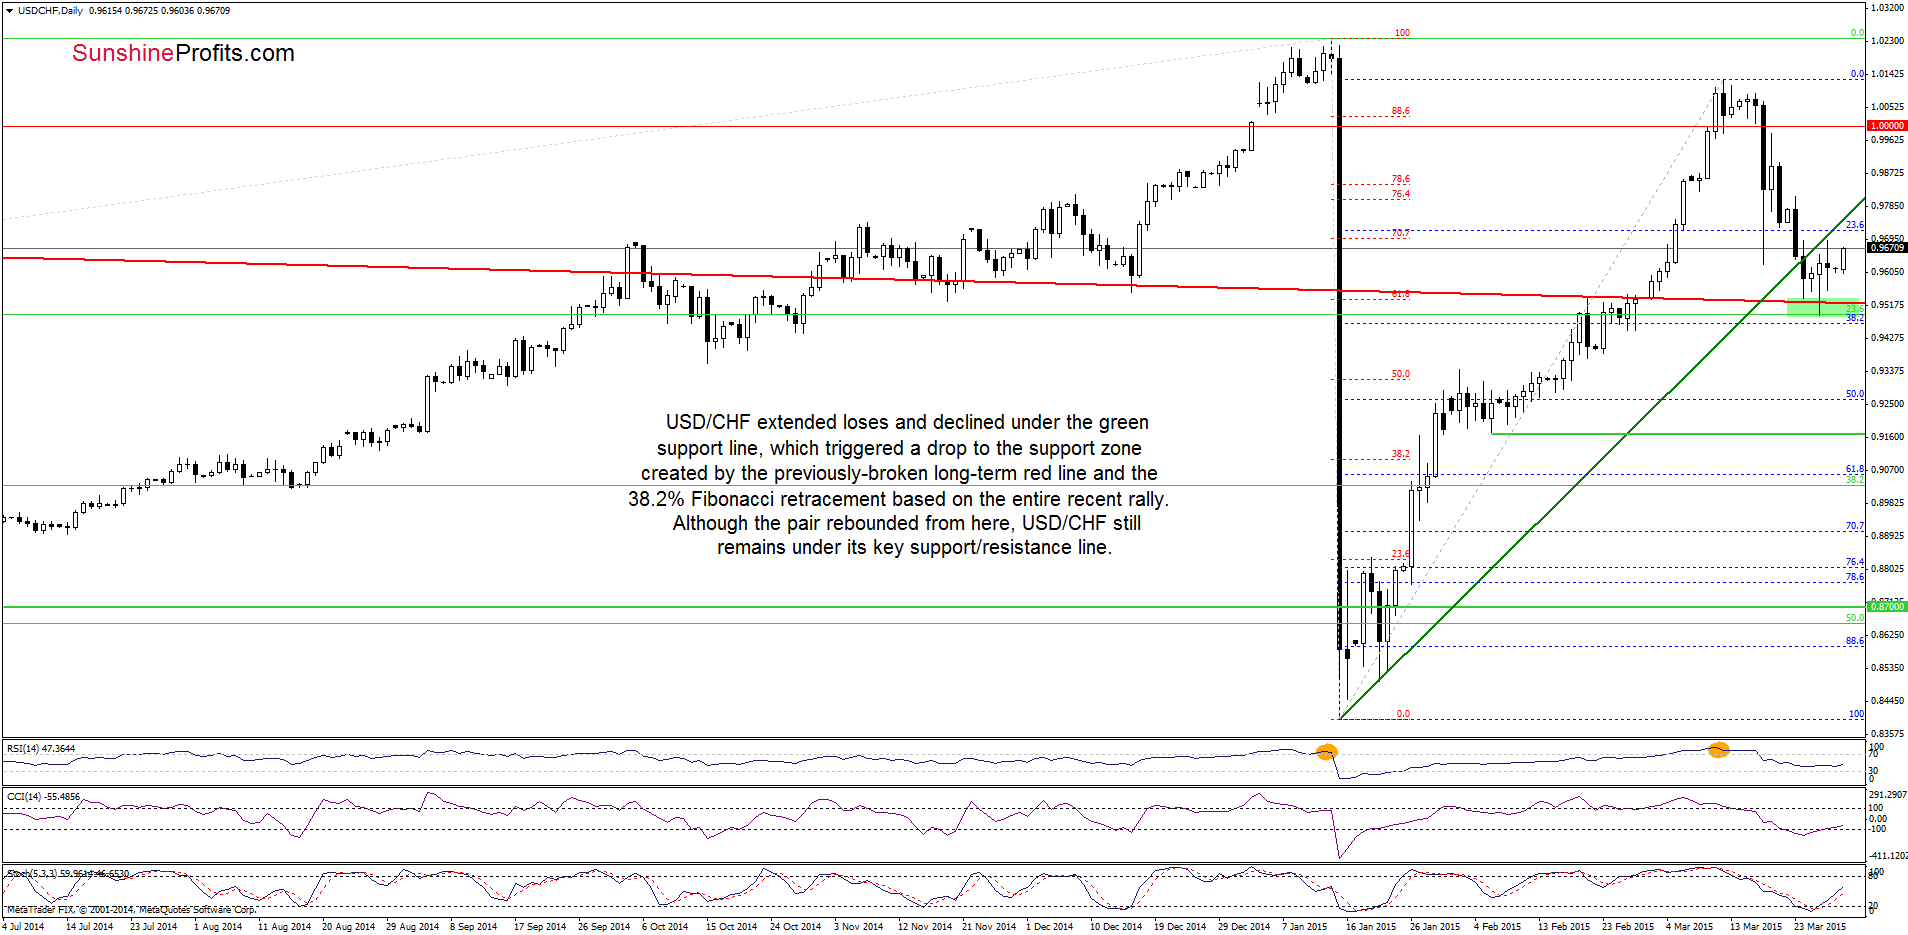
On the above chart we see that USD/CHF extended losses and declined under the green support line, which triggered a drop to the support zone created by the previously-broken long-term red line and the 38.2% Fibonacci retracement based on the entire recent rally. As you see on the above chart, this area triggered a rebound in the recent days, but the exchange rate still remains under the green line. This suggests that as long as there is no comeback above it further improvement is questionable and another test of the strength of the long-term support line is likely. Nevertheless, we should keep in mind that the CCI and Stochastic Oscillator generated buy signals, suggesting that currency bulls will try to push the pair higher in the coming week.
Very short-term outlook: mixed with bullish bias
Short-term outlook: mixed
MT outlook: mixed
LT outlook: bearish
Trading position (short-term; our opinion): No positions are justified from the risk/reward perspective at the moment. We will keep you informed should anything change, or should we see a confirmation/invalidation of the above.
AUD/USD
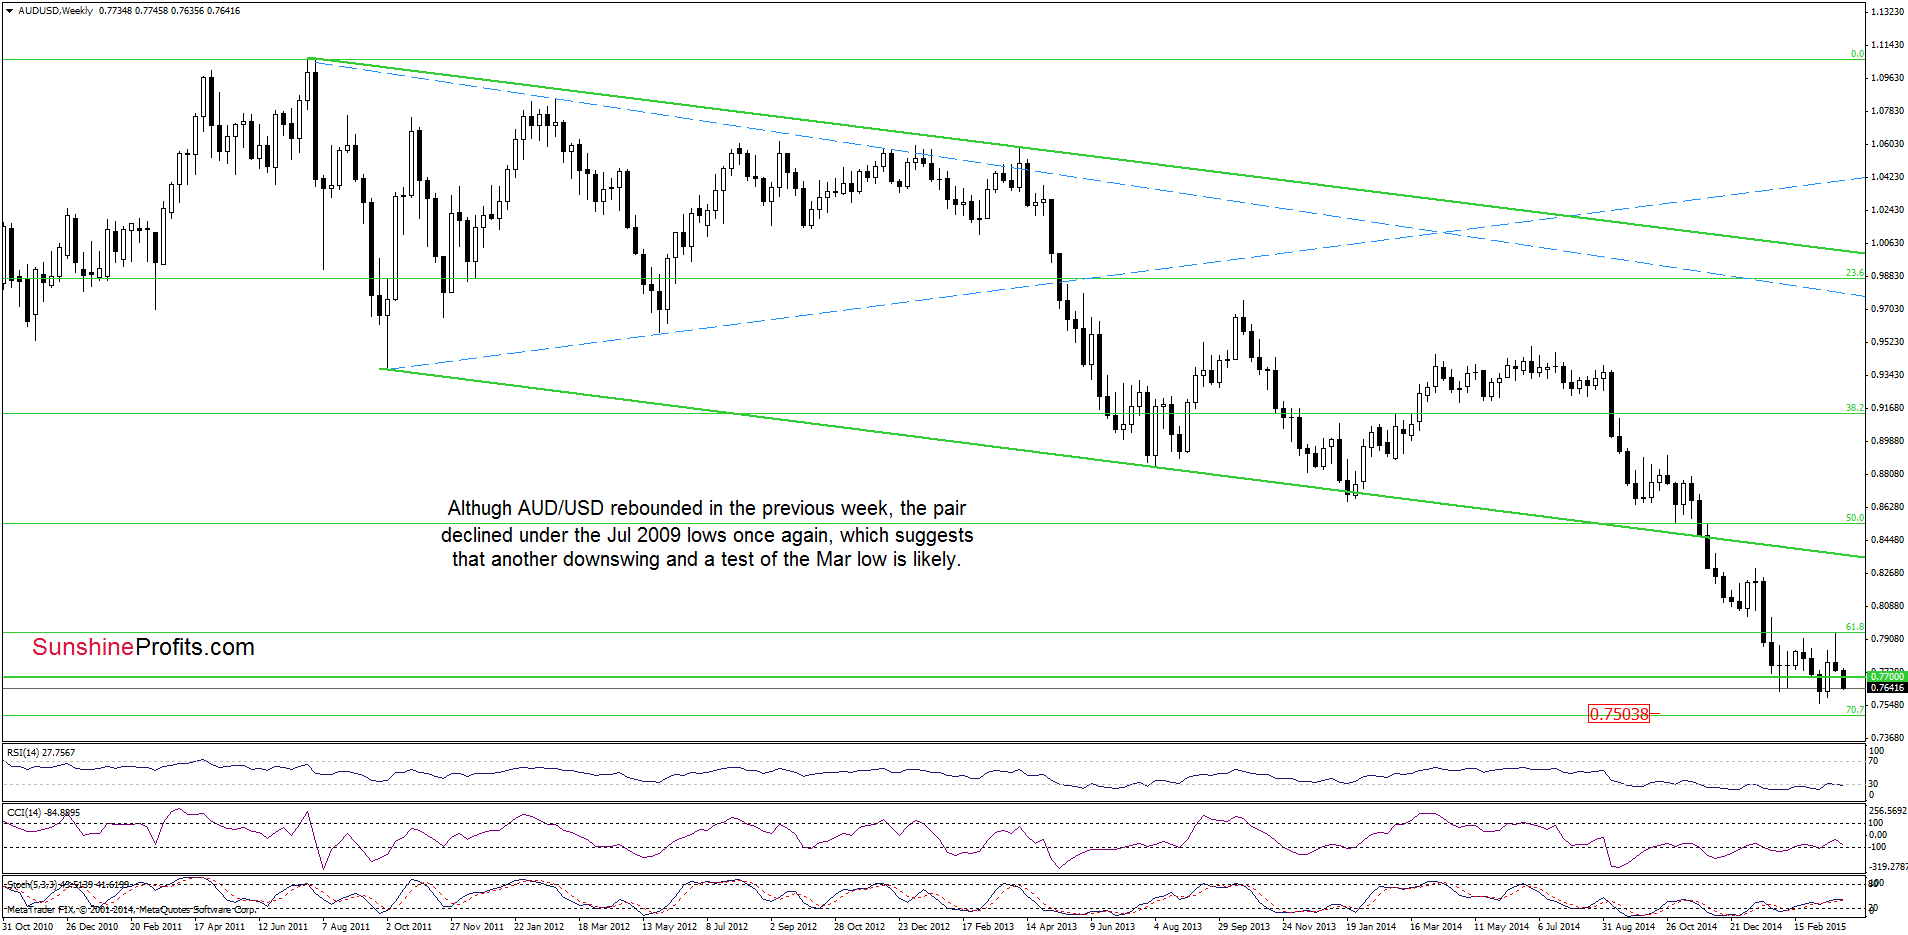
Although AUD/USD rebounded in the previous week, the pair came back under the Jul 2009 lows, which suggests that another downswing and a test of Mar low is likely. At this point, it is worth noting that if this support is broken, the next target for currency bears would be around 0.7504, where the 70.7% Fibonacci retracement is.
Having said that, let’s focus on the very short-term changes.

Although AUD/USD increased above the declining orange line, the pair reversed and declined, invalidating earlier breakout. This is a bearish signal, which suggests that further declines are just around the corner – espiecially if the exchange rate closes the day uner the green support line based on the recent lows. If we see such price action, the initial downside target would be at 0.7559 (the Mar 11 low). Please note that if it is broken, the next target for currency bears would be around 0.7542, where the 127.2% Fibonacci extension is.
Very short-term outlook: mixed with bearish bias
Short-term outlook: mixed
MT outlook: mixed
LT outlook: mixed
Trading position (short-term; our opinion): No positions are justified from the risk/reward perspective at the moment. We will keep you informed should anything change, or should we see a confirmation/invalidation of the above.
Thank you.
Nadia Simmons
Forex & Oil Trading Strategist
Przemyslaw Radomski, CFA
Founder, Editor-in-chief
Gold & Silver Trading Alerts
Forex Trading Alerts
Oil Investment Updates
Oil Trading Alerts

