
Since the beginning of the week the USD Index increased from 97.31 to 100.29, hitting a fresh almost 15-year high against the basket of major currencies. Although today’s data showed that producer prices fell 0.5% last month (missing expectations for a 0.3% gain) and core producer prices (without food, energy and trade) dropped by 0.5% in February (missing forecasts of a 0.1% rise), while the University of Michigan’s consumer sentiment index fell to 91.2 in March, the index still remains above the psychologically important level of 100. How this week’s rally influenced the short-term pictures of major currency pairs?
In our opinion the following forex trading positions are justified - summary:
- EUR/USD: none
- GBP/USD: none
- USD/JPY: none
- USD/CAD: short (stop loss order at 1.2876)
- USD/CHF: none
- AUD/USD: none
EUR/USD
Quoting our previous Forex Trading Alert:
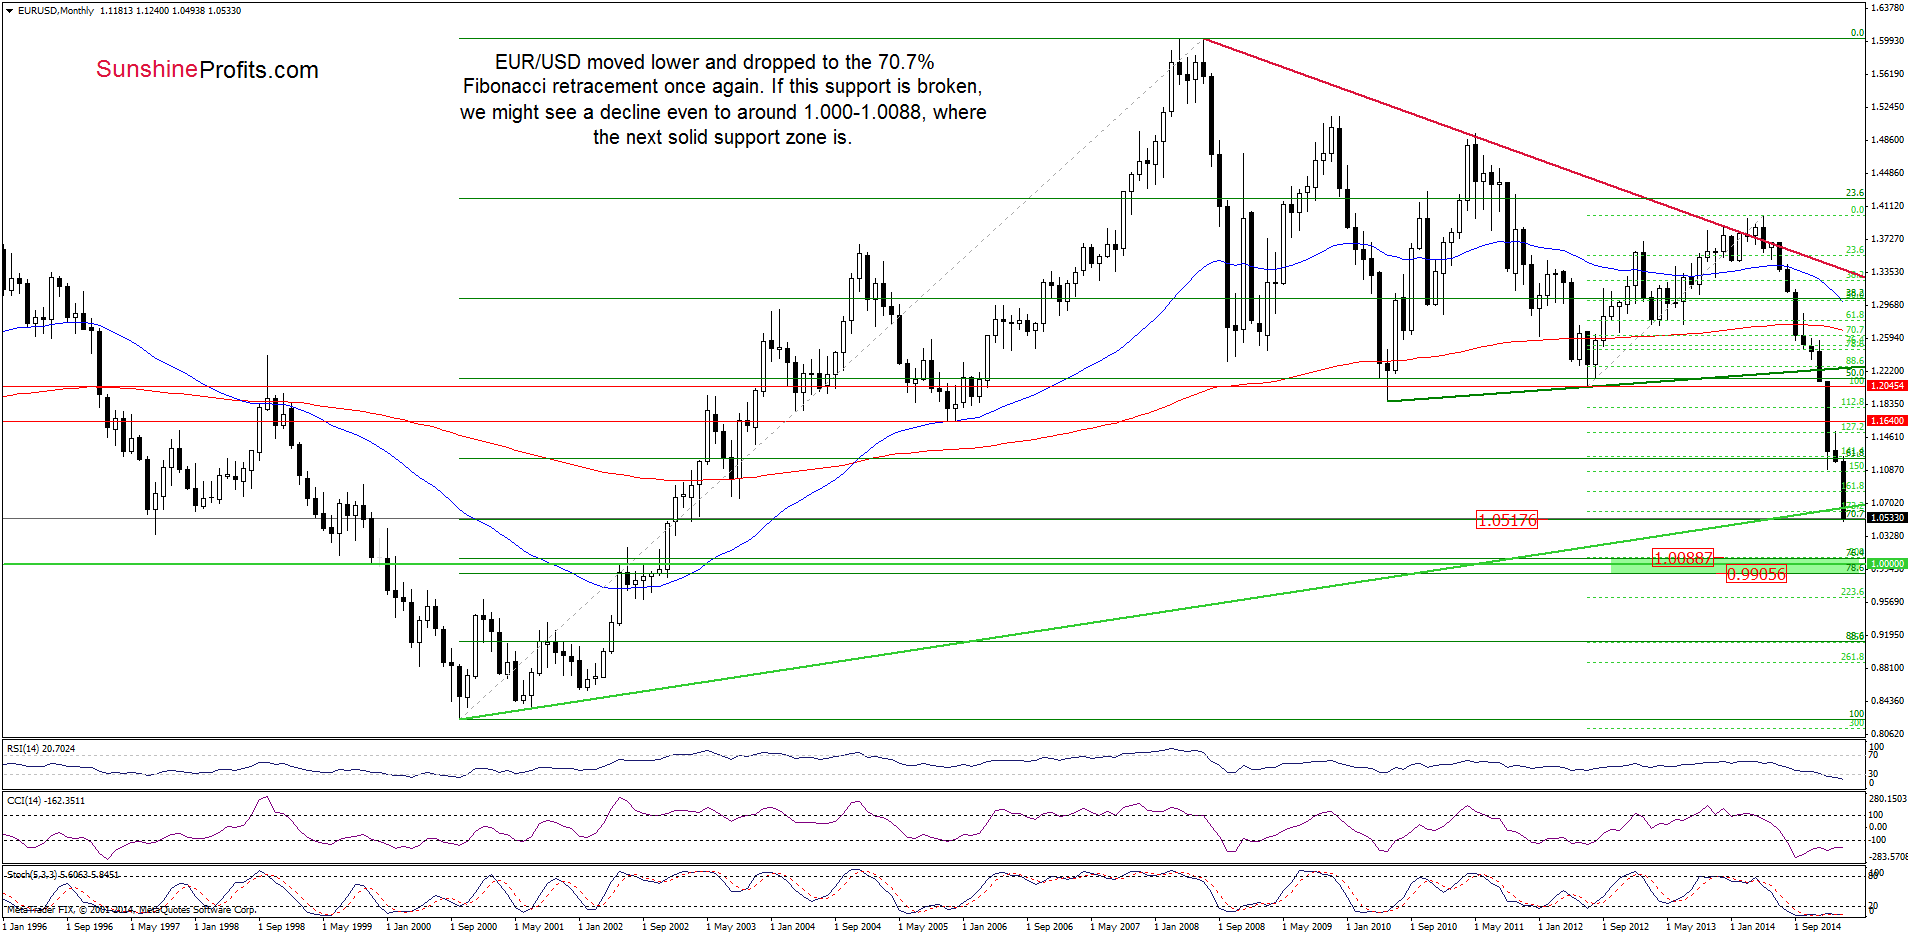
(…) the exchange rate reversed and rebounded slightly in the following hours, which resulted in an invalidation of the breakdown under the 70.7% Fibonacci retracement. Although this is a positive signal, we should keep in mind that the exchange rate still remains under the previously-broken long-term green and medium-term red resistance lines. In our opinion, as long as there is no comeback above these lines further improvement is questionable and another downswing (and a test of yesterday low) should not surprise us.
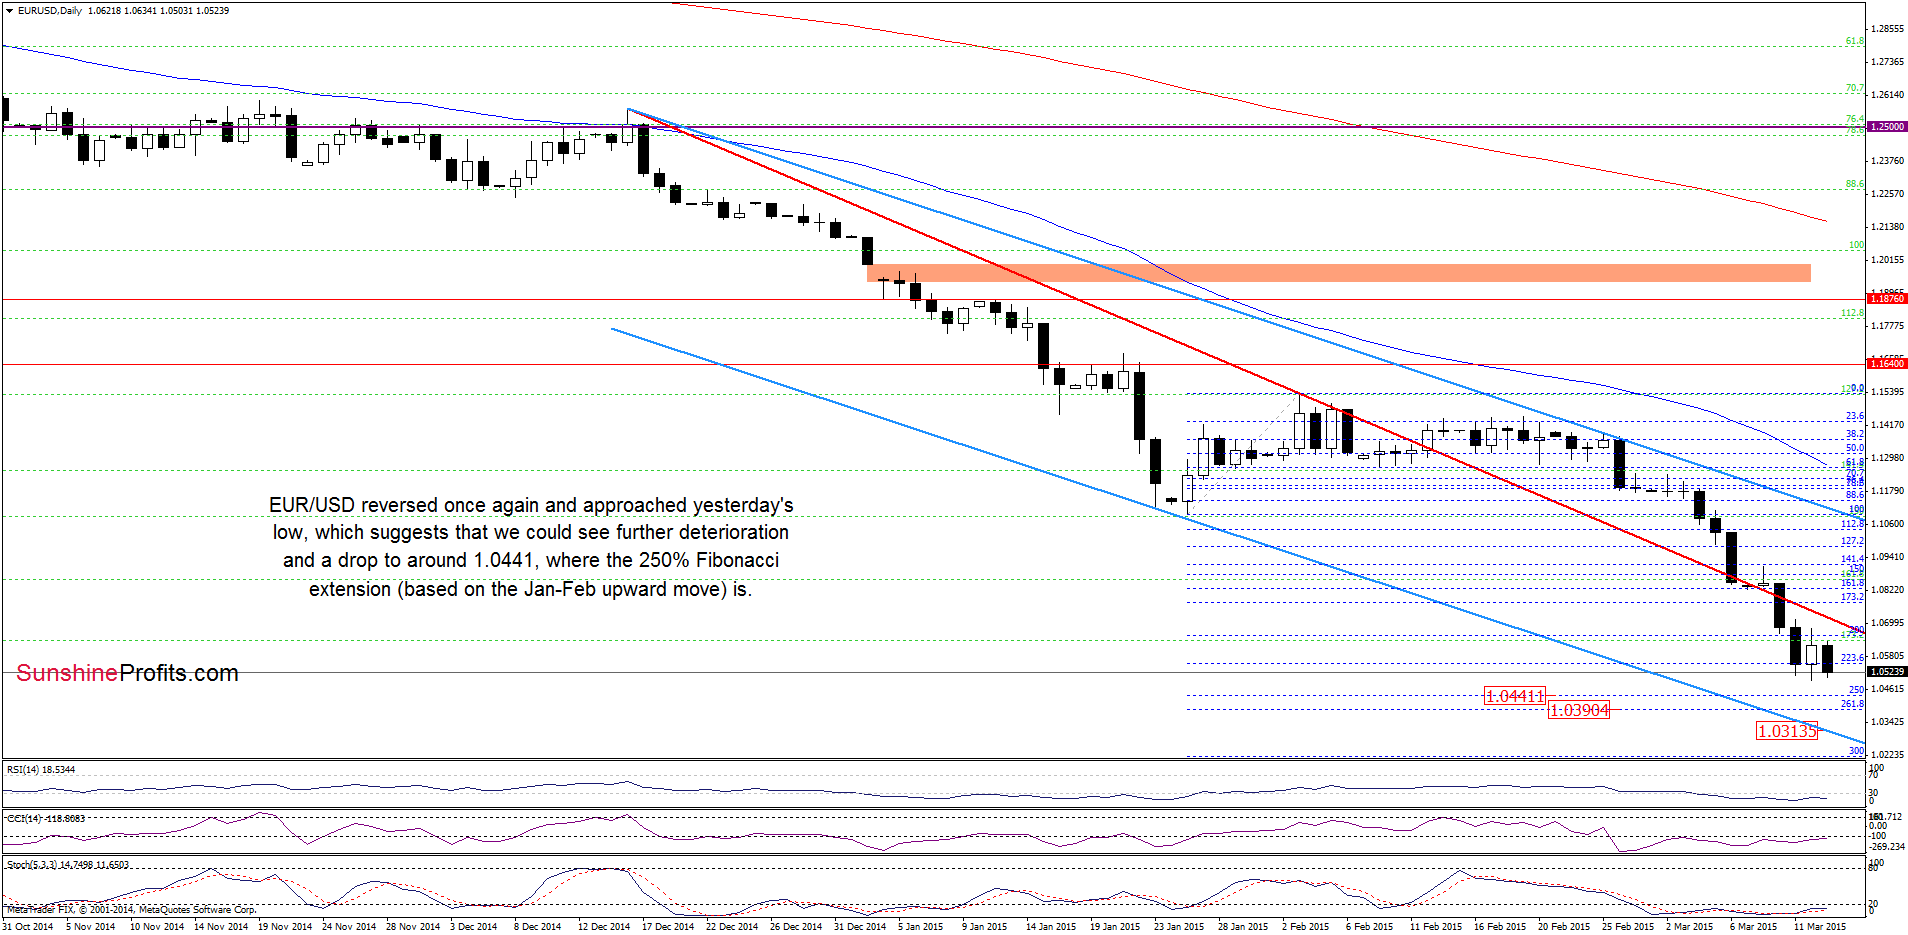
Looking at the daily chart, we see that the situation developed in line with the above-mentioned scenario as EUR/USD reversed and approached yesterday’s low. Taking this fact into account, and combining it with a comeback under the 70.7% Fibonacci retracement and the breakdown below the long-term green (marked on the weekly chart below) and medium-term red lines, it seems that lower values of the exchange rate are still ahead us. If this is the case, the initial downside target would be around 1.0441, where the 250% Fibonacci extension (based on the Jan-Feb upward move) is. If it is broken, we could see a decline to 1.0390 (261.8% extension) or 1.0313 (the lower border of the declining trend channel). If this support line is broken, EUR/USD will likely test the green support zone around 1.0000-1.1.0088 marked on the weekly chart.
Very short-term outlook: bearish
Short-term outlook: mixed
MT outlook: mixed
LT outlook: mixed
Trading position (short-term; our opinion): No positions are justified from the risk/reward perspective at the moment. We will keep you informed should anything change, or should we see a confirmation/invalidation of the above.
GBP/USD
Quoting our last commentary on this currency pair:
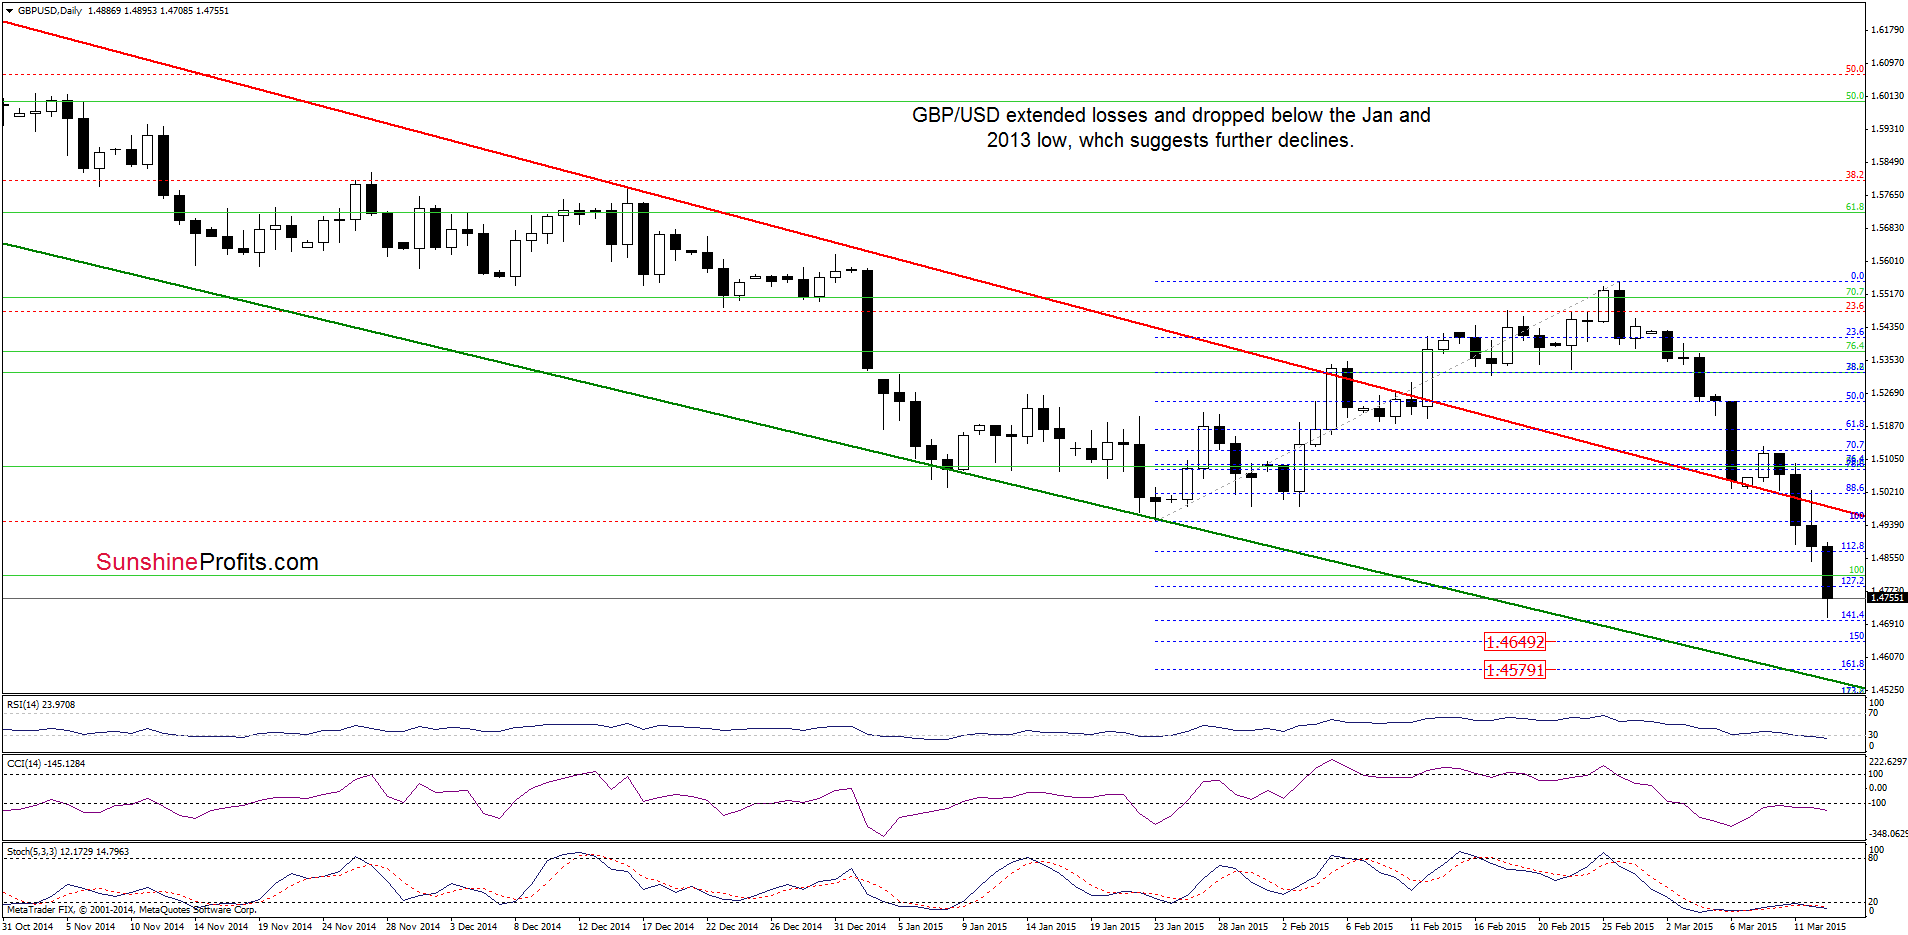
(…) a sharp decline (…) approached the exchange rate to the Jan low. (…) If GBP/USD drops under the Jan low, we’ll likely see a decline to around 1.4812, where the Jul 2013 low is.
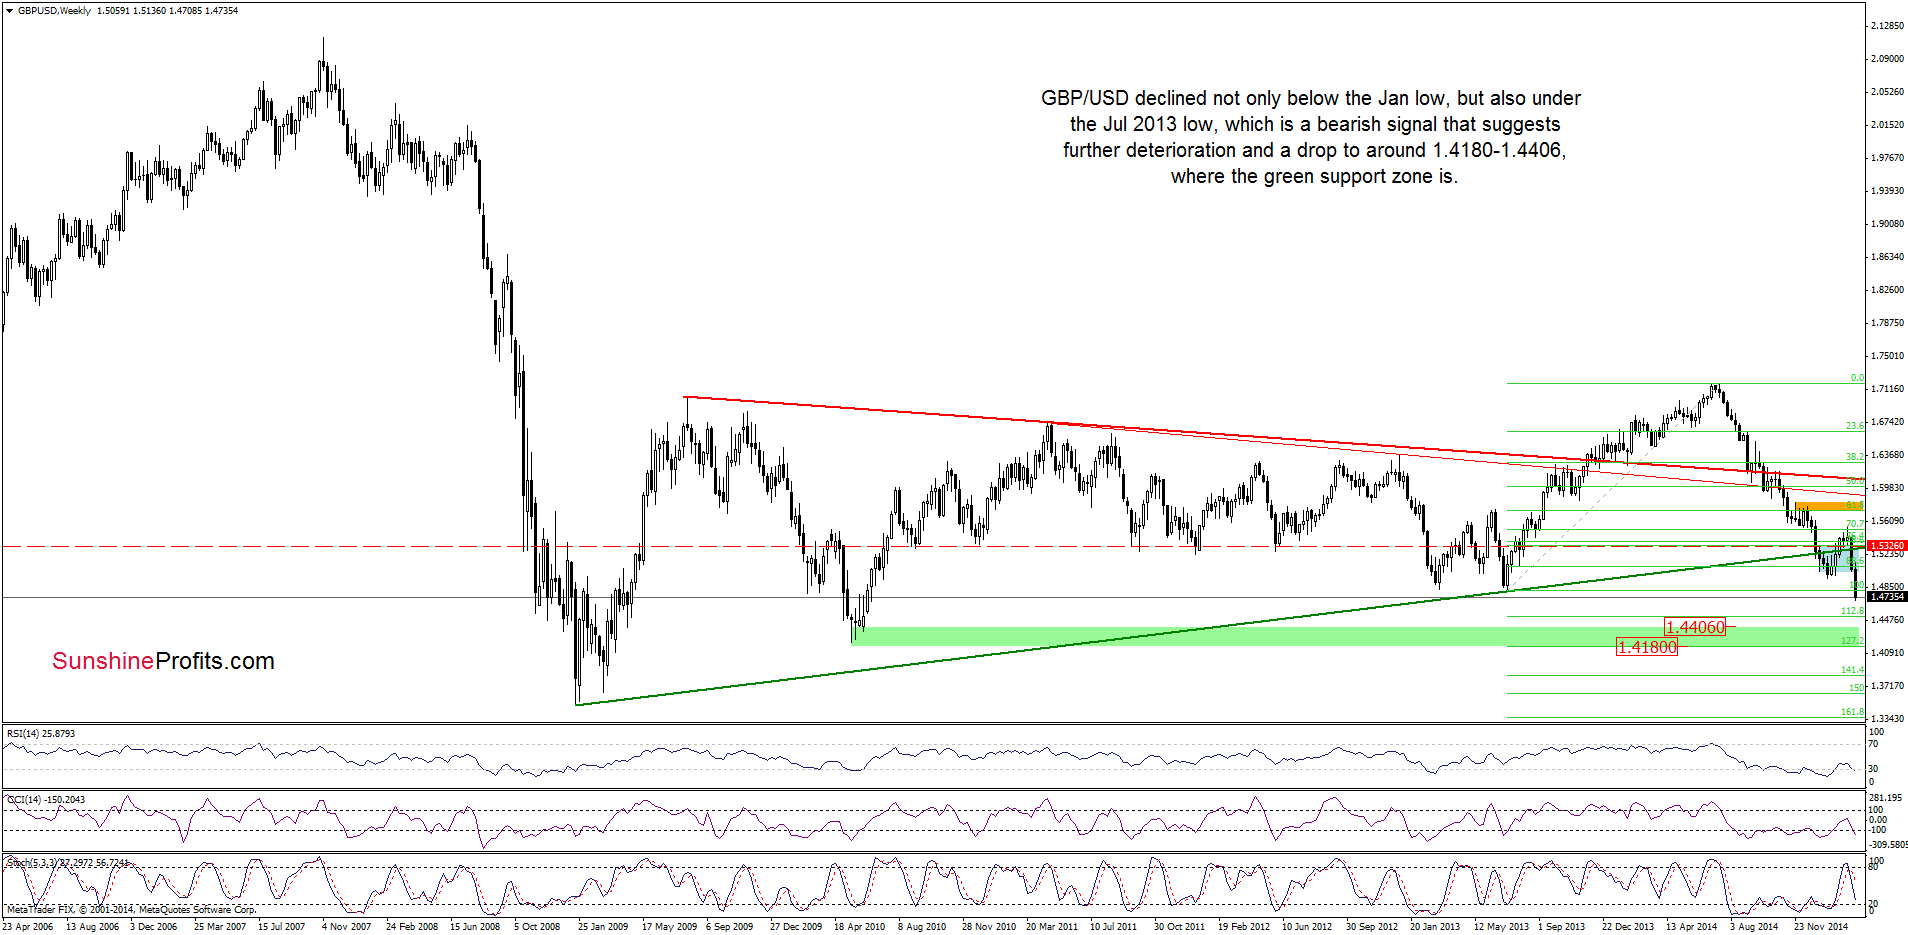
As you see on the daily chart, currency bears not only took the exchange rate to the above-mentioned downside target, but also managed to push the pair below it. With this downward move, GBP/USD almost touched the 141.4% Fibonacci extension (based on the Jan-Feb rally) and then rebounded slightly. Despite this move, the exchange rate still remains under the Jul 2013 low, which means that as long as there is no breakout below it, further improvement is questionable and another downswing is likely. If this is the case, and the pair moves lower once again, the initial downside target would be around 1.4649, where the 150% extension is. If this support is broken, we could see a decline to 1.4579 (161.8% extension). Nevertheless, taking into account the medium-term picture, it seems that GBP/USD could drop even to around 1.4180-1.4406, where the green support zone (marked on the weekly chart) created by the 2010 lows and the 127.2% Fibonacci extension (based on the entire 2013-2014 rally) is.
Very short-term outlook: mixed with bearish bias
Short-term outlook: mixed
MT outlook: mixed
LT outlook: mixed
Trading position (short-term; our opinion): No positions are justified from the risk/reward perspective at the moment. We will keep you informed should anything change, or should we see a confirmation/invalidation of the above.
USD/JPY
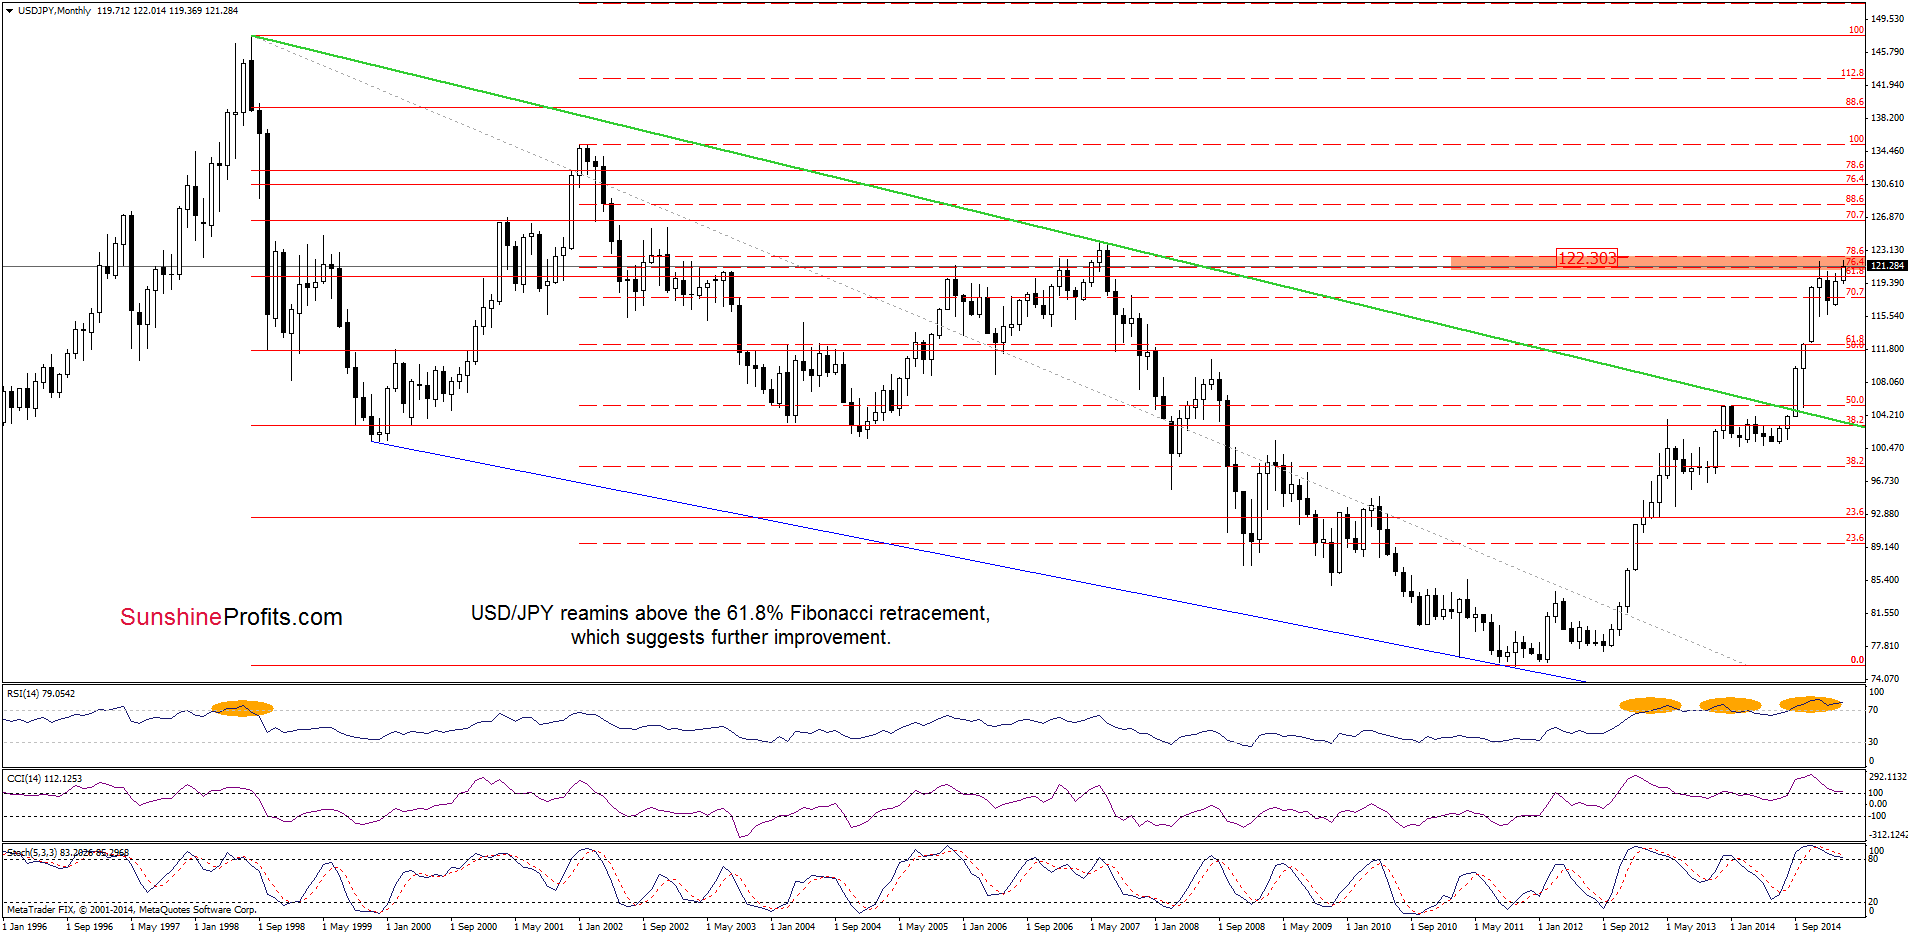
The situation in the medium term hasn’t changed much as a comeback above the 61.8% Fibonacci retracement level (based on the entire 1998-2011 declines), still supports currency bulls.
Having said that, let’s examine the daily chart.
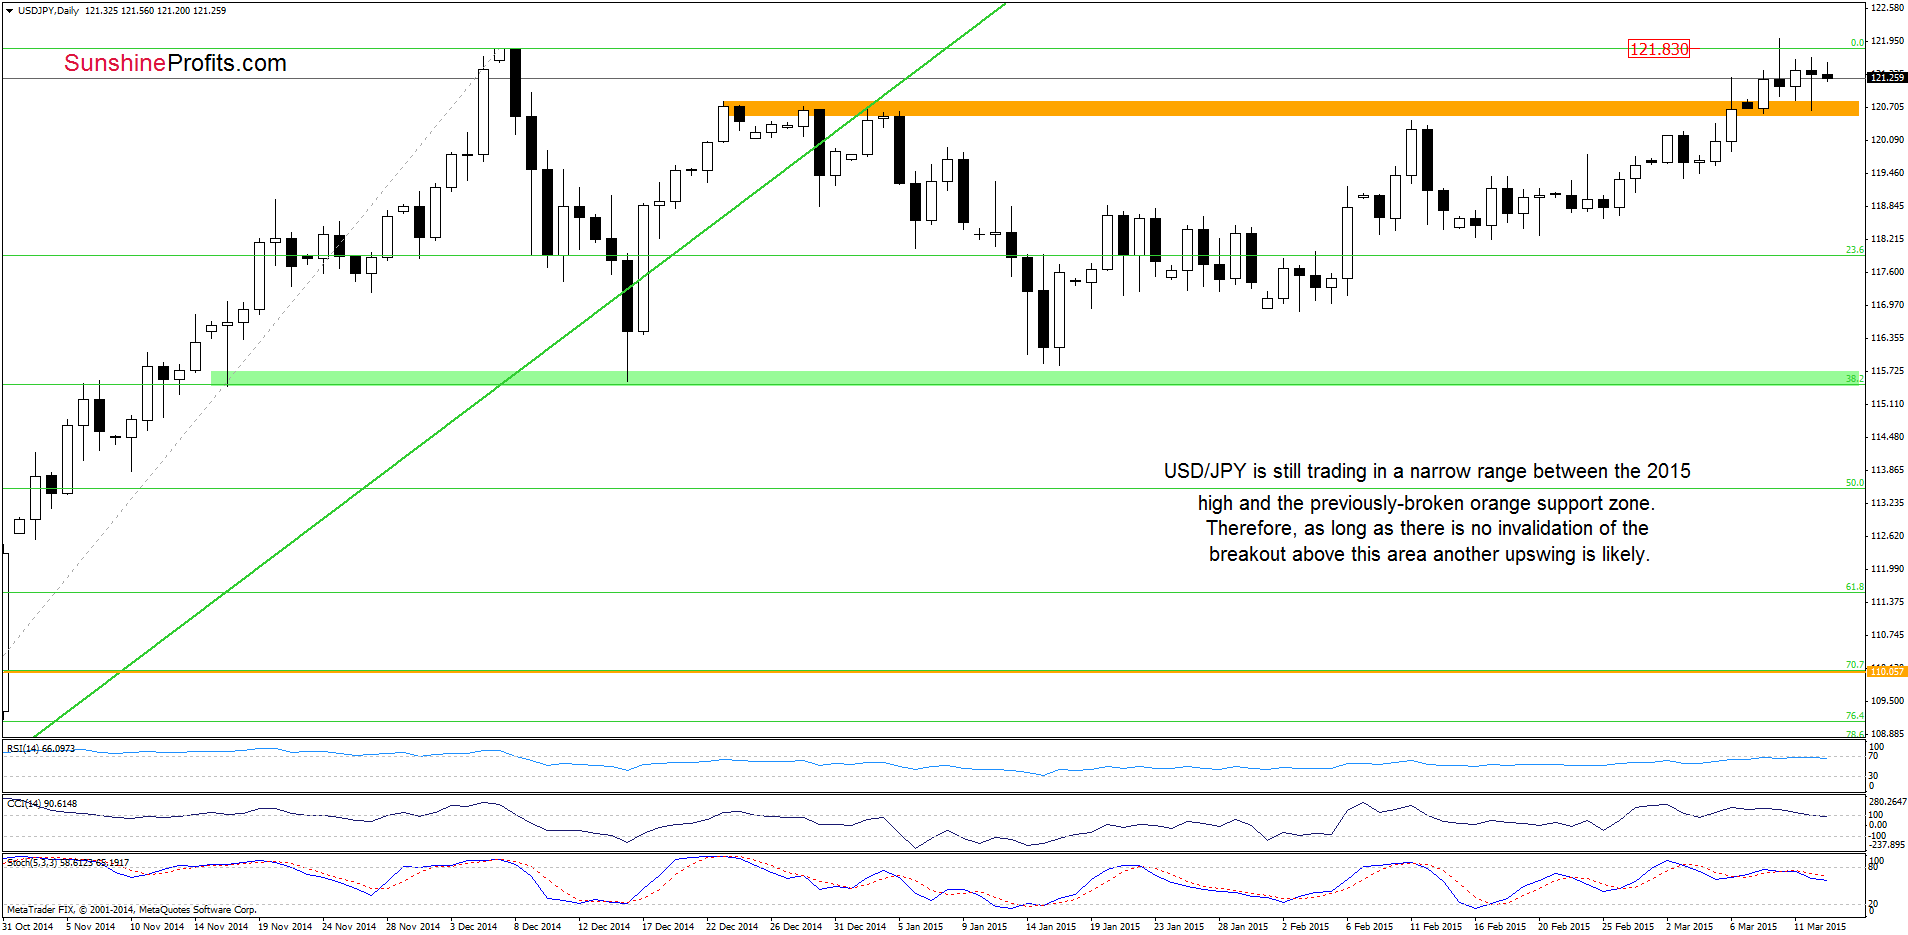
Looking at the daily chart, we see that USD/JPY is still trading in a narrow range between the 2015 high and the previously-broken orange support zone. Therefore, as long as there is no invalidation of the breakout above this area another upswing is likely. If this is the case, well se a test of the strength of the 78.6% Fibonacci retracement (around 122.30) in the coming days.
Nevertheless, we should keep in mind that sell signals generated by the indictors support the bearish case, suggesting that another test of the strength of the orange support zone is more likely than not.
Very short-term outlook: mixed
Short-term outlook: mixed
MT outlook: mixed
LT outlook: bullish
Trading position (short-term; our opinion): No positions are justified from the risk/reward perspective at the moment. We will keep you informed should anything change, or should we see a confirmation/invalidation of the above.
USD/CAD
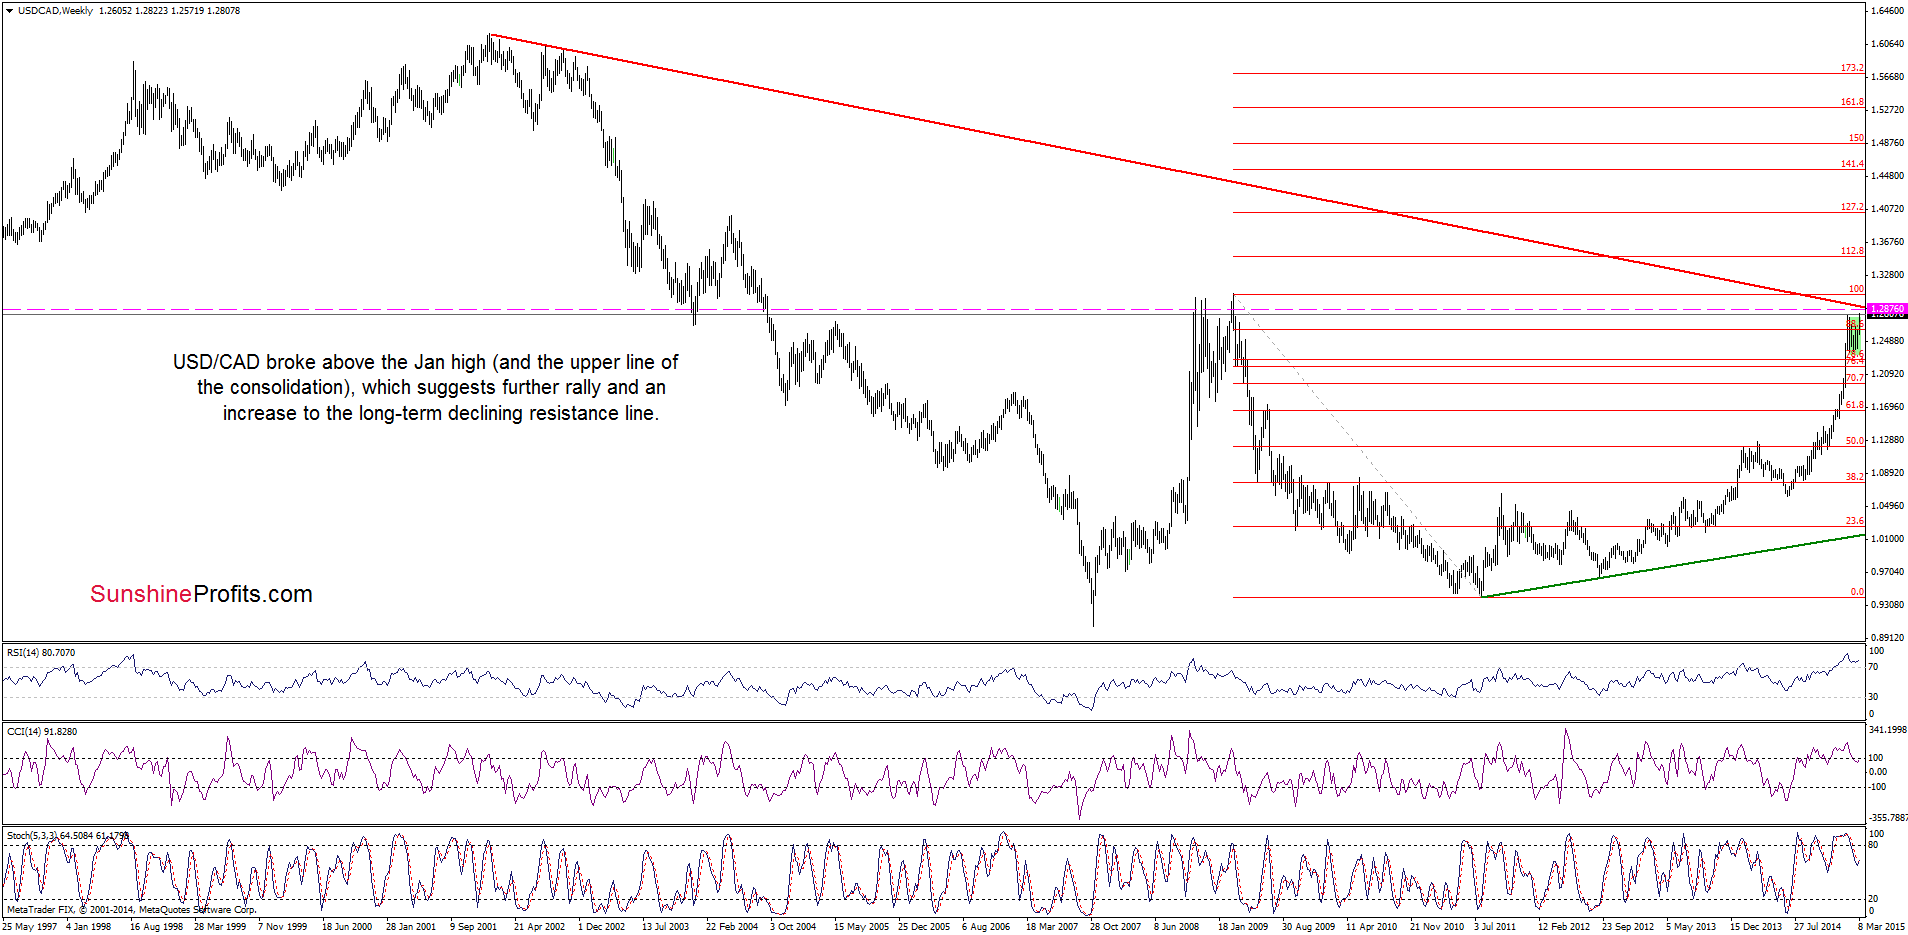
Looking at the above chart, we see that USD/CAD extended gains, which approached the pair to the long-term red declining resistance line (slightly above this line is also the 350% Fibonacci extension, which serves as resistance level). In the previous weeks, the proximity to this key resistance was enough to trigger a correction. Therefore, we think that as long as there is no breakout above this line, the probability of a reversal is high (especially when we factor in sell signals generated by the indicators).
Are there any short-term factors that could support or hinder the realization of the above scenario? Let’s check.
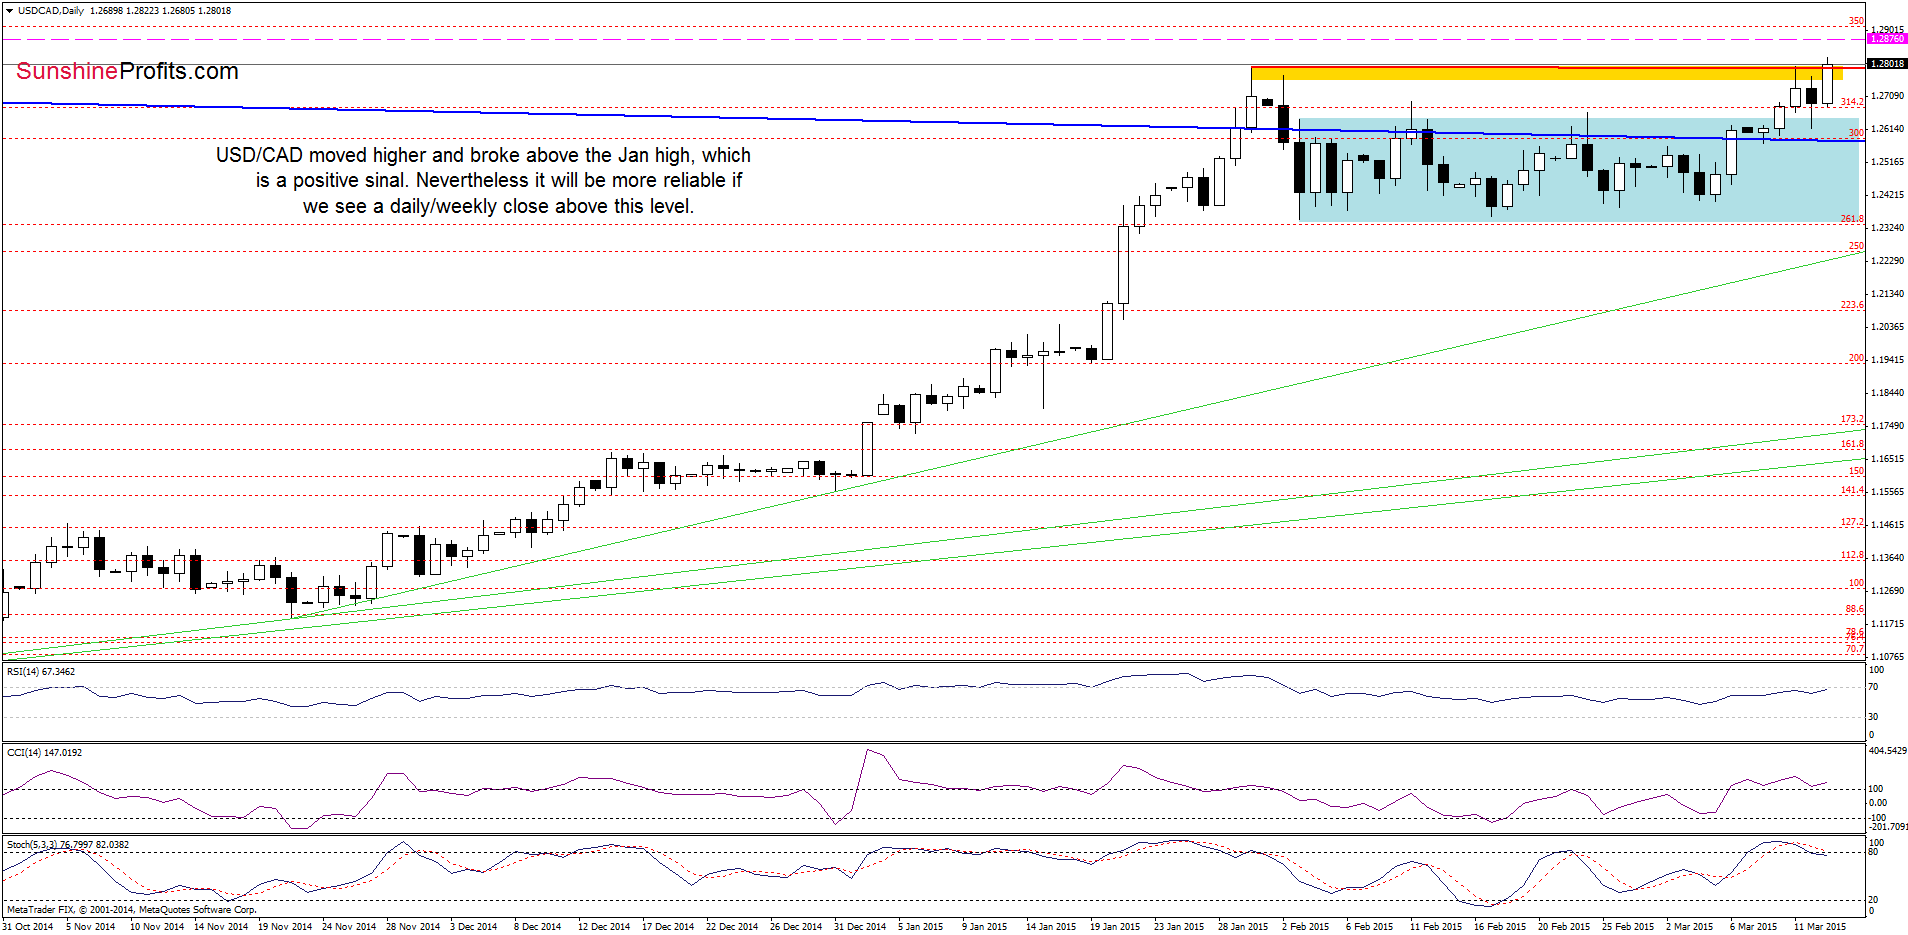
Earlier today, USD/CAD moved higher once again and broke above the Jan high, hitting a fresh 201 high. This is a positive signal, which suggests further improvement. Nevertheless, taking into account a sell signal generated by the Stochastic Oscillator, negative divergences between the RSI, CCI and the exchange rate and the medium-term picture, we think that this breakout will be more reliable if we see a daily and weekly close above the previous high.
Very short-term outlook: bearish
Short-term outlook: mixed with bearish bias
MT outlook: mixed
LT outlook: mixed
Trading position (short-term; our opinion): Short positions with a stop loss order at 1.2876 are justified from the risk/reward perspective. We will keep you informed should anything change, or should we see a confirmation/invalidation of the above.
USD/CHF
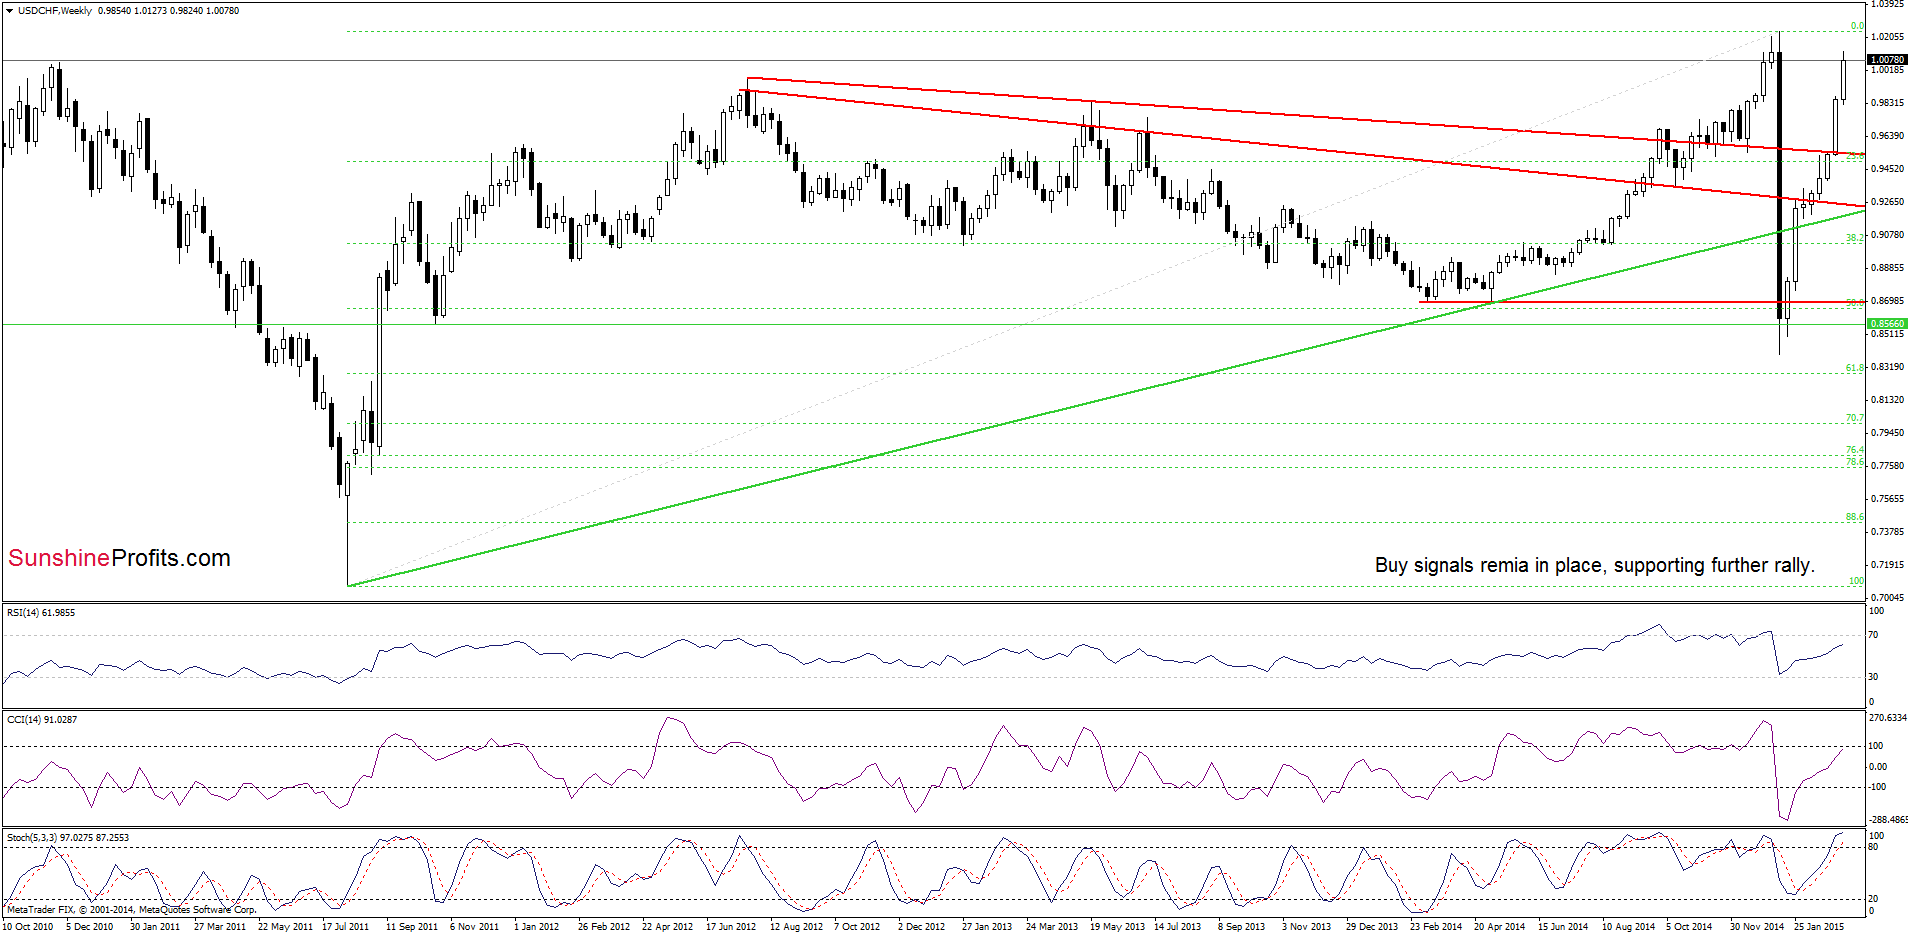
The medium-term picture remains bullish as USD/CHF extended gains and buy signals generated by the indicators are still in play, supporting further improvement.
How did this rally affect the daily chat? Let’s find out.
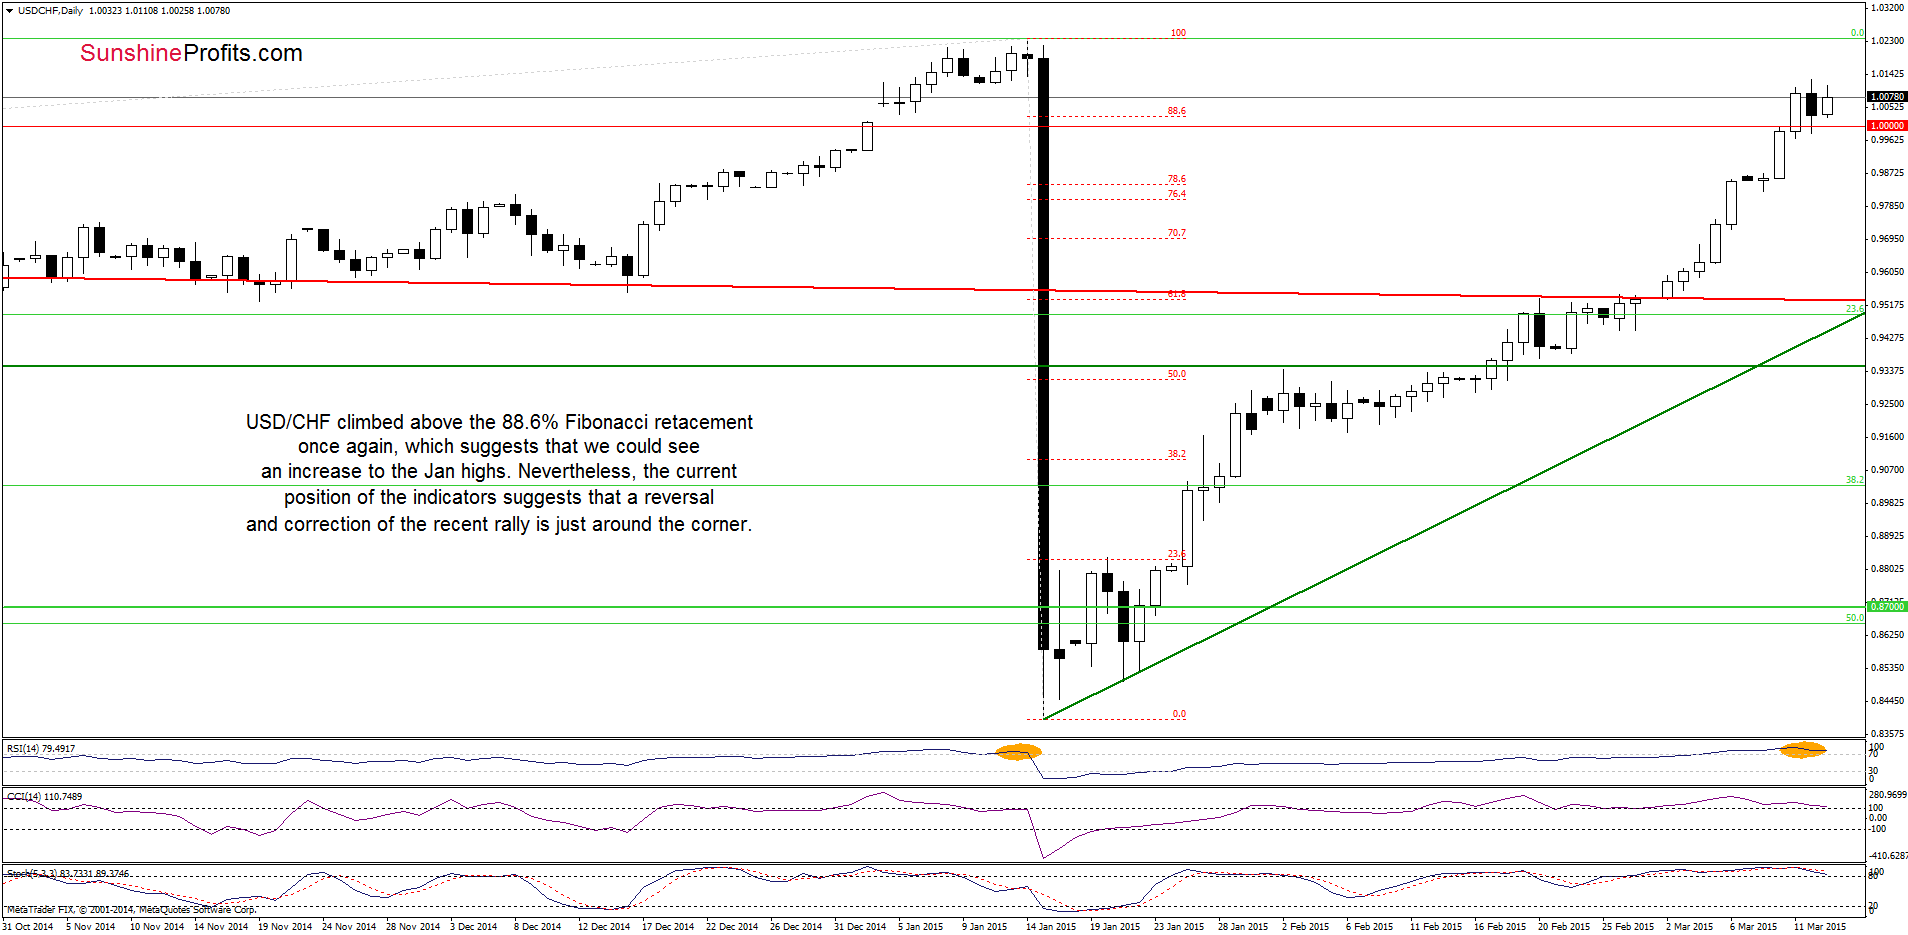
From today’s point of view, we see that USD/CHF moved higher once again and came back above the 88.6% Fibonacci retracement, which suggests that we could see further improvement and an increase to around the Jan highs.
Nevertheless, we should keep in mind what we wrote yesterday:
(…) when we take a closer look at the current position of the indicators, we see that the RSI remains above the level of 70, which is a negative sign. The reason? As you see on the daily chart, in Jan such high reading of the indicator preceded one of the sharpest declines in forex market. Taking this fact into account, and combining it with a sell signal generated by the Stochastic Oscillator (the CCI is very close to doing the same), it seems that a reversal and correction of the recent rally is just around the corner.
Very short-term outlook: mixed
Short-term outlook: mixed
MT outlook: mixed
LT outlook: bearish
Trading position (short-term; our opinion): No positions are justified from the risk/reward perspective at the moment. We will keep you informed should anything change, or should we see a confirmation/invalidation of the above.
AUD/USD
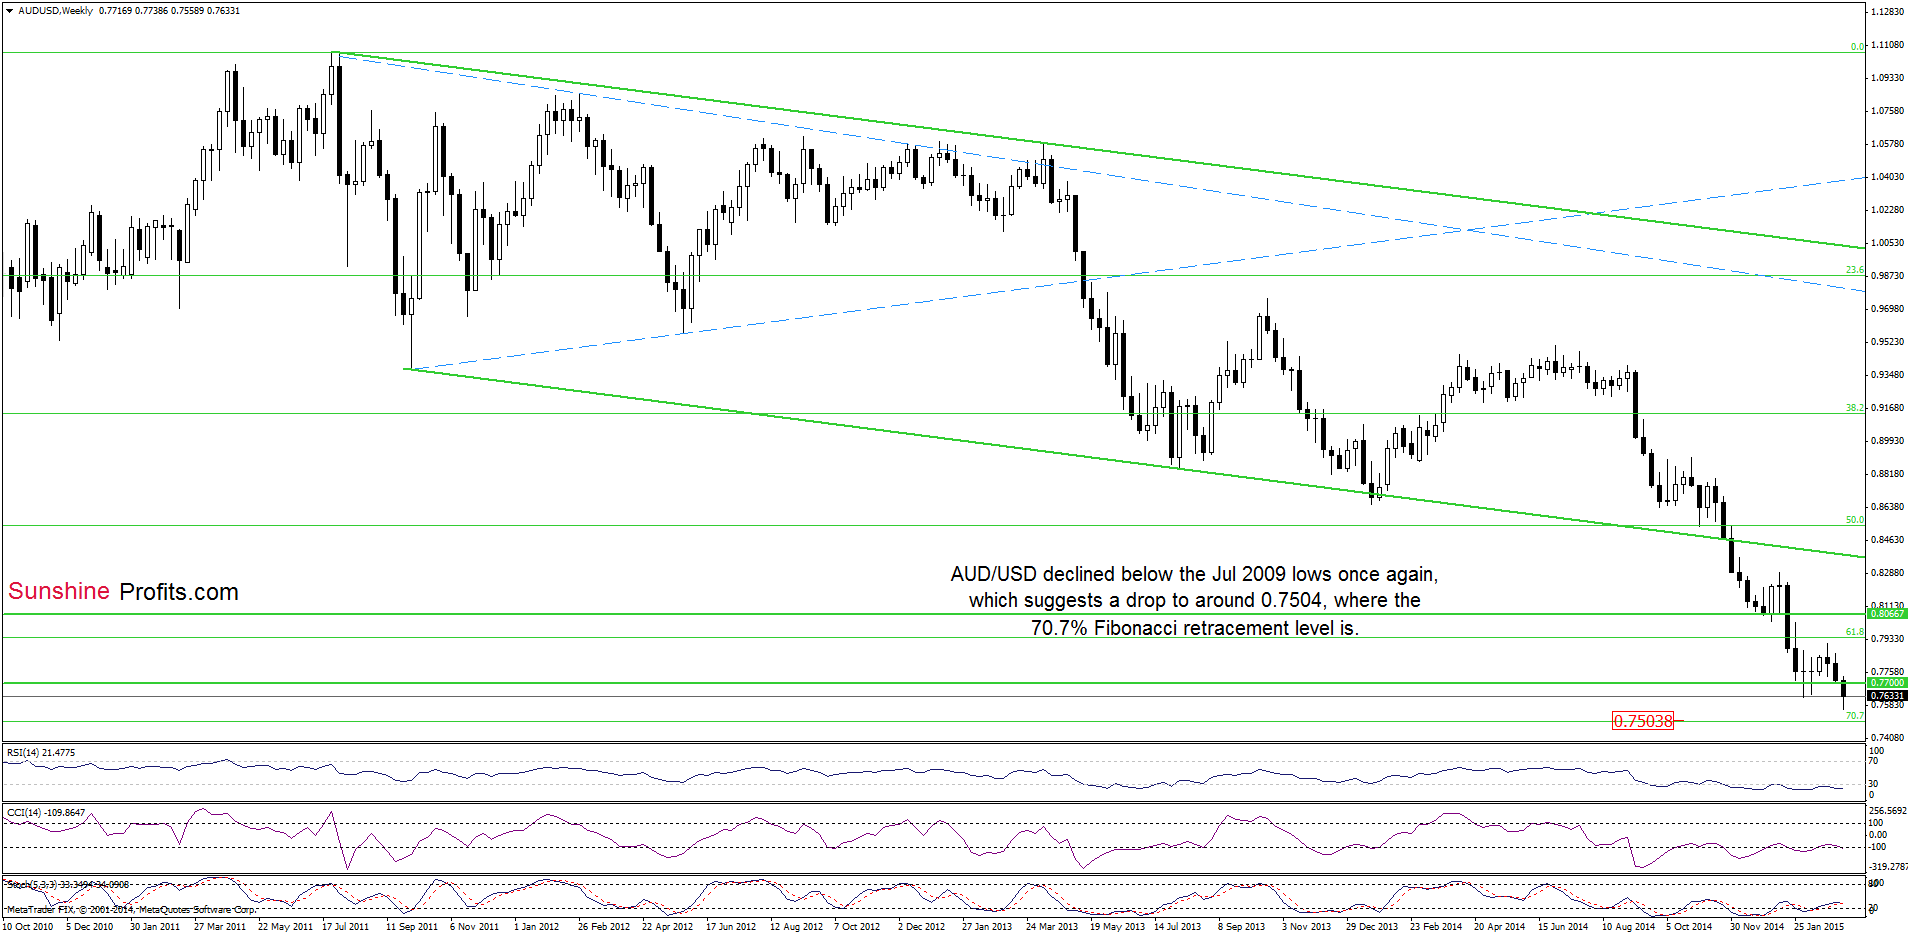
The situation in the medium term has deteriorated slightly as AUD/USD declined below the Jul 2009 lows once again. If the pair moves lower we could see a drop even to 0.7504, where the 70.7% Fibonacci retracement is.
Having said that, let’s focus on the very short-term changes.
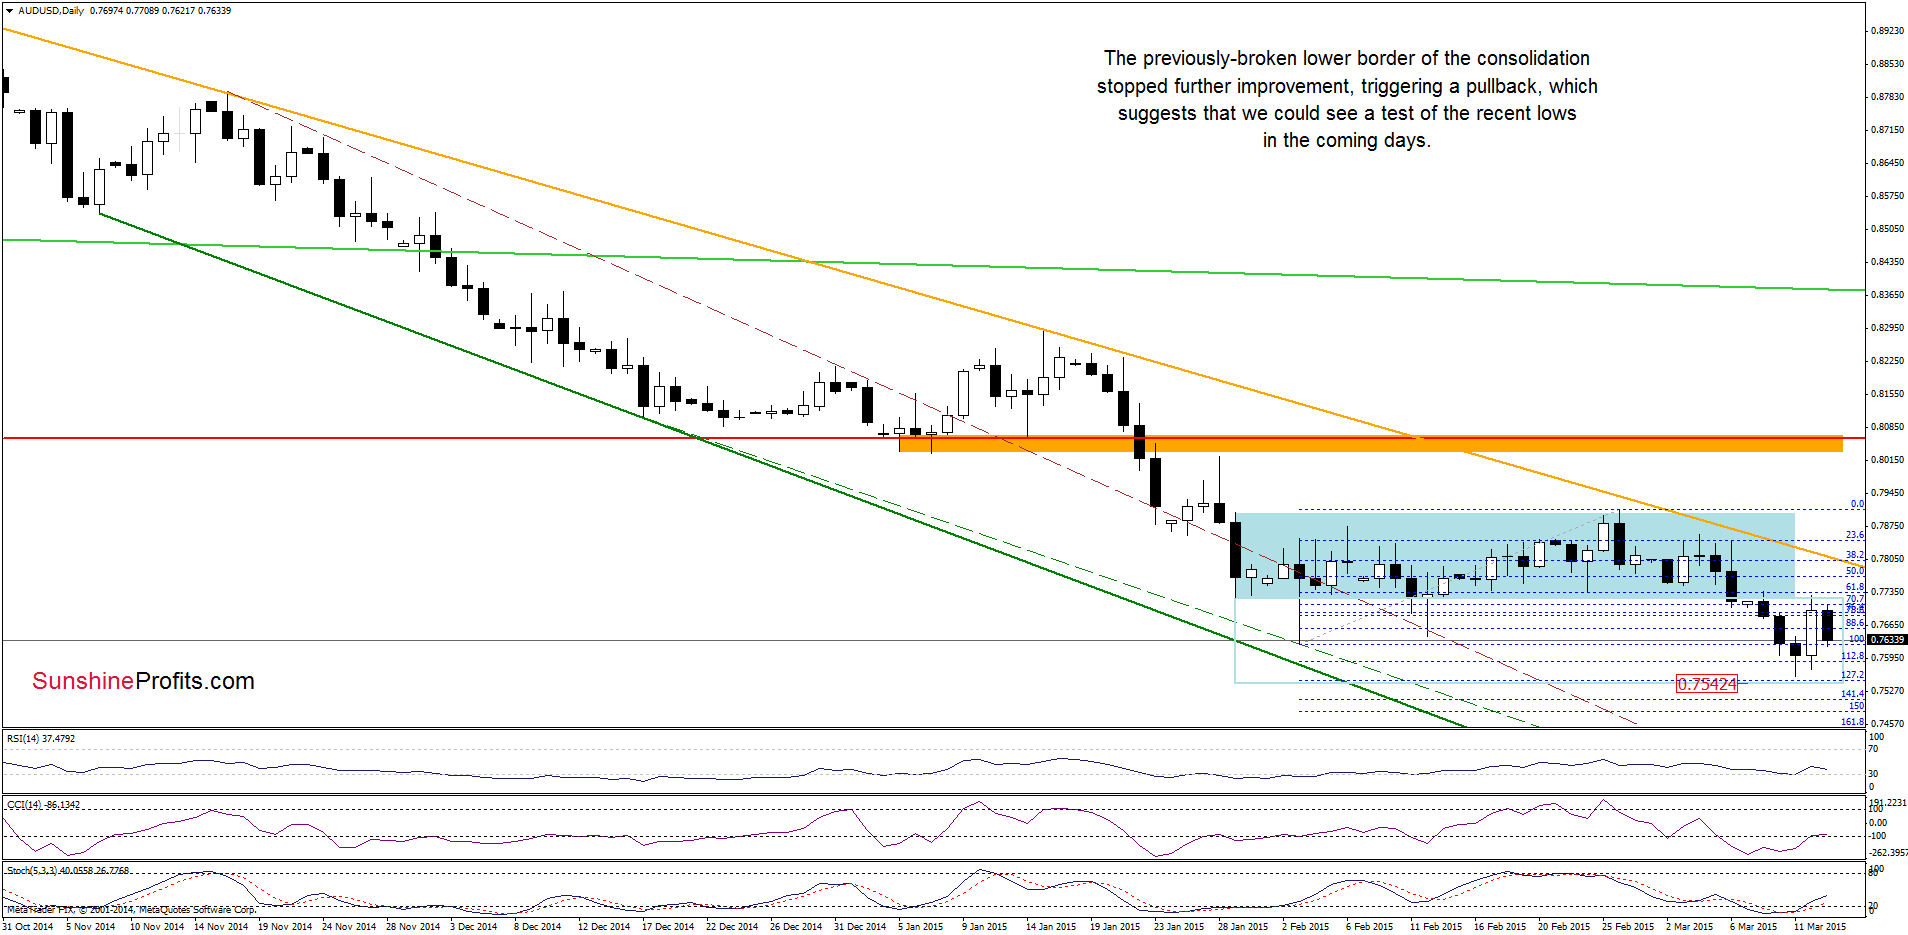
As you see on the daily chart, the previously-broken lower border of the consolidation stopped further improvement, triggering a pullback. This suggests that we could see a test of the recent lows in the coming days. A this point it’s worth noting that if the exchange rate breaks below them, the initial downside target for currency bears would be around 0.7542, where the 127.2% Fibonacci extension is.
Very short-term outlook: mixed
Short-term outlook: mixed
MT outlook: mixed
LT outlook: mixed
Trading position (short-term; our opinion): No positions are justified from the risk/reward perspective at the moment. We will keep you informed should anything change, or should we see a confirmation/invalidation of the above.
Thank you.
Nadia Simmons
Forex & Oil Trading Strategist
Przemyslaw Radomski, CFA
Founder, Editor-in-chief
Gold & Silver Trading Alerts
Forex Trading Alerts
Oil Investment Updates
Oil Trading Alerts

