
Yesterday’s rally in USD Index pushed EUR/USD below its Feb lows, while AUD/USD invalidated the breakout above the upper line of the consolidation. Will today’s data on fourth quarter growth, reports on pending home sales, business activity in the Chicago region and consumer sentiment give the greenback further support? Before we know the answer to this question let’s jump into the world of charts and find out what impact did yesterday’s U.S. dollar increase have on other major currency pairs.
In our opinion the following forex trading positions are justified - summary:
- EUR/USD: none
- GBP/USD: none
- USD/JPY: none
- USD/CAD: short (stop loss order at 1.2876)
- USD/CHF: none
- AUD/USD: none
EUR/USD
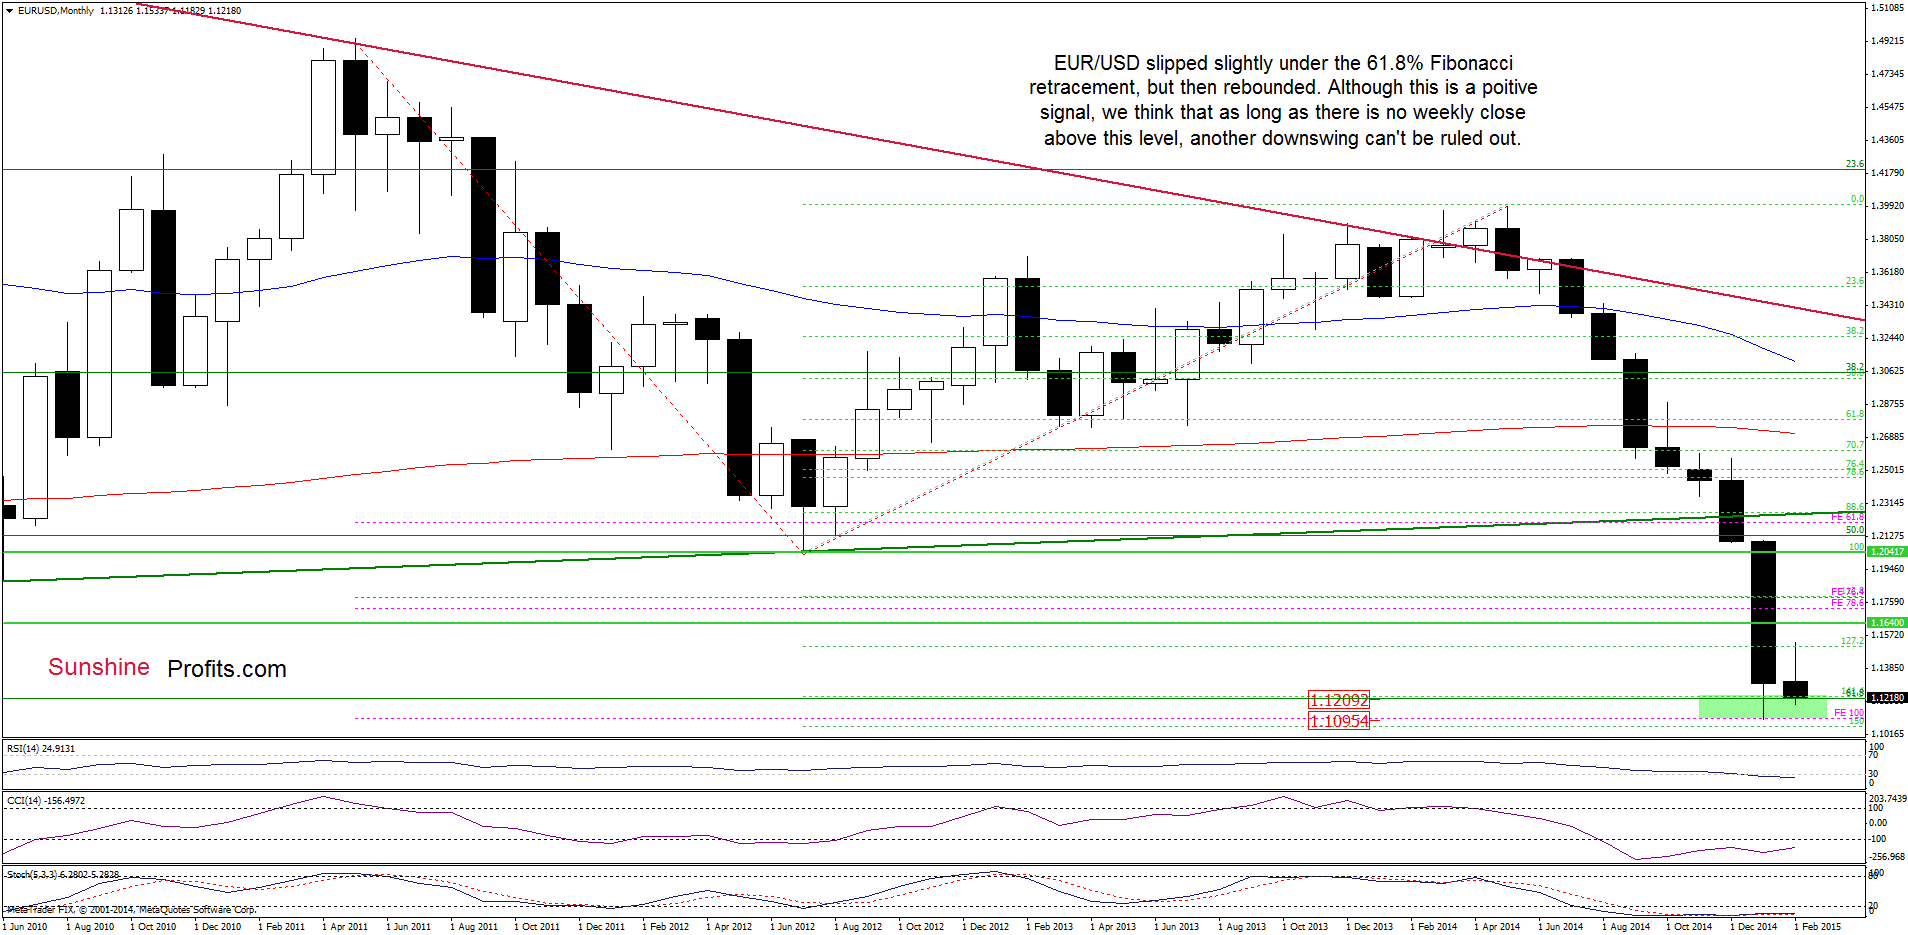
The situation in the medium term has deteriorated as EUR/USD extended losses and slipped slightly below the 61.8% Fibonacci retracement (based on the entire 2000-2008 rally). Although the exchange rate rebounded slightly, this move is barely visible from this perspective, which means that the key factor, which could affect future moves will be today’s closing price.
Having said that, let’s focus on the very short-term picture.
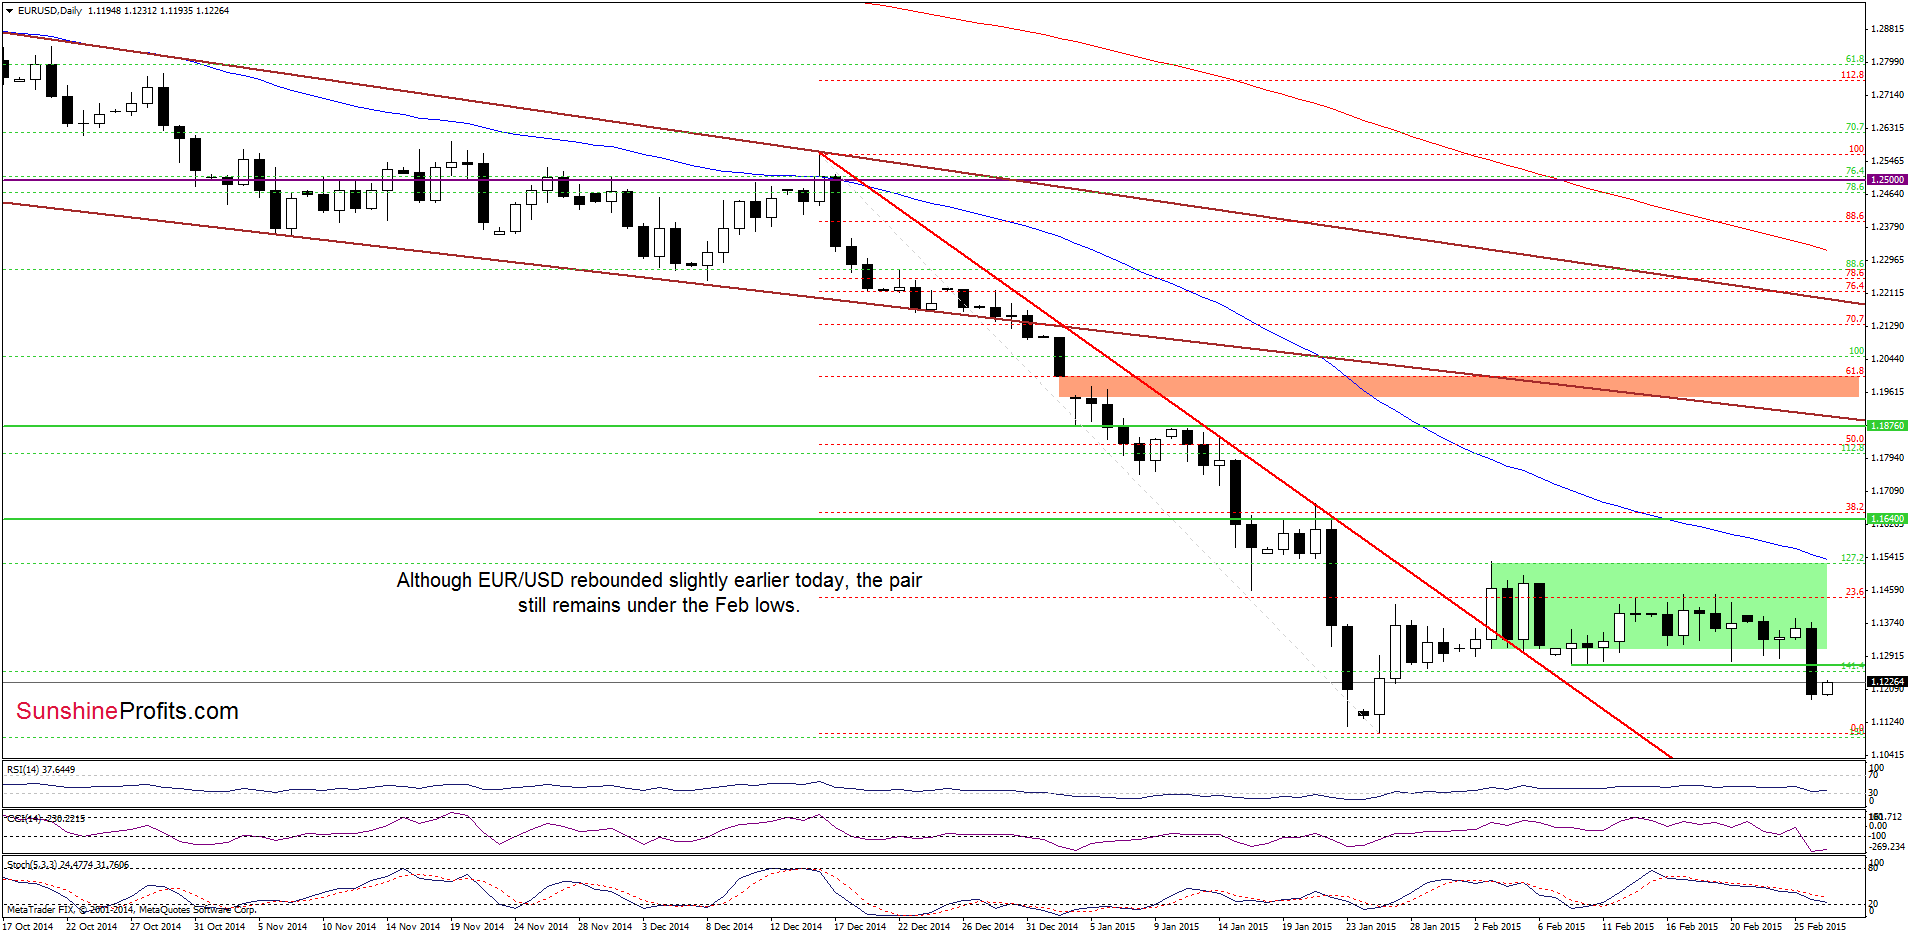
On the above chart, we see that although EUR/USD rebounded slightly earlier today, the pair still remains under the previously-broken support/resistance zone created by the Feb lows. What does it mean for the exchange rate? If currency bulls manage to invalidate yesterday’s breakdown, it would be a bullish signal, which will trigger further improvement and a comeback to the green consolidation range. On the other hand, if this area withstands the buying pressure, EUR/USD will reverse and test the above-mentioned 61.8% Fibonacci retracement (based on the entire 2000-2008 rally) once again. Which scenario is more likely? The current position of the indicators suggests that a reversal is just around the corner. Nevertheless, as long as there is no daily closing price speculation about further moves are premature.
Very short-term outlook: mixed
Short-term outlook: mixed
MT outlook: mixed
LT outlook: mixed
Trading position (short-term; our opinion): No positions are justified from the risk/reward perspective at the moment. We will keep you informed should anything change, or should we see a confirmation/invalidation of the above.
GBP/USD
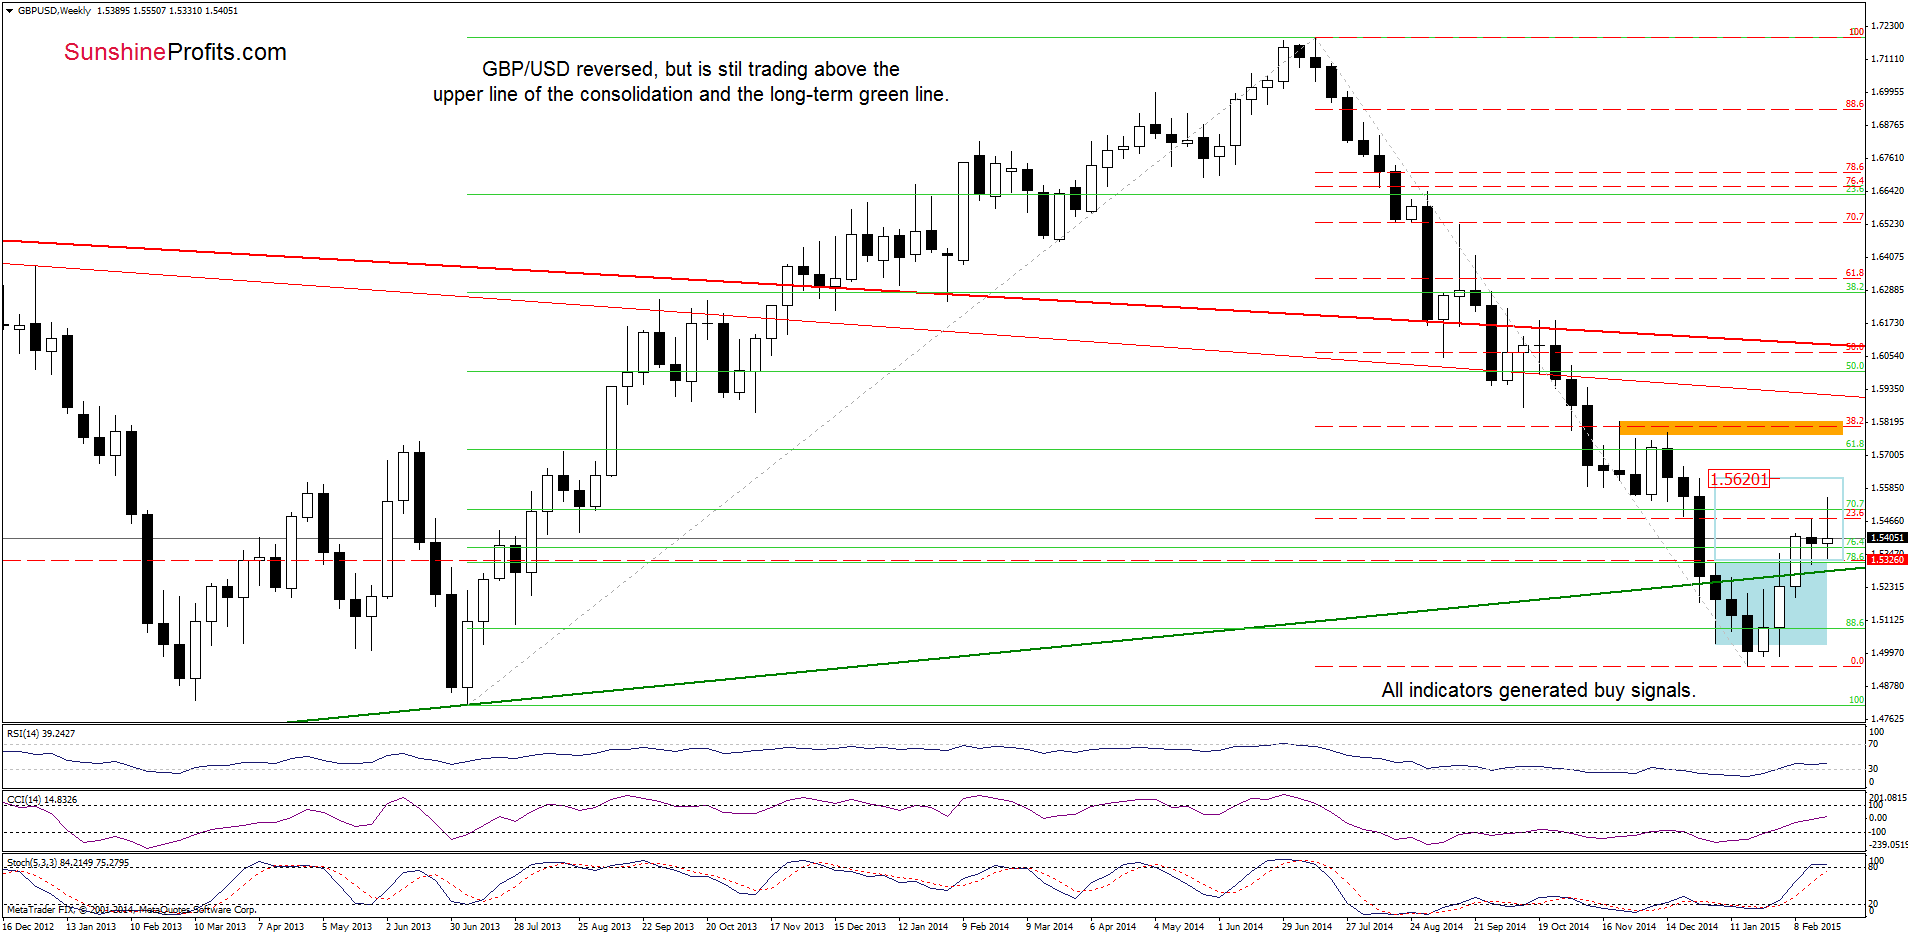
The medium-term picture hasn’t changed much as GBP/USD still remains above the previously-broken upper border of the consolidation and the long-term green support line, which serve as the major support at the moment.
Will the daily chart give us an answer to the question where the pair head next? Let’s find out.
Yesterday, we wrote the following:
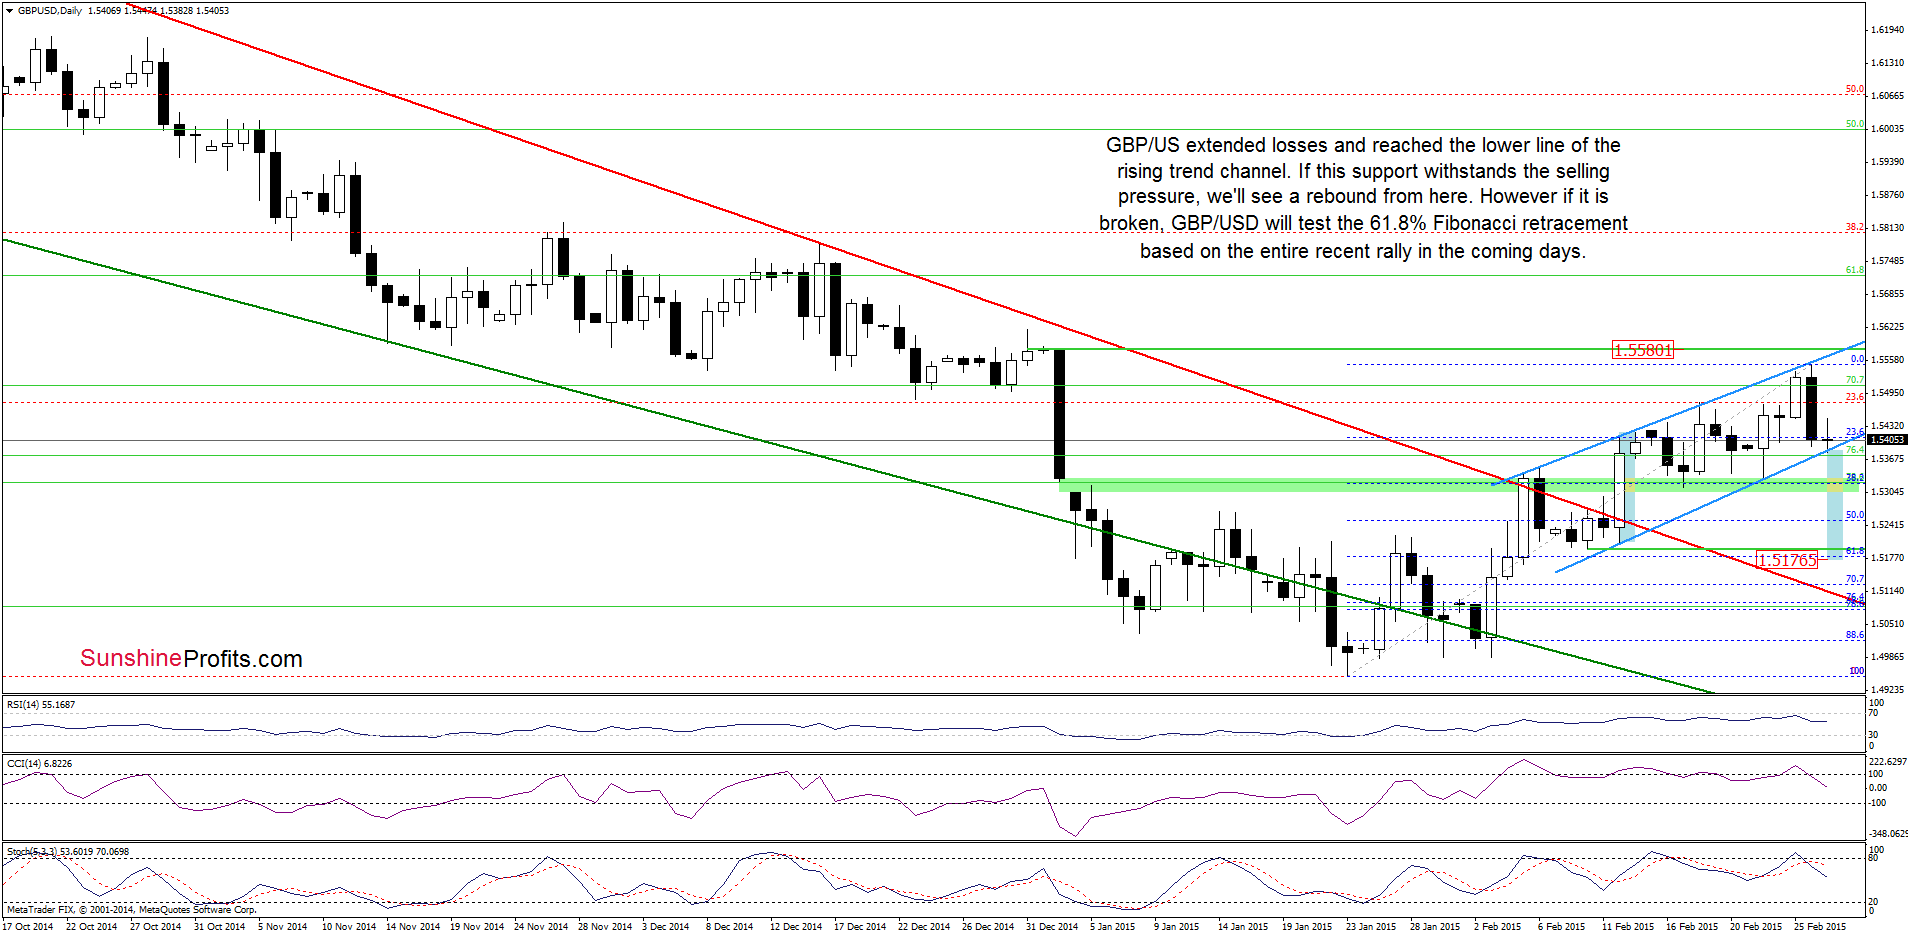
(…) the exchange moved sharply lower after an approach the upper line of the rising trend channel. With this downswing, GBP/USD dropped under yesterday’s low, which in combination with the current position of the indicators (they all generated sell signals) suggests further deterioration and a decline to the lower border of the trend channel (currently around 1.5372) in the coming day(s).
Looking at the daily chart, we see that the situation developed in line with the above-mentioned scenario and GBP/USD reached our downside target earlier today. What’s next? If this support line withstood the selling pressure, we’ll se a rebound from here and the upside target would be the upper line of the formation. On the other hand, if currency bulls fail, the exchange rate might drop even to around 1.5176-1.5195, where the Feb 10 and the 61.8% Fibonacci retracement (based on the entire recent rally) is. Will we see further deterioration? Taking into account the current position of the indicators, the bearish scenario is more likely at the moment. Nevertheless, it seems to us that we’ll see such low values of the exchange rate only if currency bears break below the medium-term support area around 1.5268-1.5318.
Very short-term outlook: mixed
Short-term outlook: mixed
MT outlook: mixed
LT outlook: mixed
Trading position (short-term; our opinion): No positions are justified from the risk/reward perspective at the moment. We will keep you informed should anything change, or should we see a confirmation/invalidation of the above.
USD/JPY
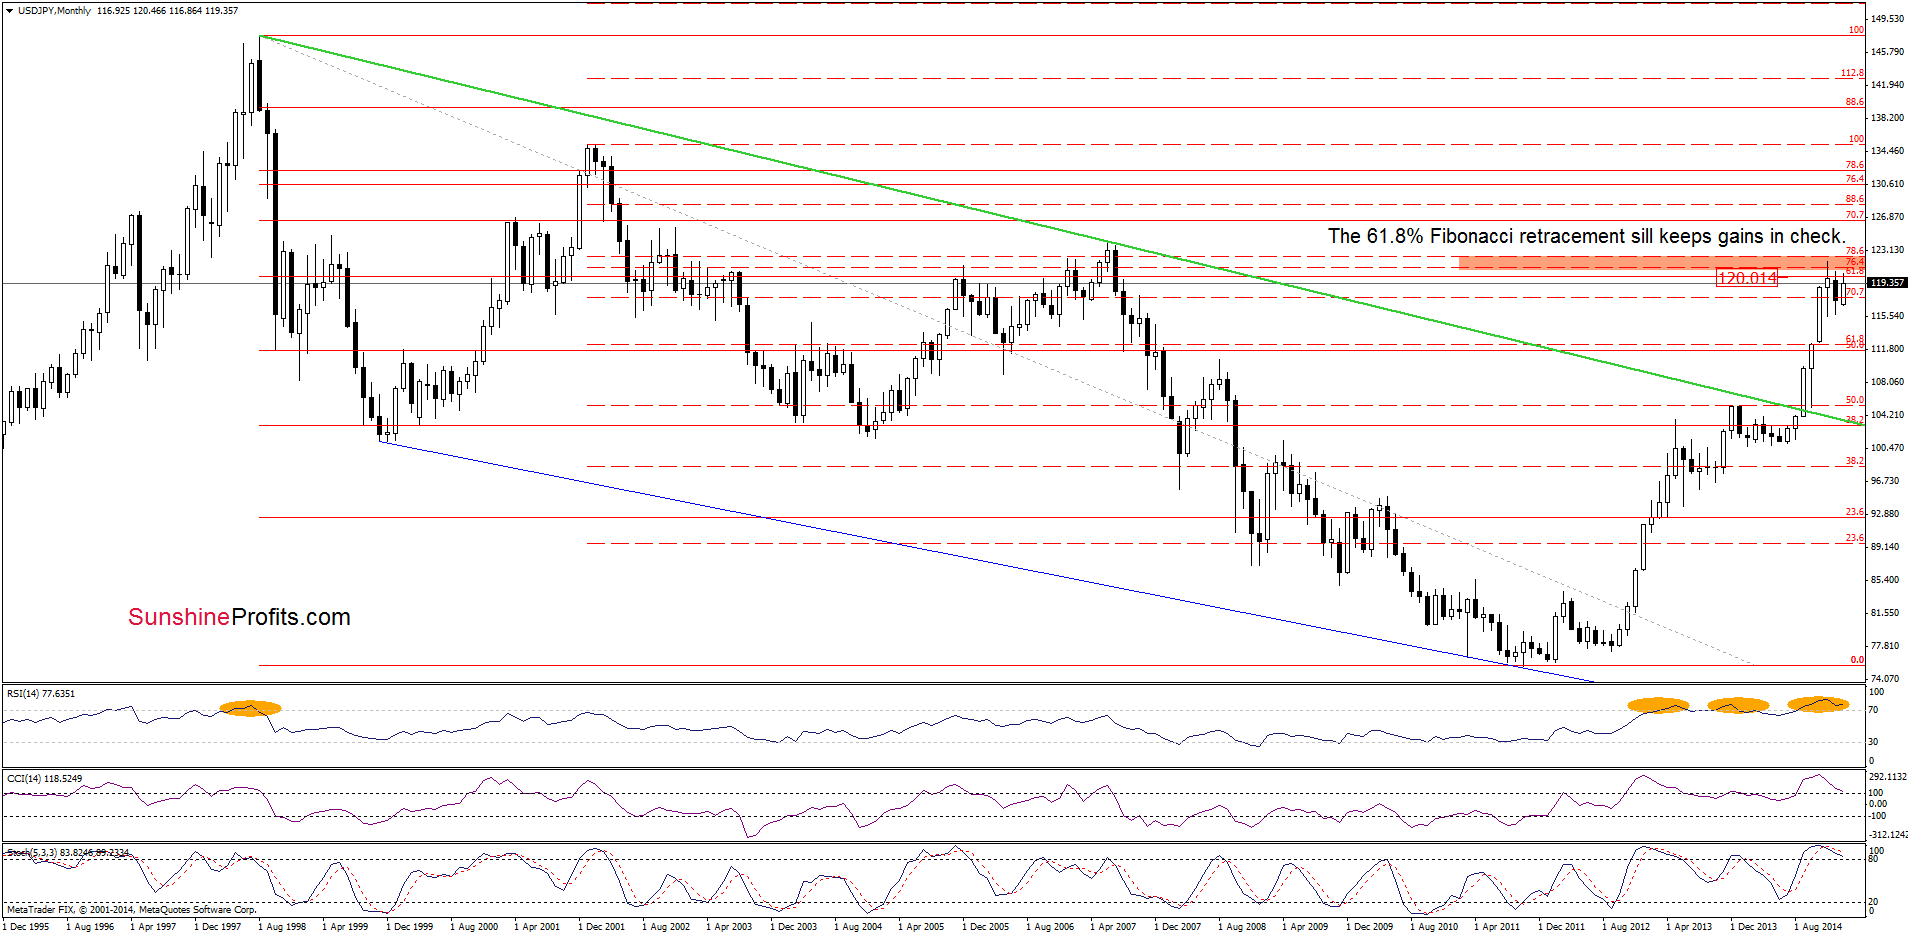
The situation in the medium term hasn’t changed much as the exchange rate still remains under the 61.8% Fibonacci retracement level based on the entire 1998-2011 declines.
Did the very short-trm picture change in the recent days?
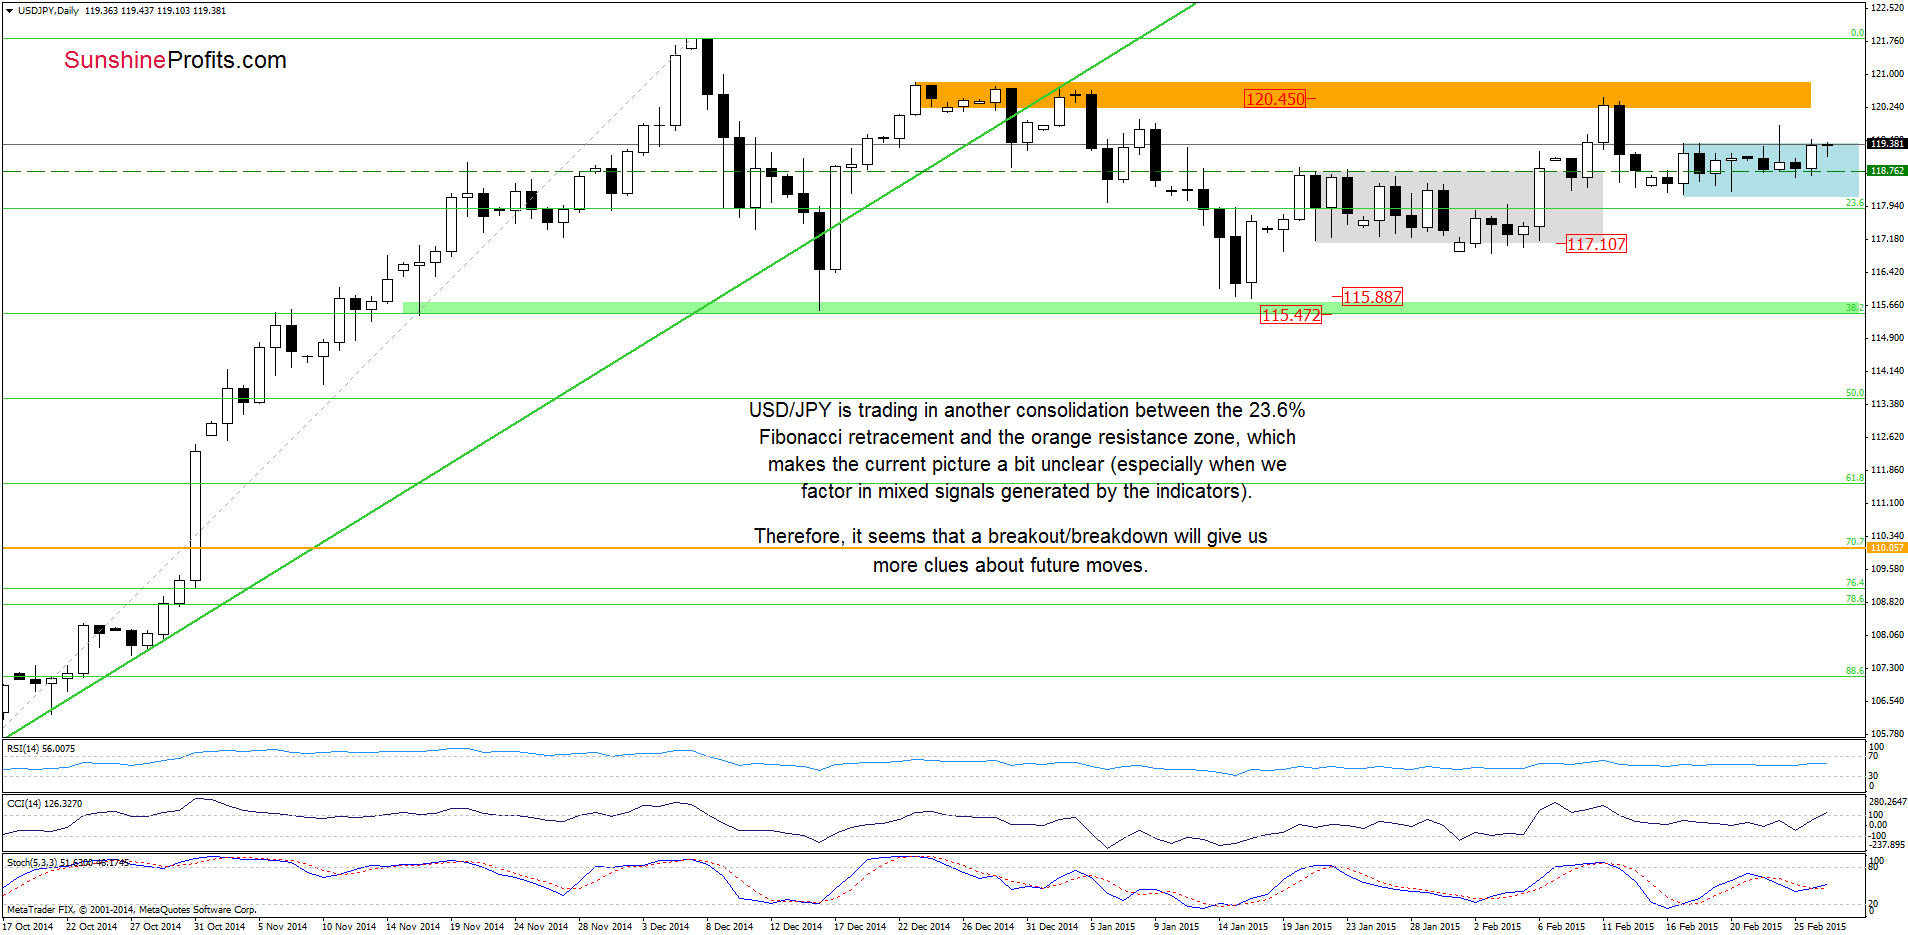
Not really. As you see on the daily chart, although USD/JPY moved little higher, the pair is still trading in a narrow range between the 23.6% Fibonacci retracement and the orange resistance zone (reinforced by the above-mentioned 61.8% Fibonacci retracement). Therefore, what we wrote on Tuesday is up-to-date:
(…) This makes the very short-term situation a bit unclear – especially when we factor in mixed signals generated by the indicators. Therefore, it seems to us that a breakout/breakdown will give us more clues about future moves and indicate the direction of the next bigger move. Until this time, waiting on the sidelines for a profitable opportunity is the best choice.
Very short-term outlook: mixed
Short-term outlook: mixed
MT outlook: mixed
LT outlook: bullish
Trading position (short-term; our opinion): No positions are justified from the risk/reward perspective at the moment. We will keep you informed should anything change, or should we see a confirmation/invalidation of the above.
USD/CAD
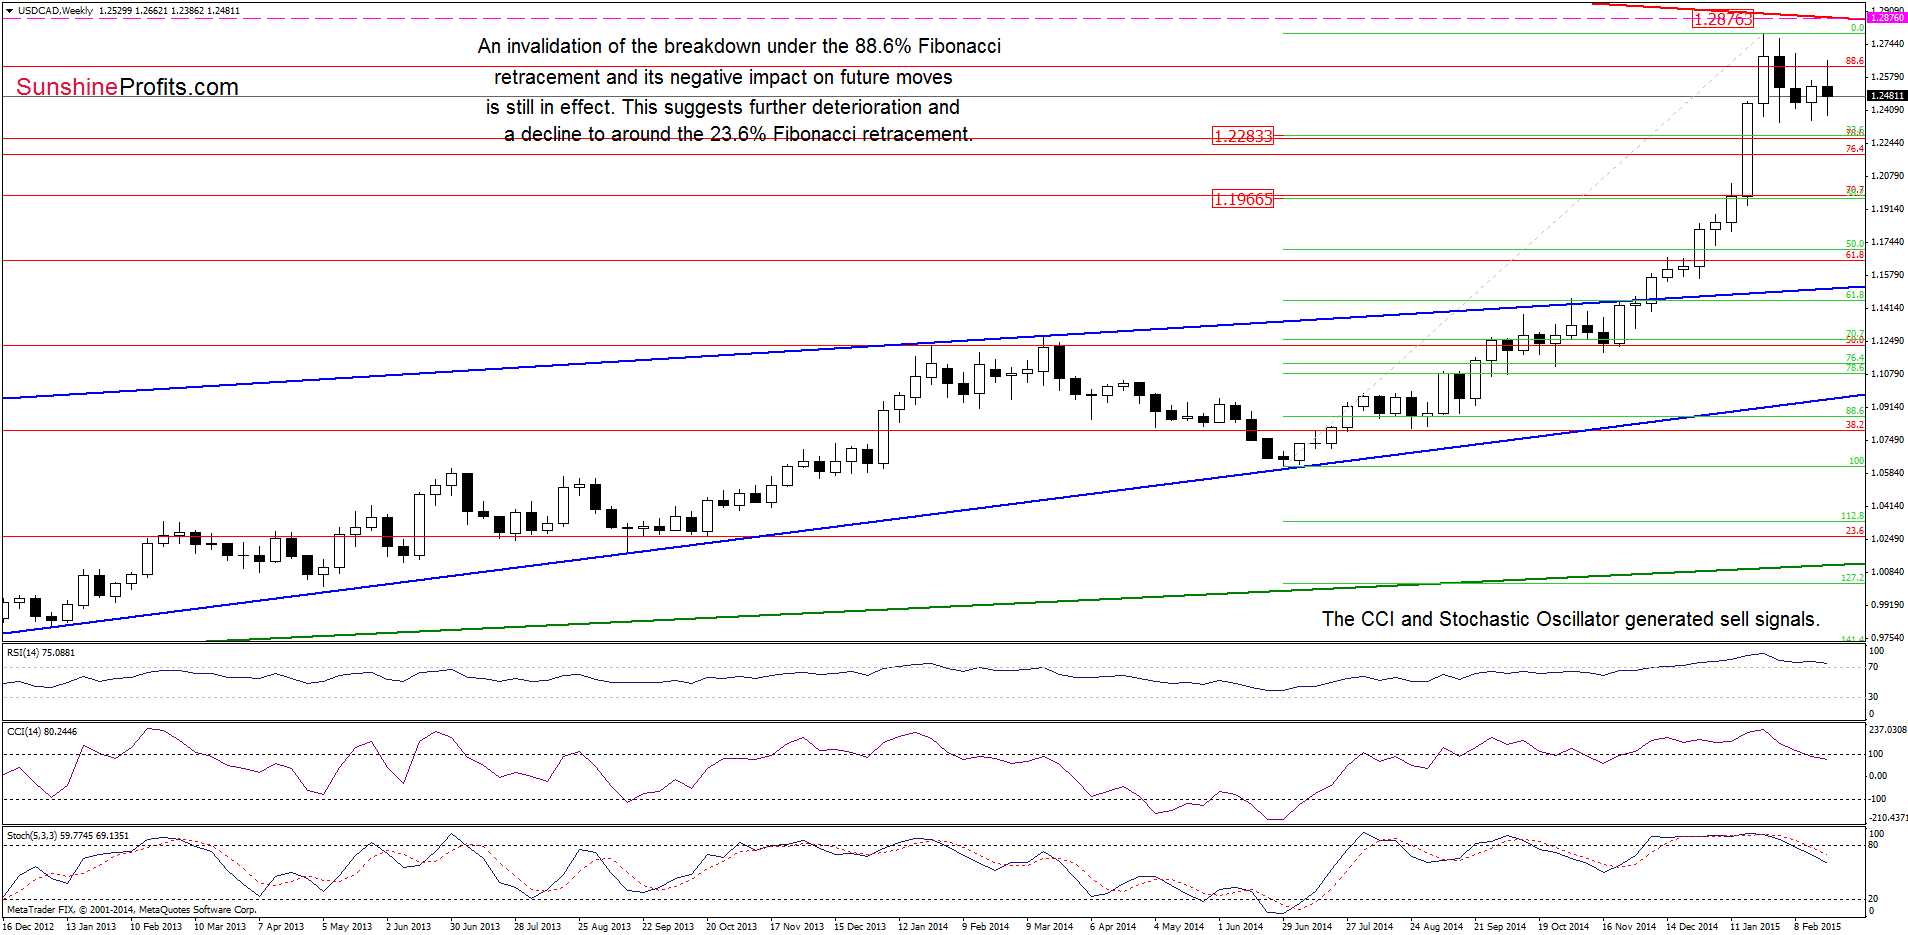
The situation in the medium-term hasn’t changed much as the invalidation of the breakout above the 88.6% Fibonacci retracement and its negative impact on future moves is still in effect. Taking this fact into account, we believe that further deterioration is just around the corner. If this is the case, the initial downside target would be the 23.6% Fibonacci retracement based on the entire Jun-Jan rally (around 1.2275). If it is broken, we’ll see a decline to the 38.2% retracement (at 1.1973) in the coming week. Additionally, sell signals generated by the CCI and Stochastic Oscillator are still in play, supporting the bearish case.
Having said that, let’s check the daily chart.
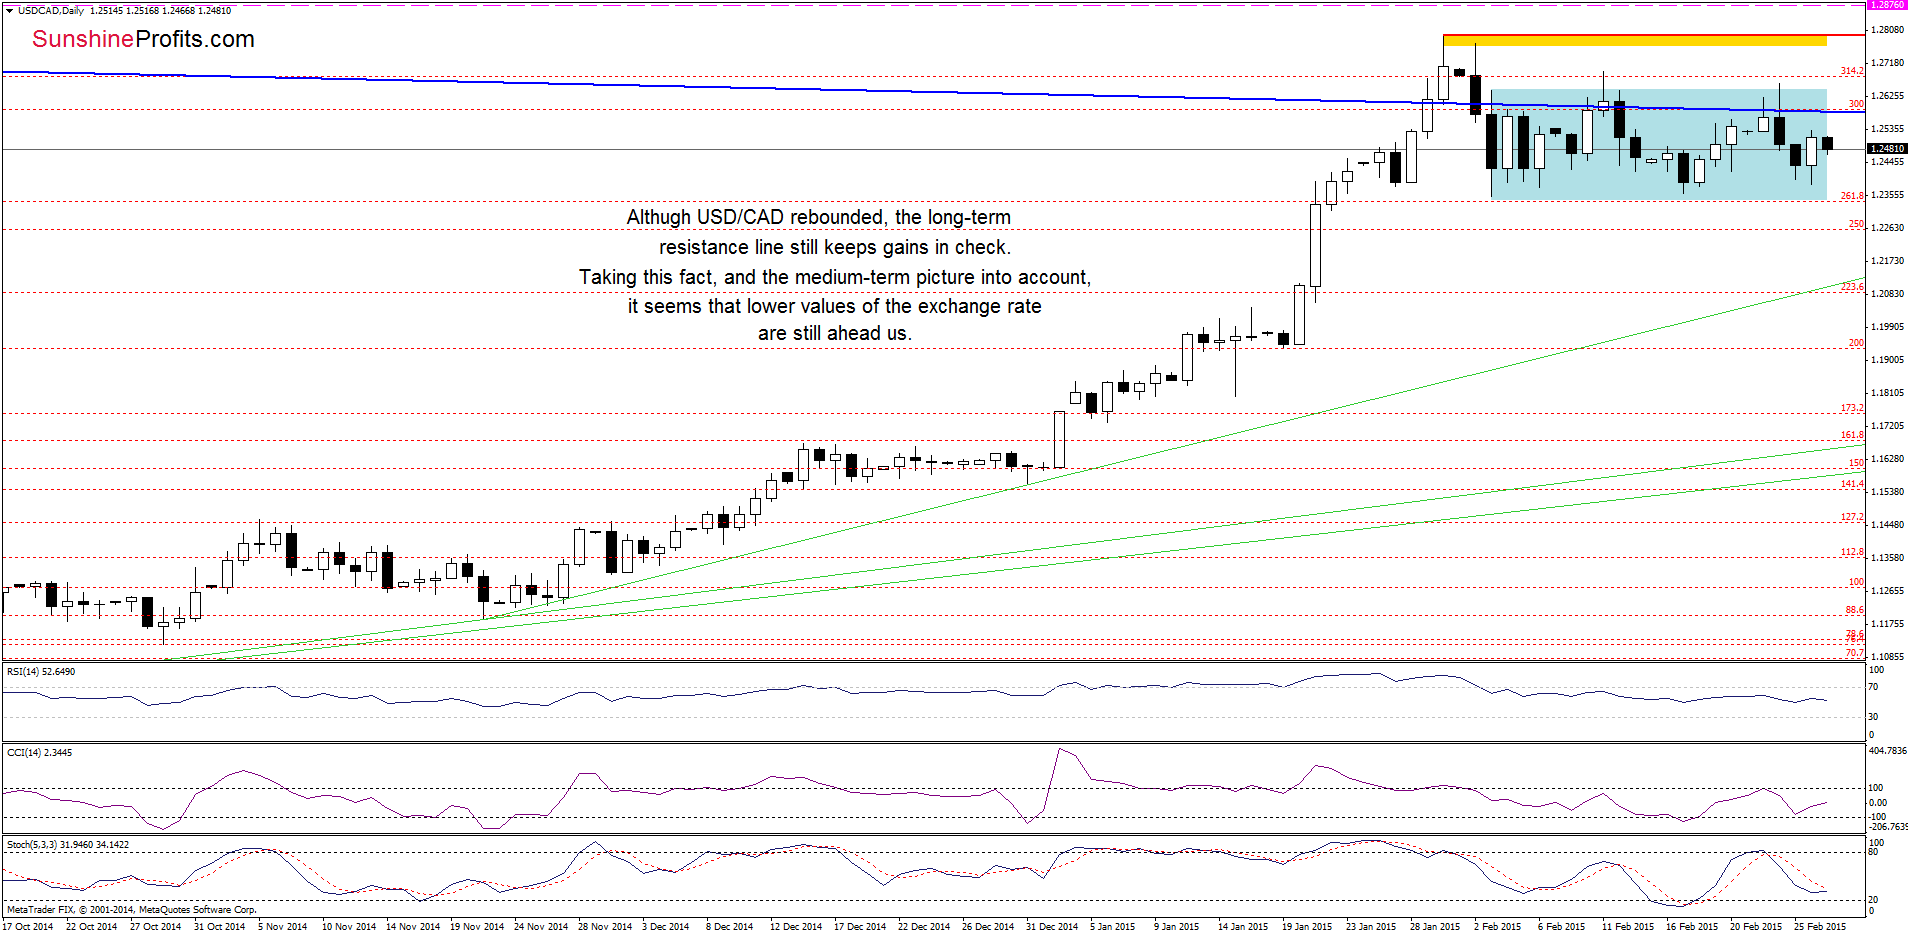
Yesterday, USD/CAD rebounded, but this upswing didn’t change anything as the previously-broken long-term blue resistance line still keeps gains in check. Therefore, we think that the next move will be to the downside and the initial downside target would be around 1.2351-1.2361, where the bottoms of the previous pullbacks are.
Very short-term outlook: bearish
Short-term outlook: mixed with bearish bias
MT outlook: mixed
LT outlook: mixed
Trading position (short-term; our opinion): Short positions with a stop loss order at 1.2876 are still justified from the risk/reward perspective. We will keep you informed should anything change, or should we see a confirmation/invalidation of the above.
USD/CHF
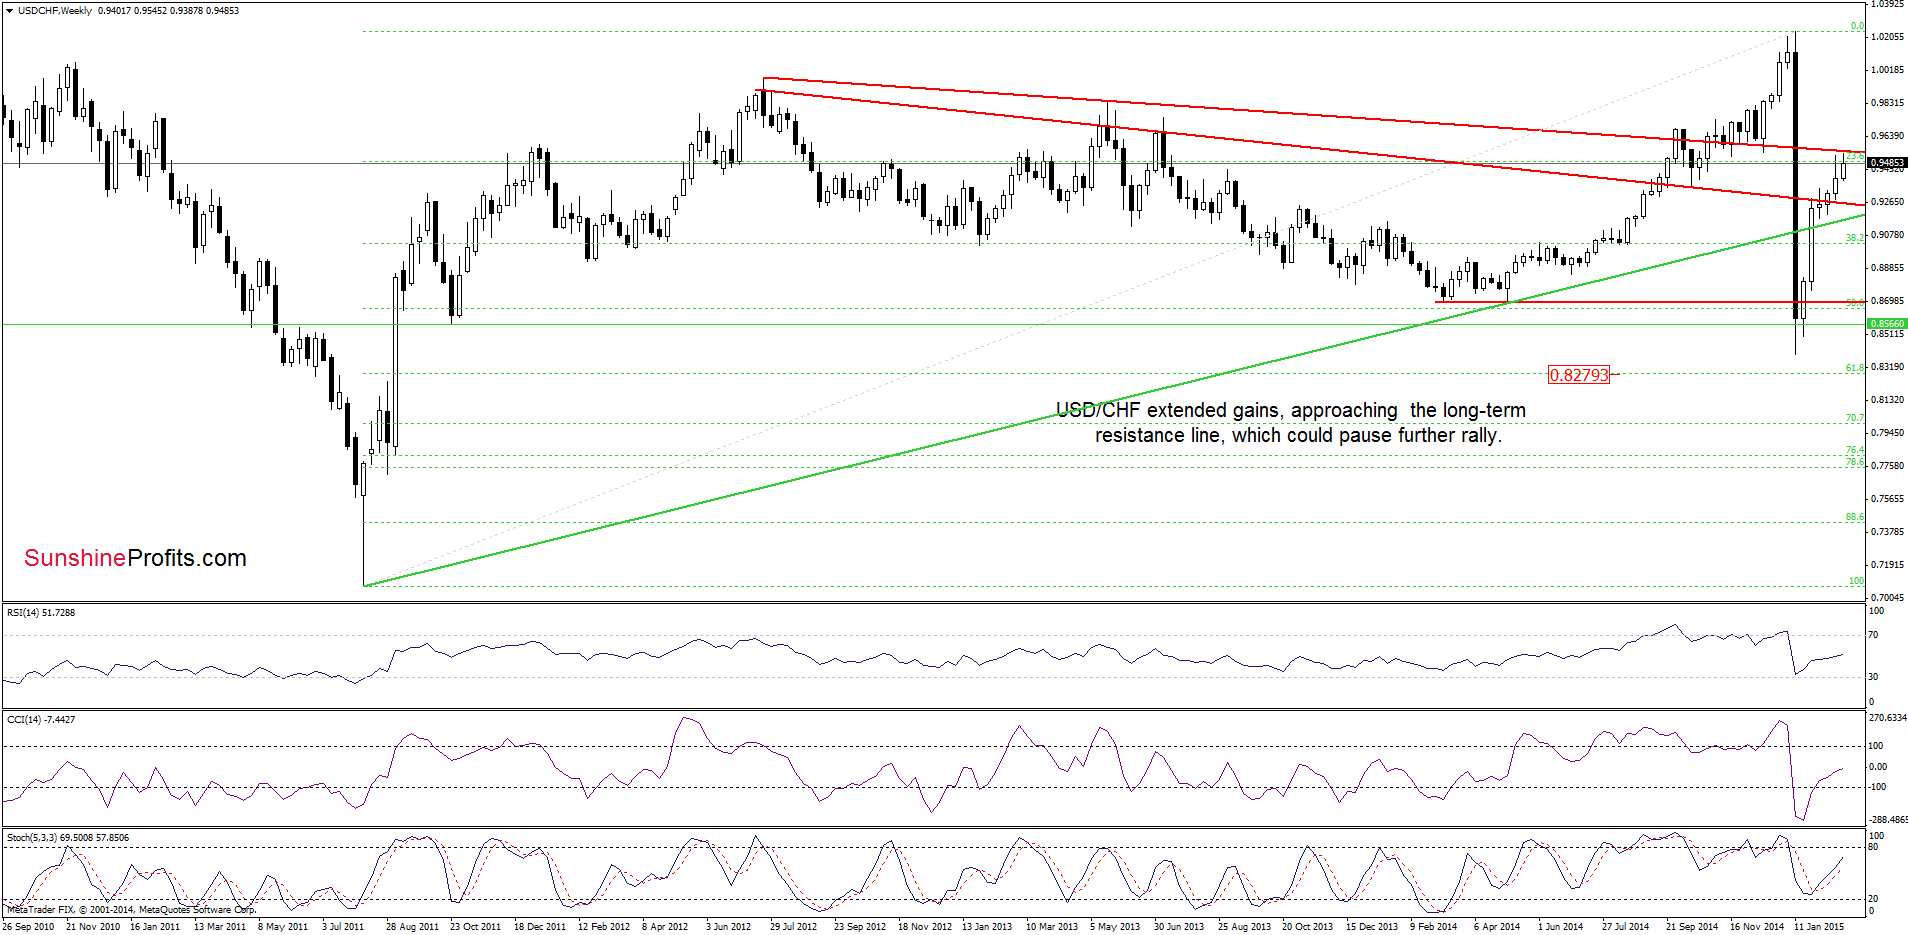
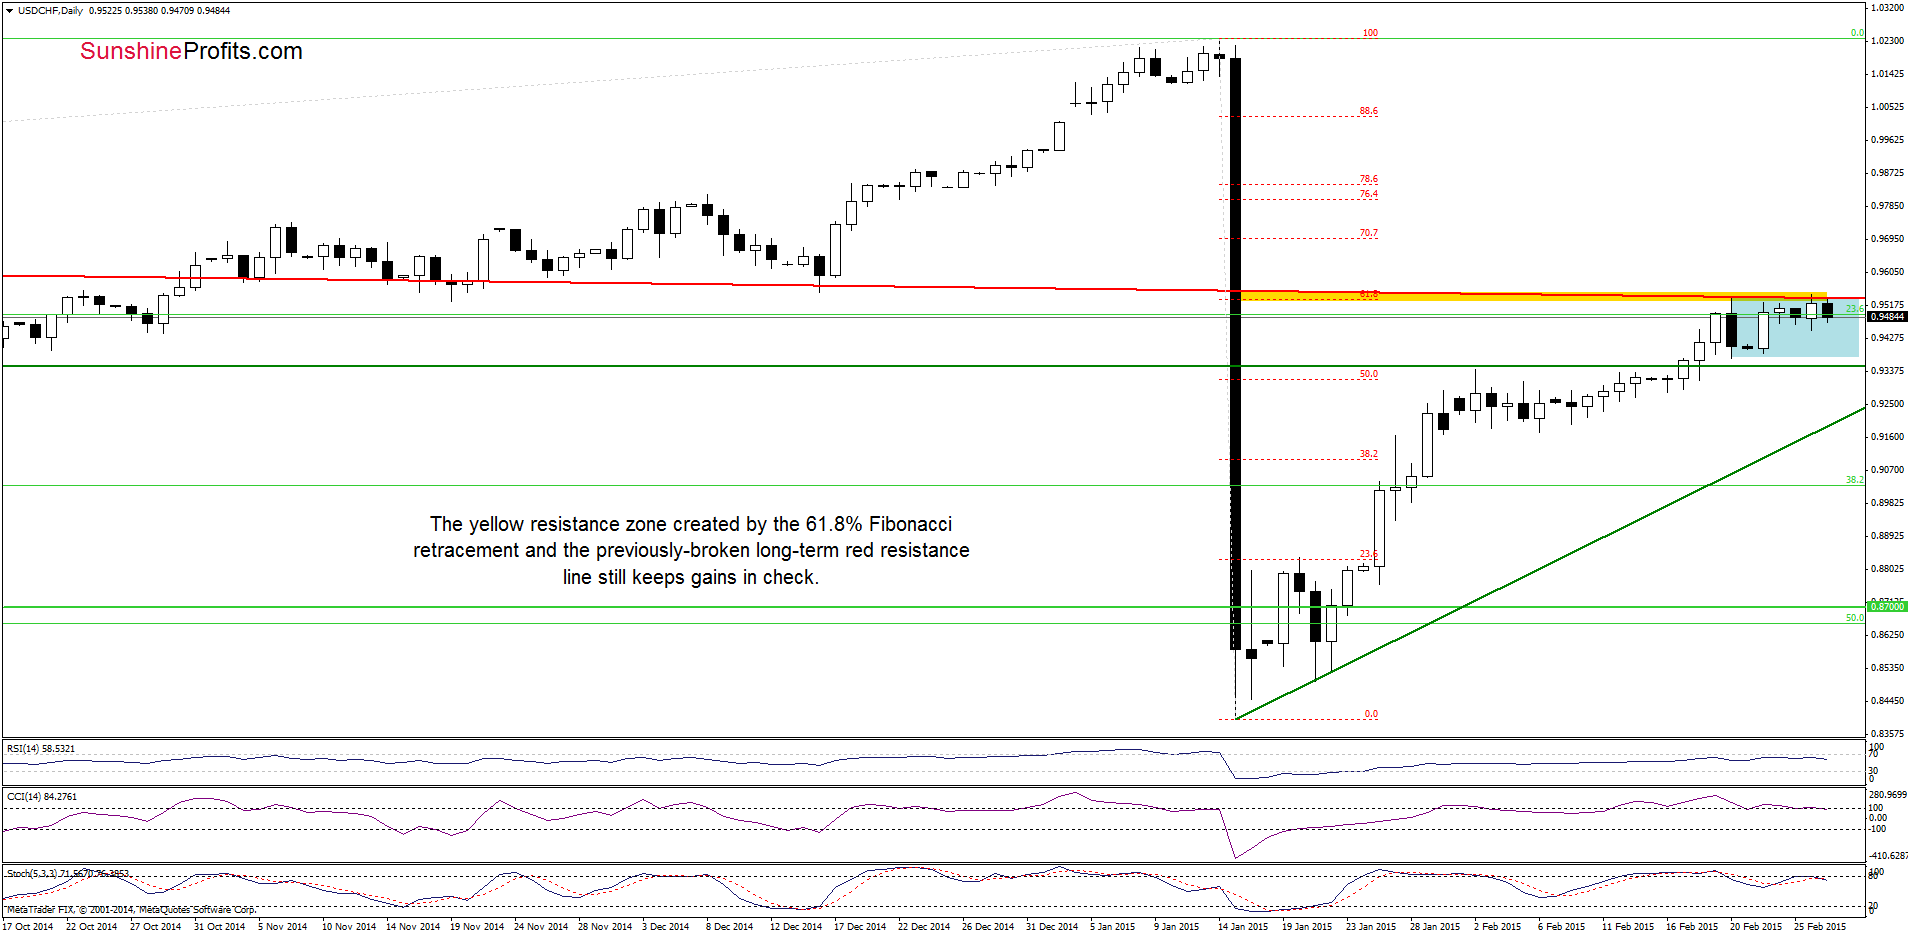
Looking at the above charts, we see that USD/CHF remains in a consolidation (marked with blue), which means that a breakout/breakdown will indicate the direction of future moves. Therefore, we believe that our last commentary on this currency pair is till valid:
(…) taking into account the yellow resistance zone (created by the previously-broken long-term red declining resistance line and the 61.8% Fibonacci retracement) and the current position of the indicators, it seems that lower values of the exchange rate are just around the corner. In our opinion, the bearish scenario will be more likely if the exchange rate drops under 0.9374 in the coming days.
Very short-term outlook: mixed
Short-term outlook: mixed
MT outlook: mixed
LT outlook: bearish
Trading position (short-term; our opinion): No positions are justified from the risk/reward perspective at the moment. We will keep you informed should anything change, or should we see a confirmation/invalidation of the above.
AUD/USD
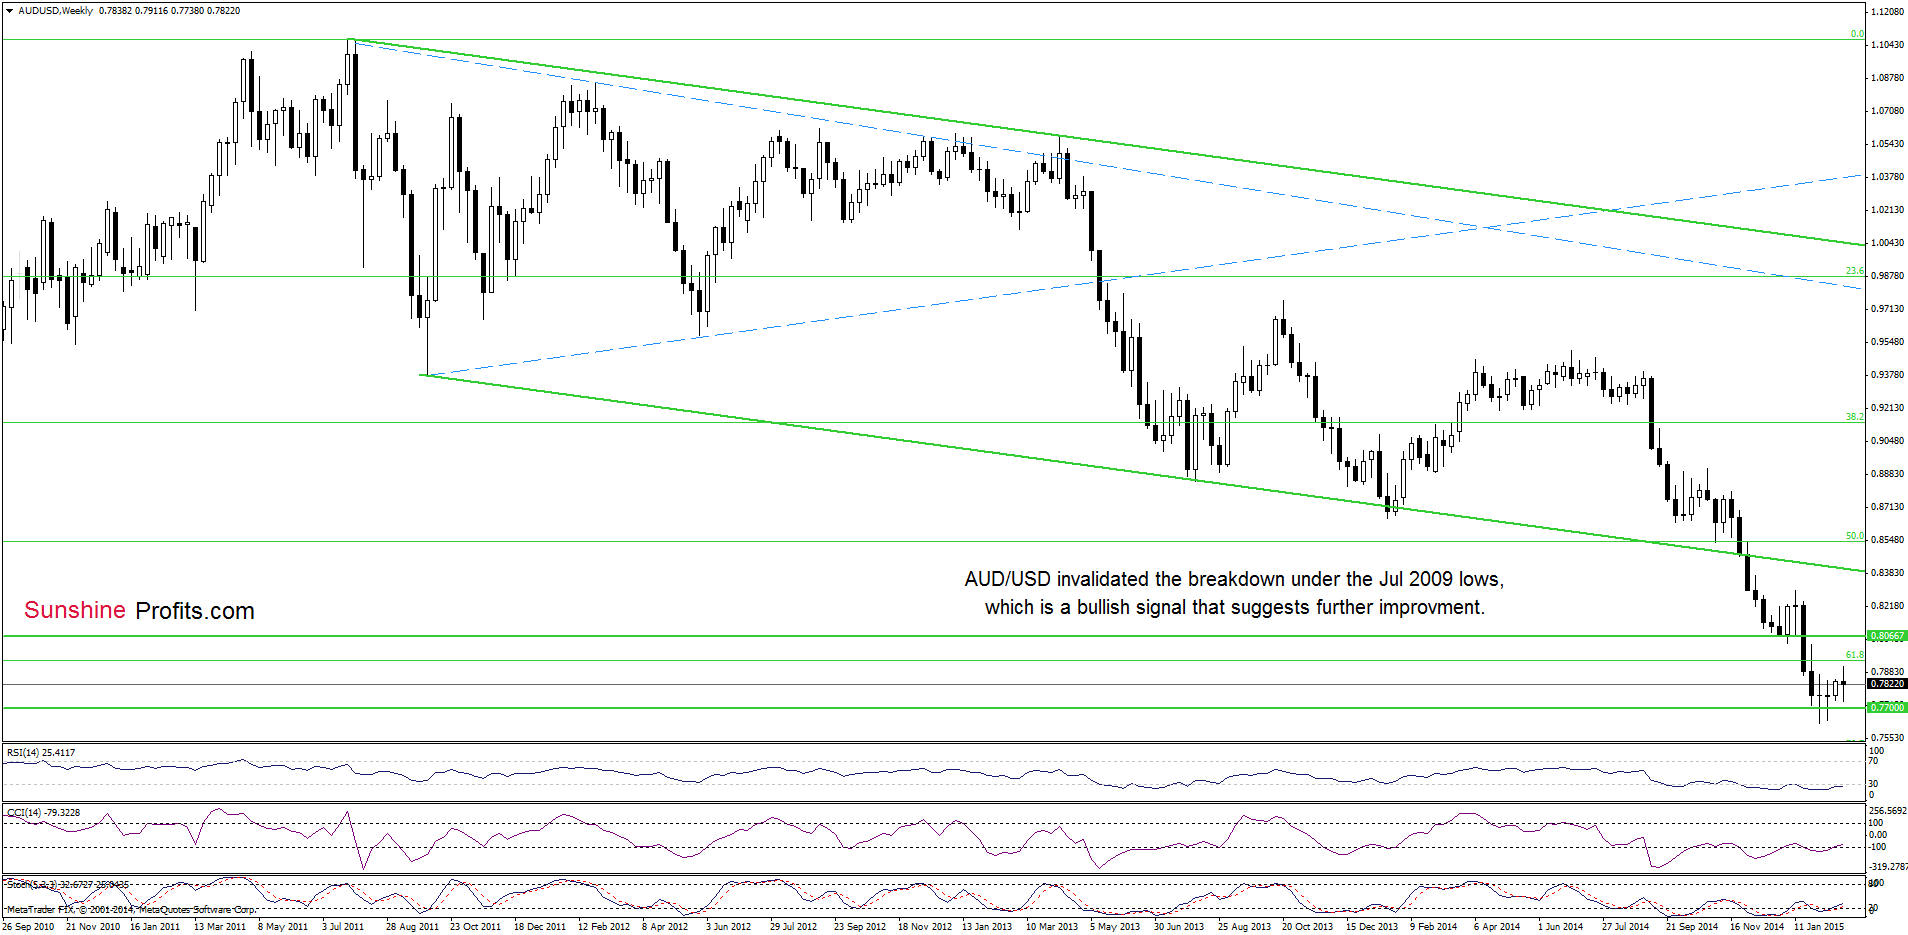
The situation in the medium term hasn’t changed much as an invalidation of the breakdown below the Jul 2009 lows and its potential positive impact on future moves is still in effect.
Having said that, let’s take a closer look at the daily chart.
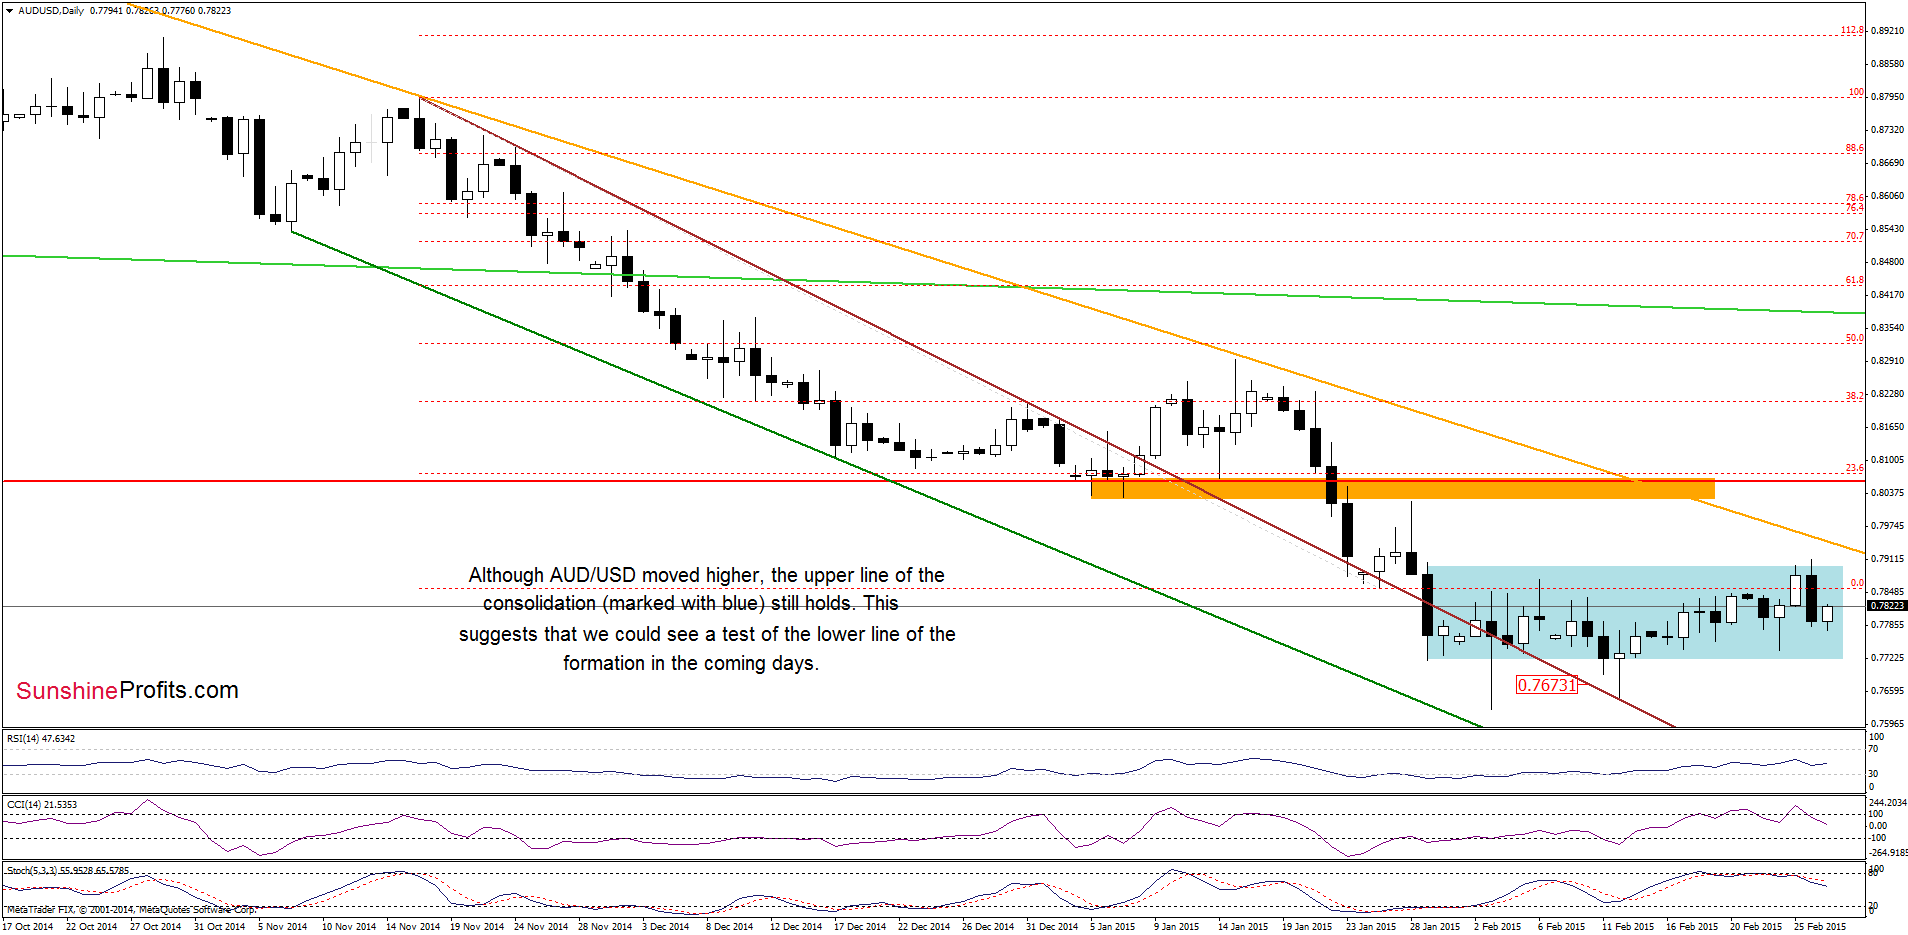
From this perspectve, we see that although the pair moved higher earlier today, the upper border of the consolidation (marked with blue) still holds. Taking this fact into account, and combining it with the position of the indicators (the CCI and Stochastic Oscillator generated sell signals), it seems to us that the next move will be to the downside. If this is the case, the initial target for currency bears would be around 0.7718-0.7738 where the Feb 24 and the lower line of the consolidation are.
Very short-term outlook: mixed with bearish bias
Short-term outlook: mixed
MT outlook: mixed
LT outlook: mixed
Trading position (short-term; our opinion): No positions are justified from the risk/reward perspective at the moment. We will keep you informed should anything change, or should we see a confirmation/invalidation of the above.
Thank you.
Nadia Simmons
Forex & Oil Trading Strategist
Przemyslaw Radomski, CFA
Founder, Editor-in-chief
Gold & Silver Trading Alerts
Forex Trading Alerts
Oil Investment Updates
Oil Trading Alerts

