
Although the Labor Department showed the U.S. unemployment rate increased to 5.7% from 5.6% in December, the U.S. economy added 257,000 jobs in the previous month beating expectations for an increase of 234,000. Additionally, today’s data showed that U.S. average hourly earnings rose 0.5% in January, exceeding expectations for a 0.3% gain. Thanks to these bullish numbers, the USD Index increased above 94.67, erasing all yesterday’s decline. How did this increase rally affect the picture of major currency pairs? Did it change their outlooks?
In our opinion the following forex trading positions are justified - summary:
- EUR/USD: long (stop loss order at 1.1219)
- GBP/USD: none
- USD/JPY: none
- USD/CAD: short (stop loss order at 1.2676)
- USD/CHF: none
- AUD/USD: none
EUR/USD
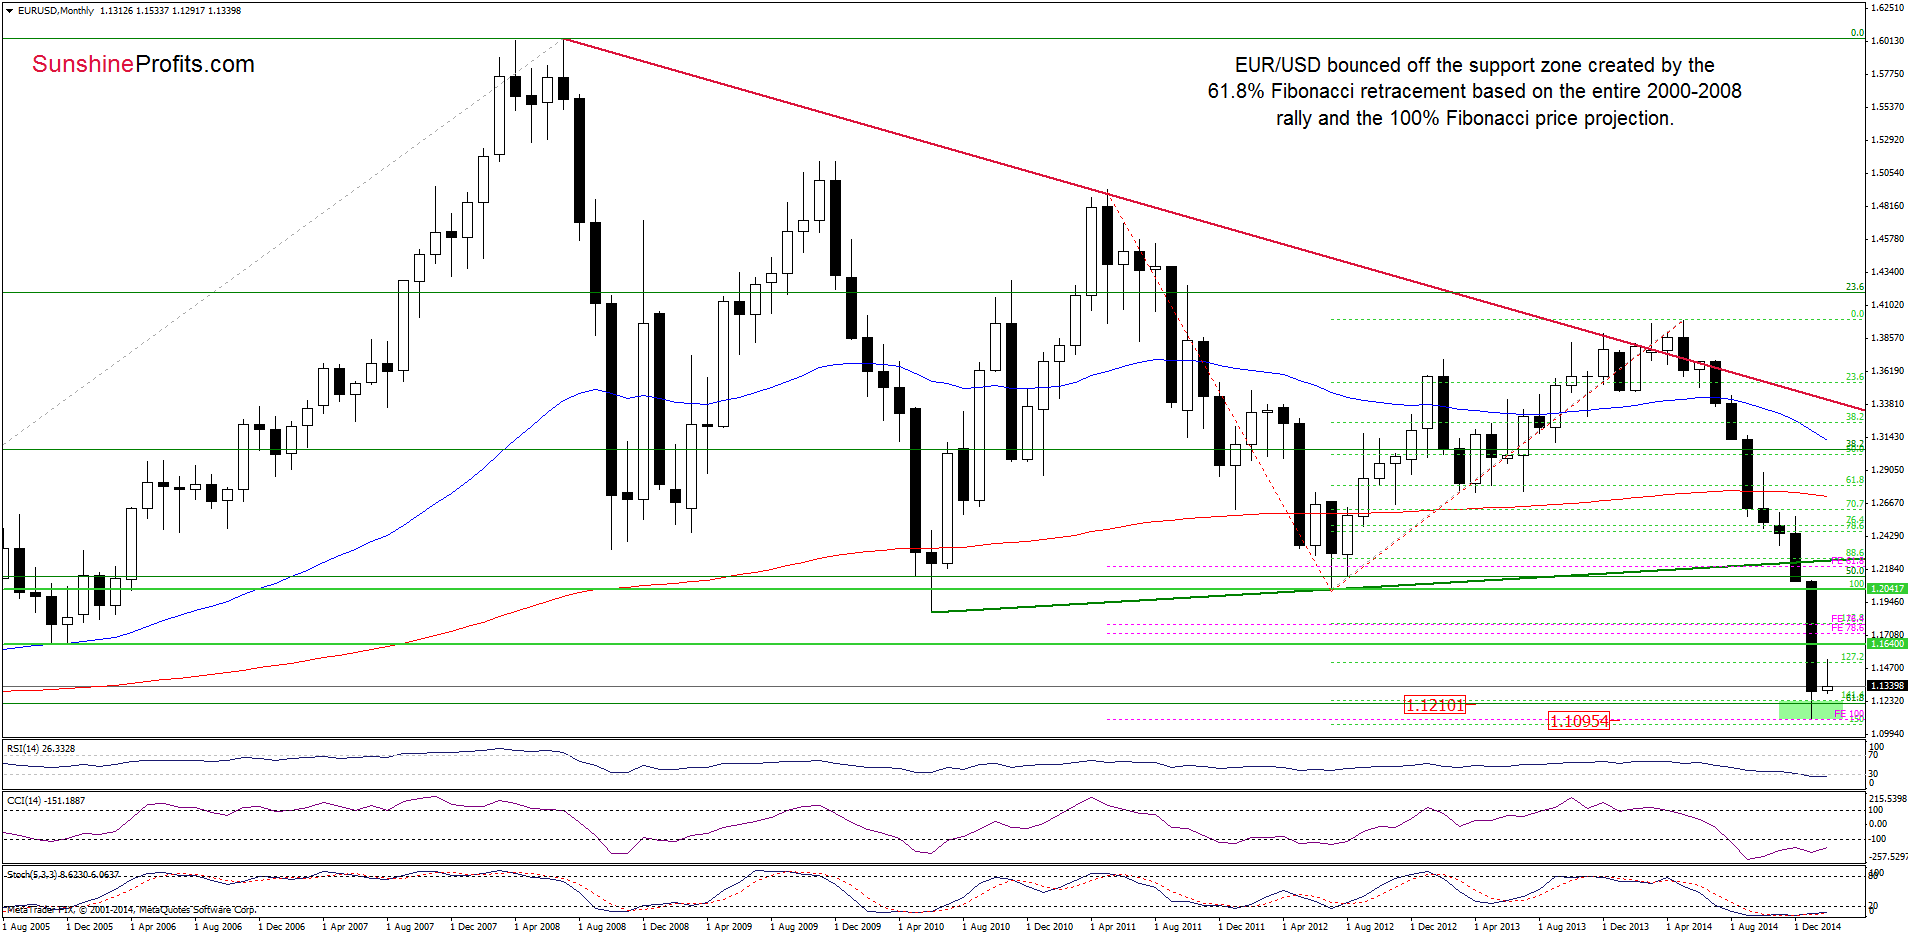
The medium-term picture hasn’t changed much as and invalidation of the breakdown below the 61.8% Fibonacci retracement and its positive impact on the exchange rate are still in effect. Having said that, let’s focus on the daily chart.
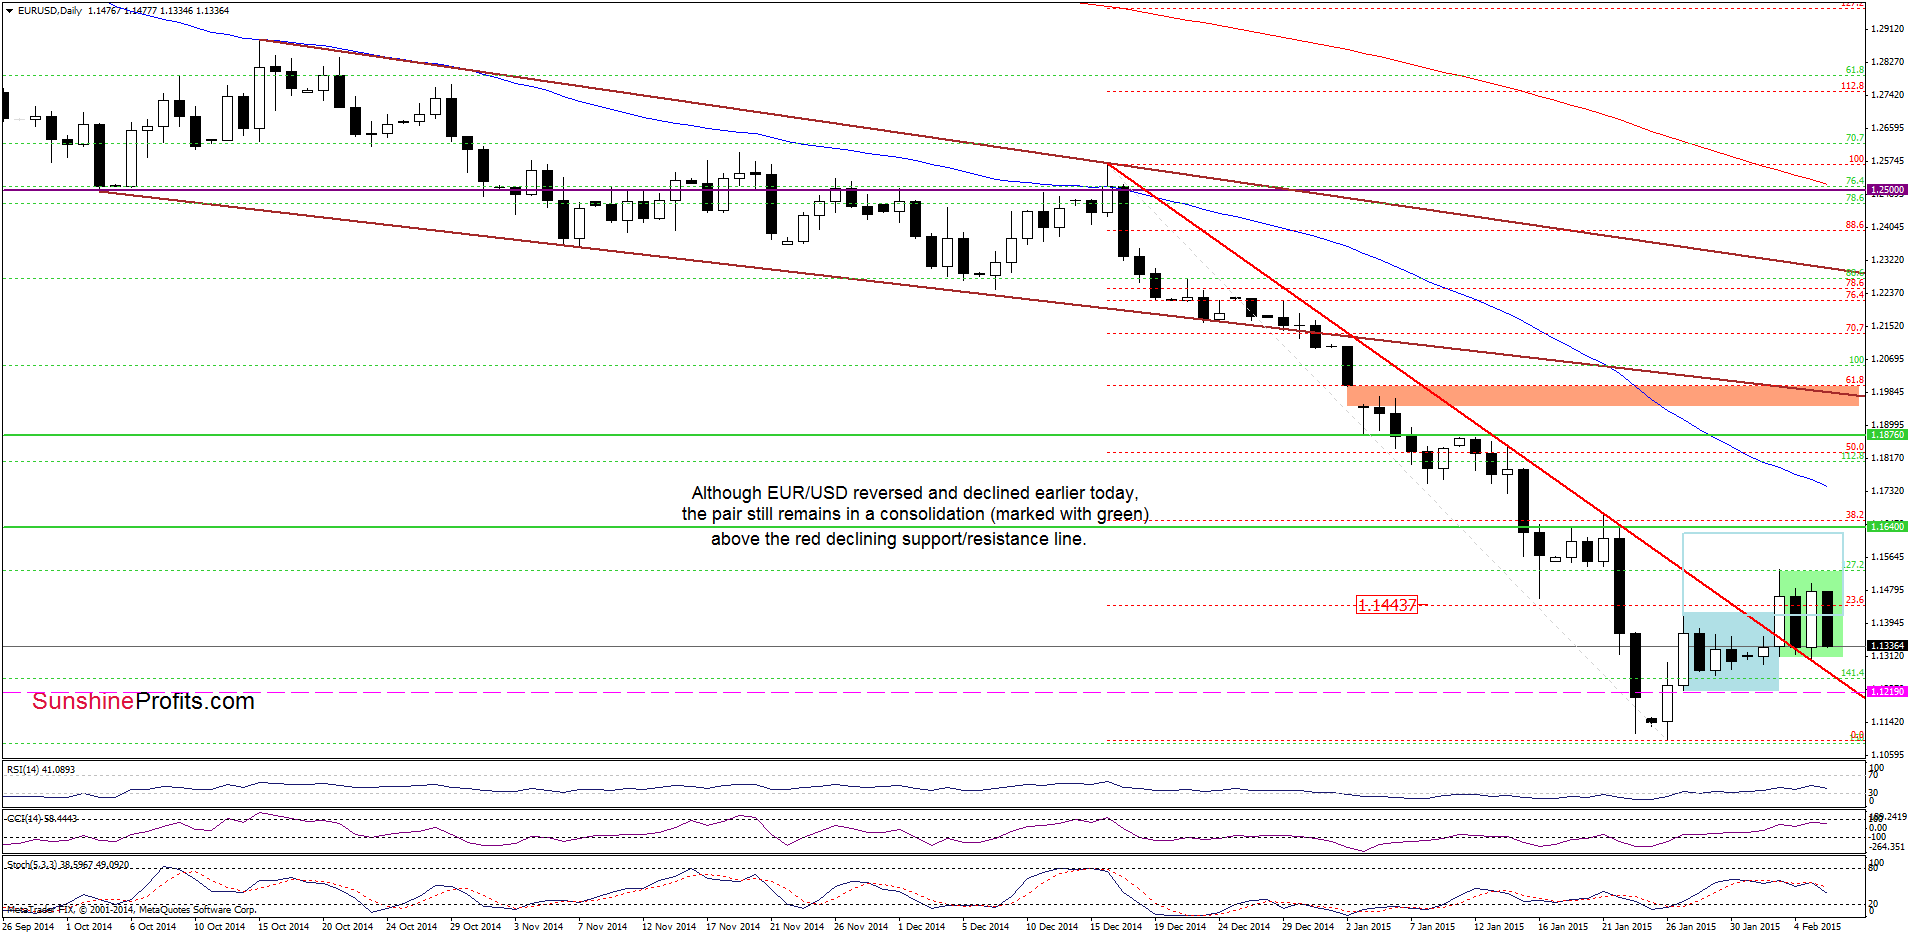
On the daily chart, we see that although EUR/USD declined earlier today, the pair still remains in a consolidation (marked with green), above the previously-broken red declining support/resistance line, which stopped further deterioration yesterday. Therefore, as long as there is no invalidation of the breakout above this important line, another rebound from here (similarly to what we saw in the recent days) is likely. If this is the case, the initial upside target would be the upper line of the formation (based on the Tuesday’s high of 1.1533).
Very short-term outlook: bullish
Short-term outlook: mixed
MT outlook: mixed
LT outlook: mixed
Trading position (short-term): Long positions with a stop loss order at 1.1219 are justified from the risk/reward perspective at the moment. We will keep you informed should anything change, or should we see a confirmation/invalidation of the above.
GBP/USD
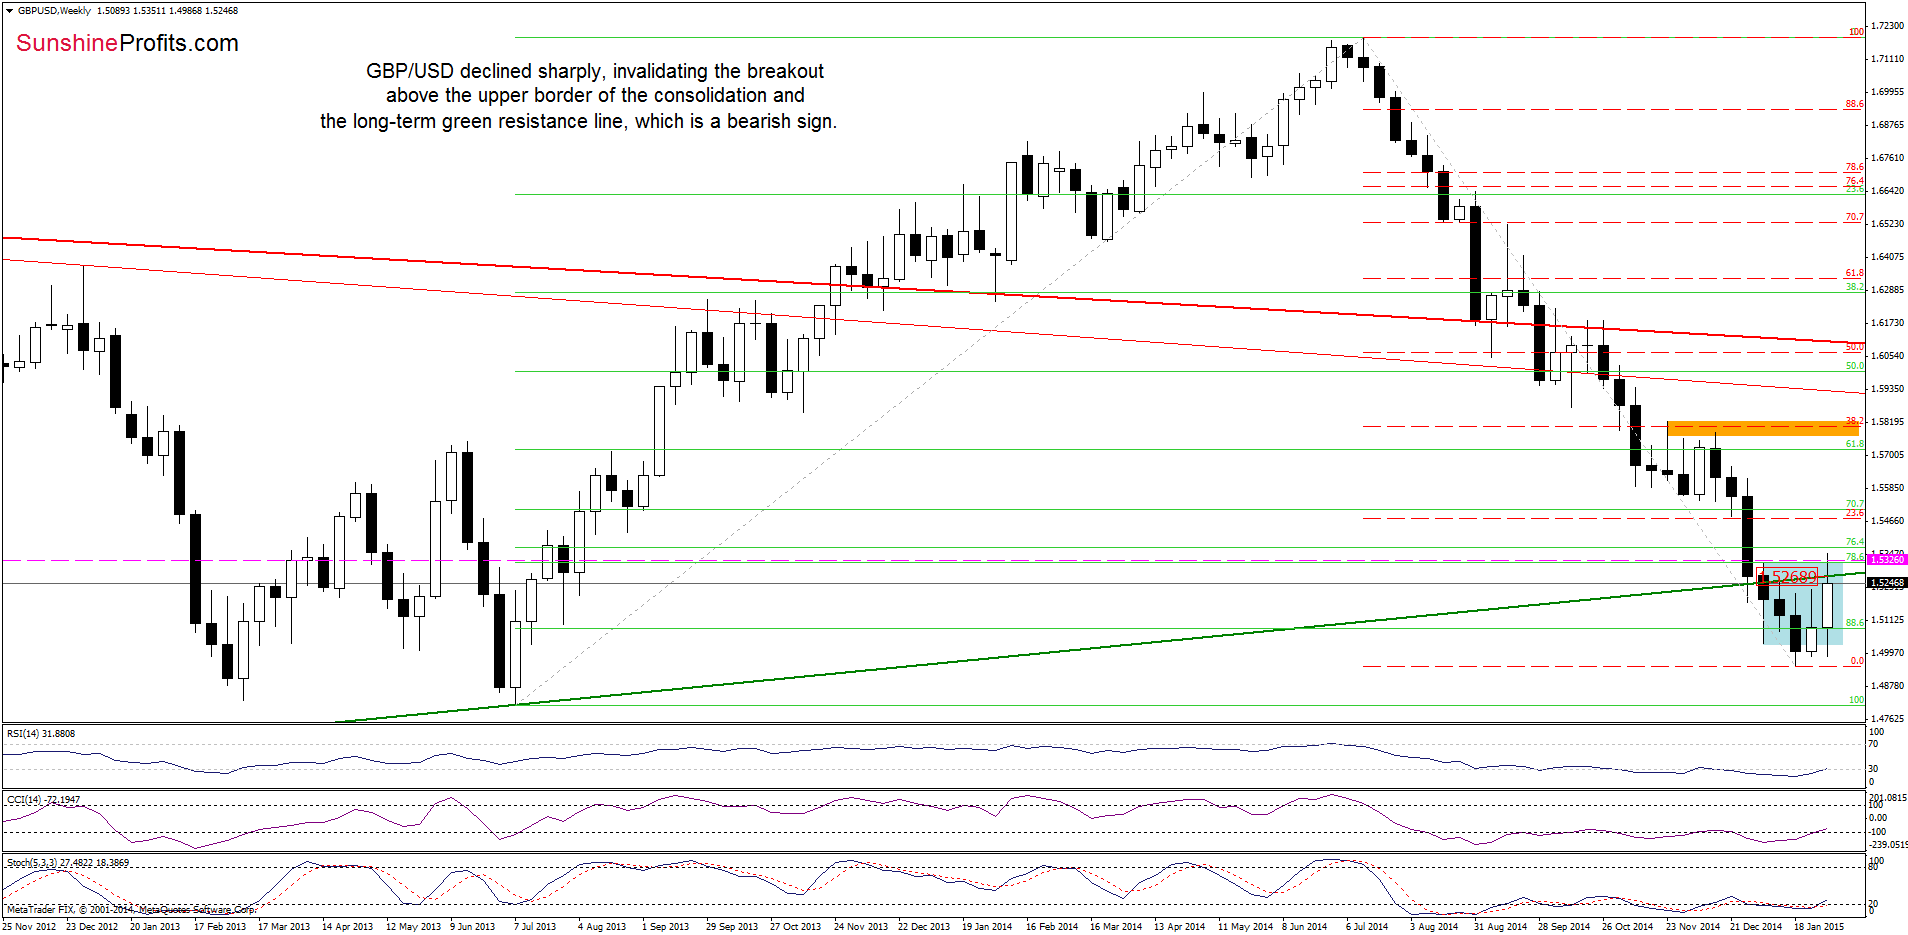
The situation in the medium-term has deteriorated as GBP/USD reversed and declined, invalidating earlier breakout above the upper line of the consolidation (marked with blue) and the long-term resistance line.
How did this move affect the short-term picture? Let’s take a look.
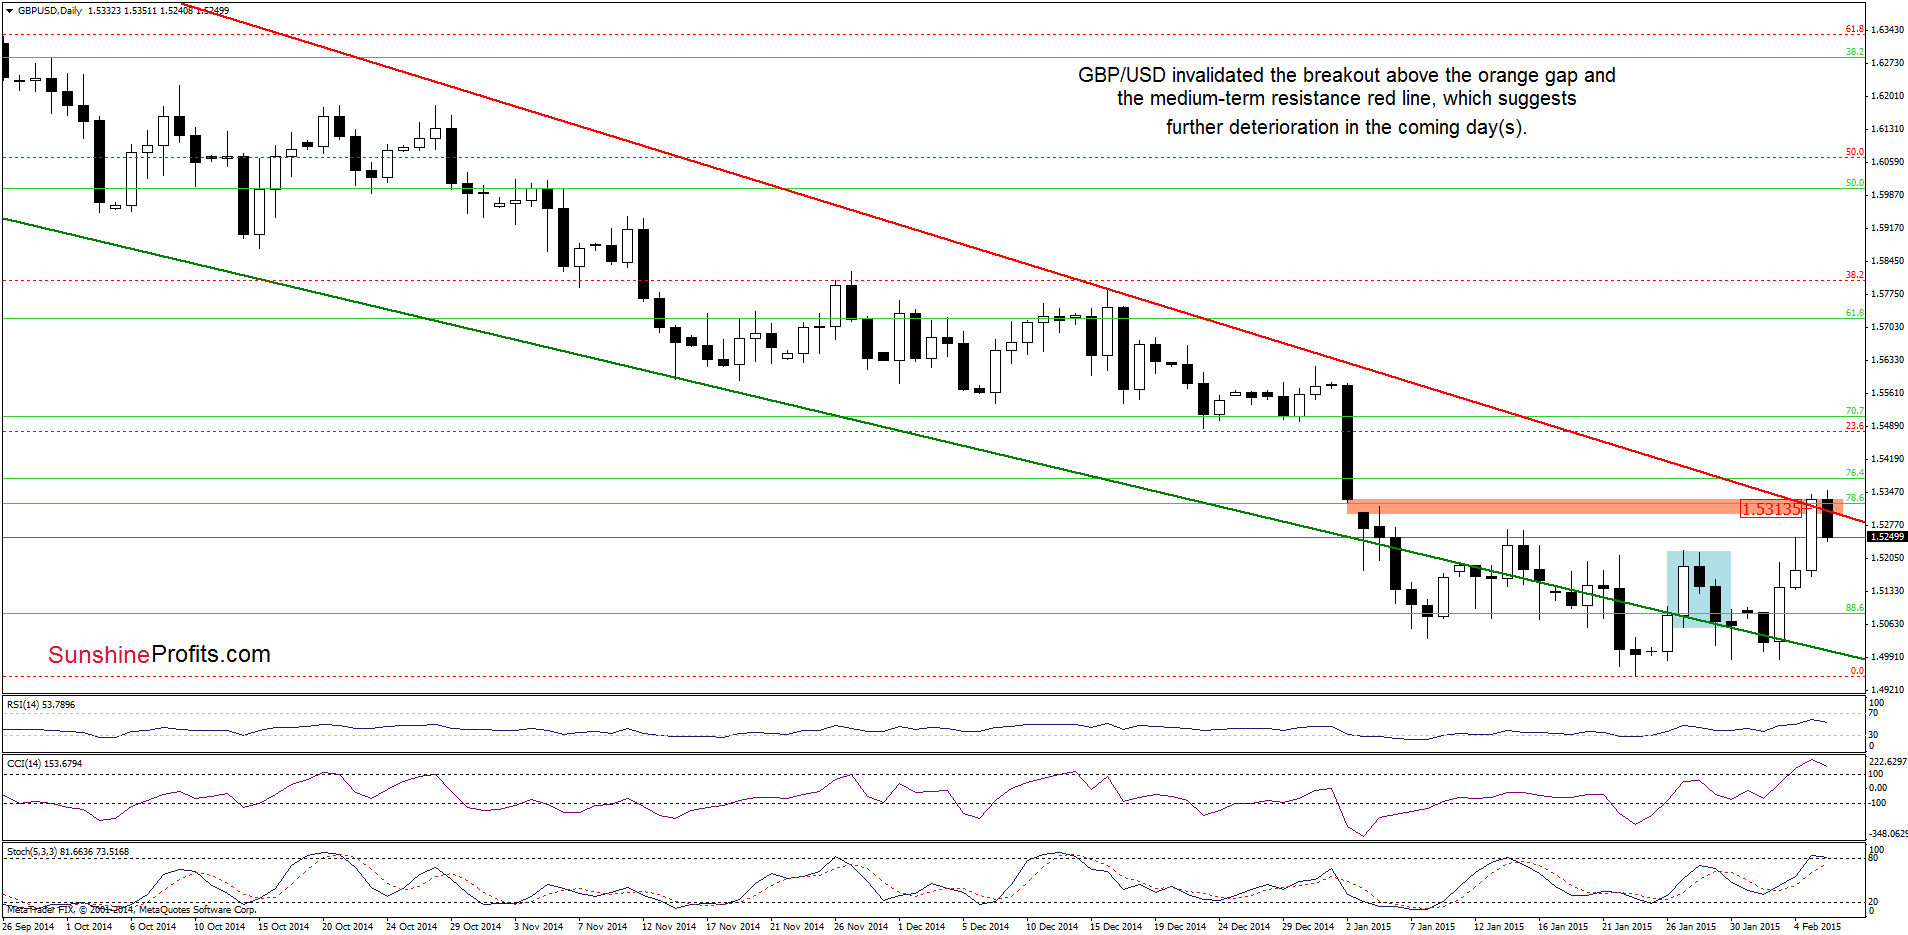
From this perspective, we see that although GBP/USD extended gains and climbed above the orange gap and the medium-term red resistance line, the exchange rate reversed, invalidating earlier breakout. Taking this fact into account, and combining it with the medium-term picture and the current position of the indicators (the CCI and Stochastic Oscillator are overbought), it seems to us that the next move will be to the downside. If this is the case, the initial downside target would be around 1.5167, where yesterday’s low is.
Very short-term outlook: bearish
Short-term outlook: mixed
MT outlook: mixed
LT outlook: mixed
Trading position (short-term): In our opinion, no positions are justified from the risk/reward perspective at the moment. We will keep you informed should anything change, or should we see a confirmation/invalidation of the above.
USD/JPY
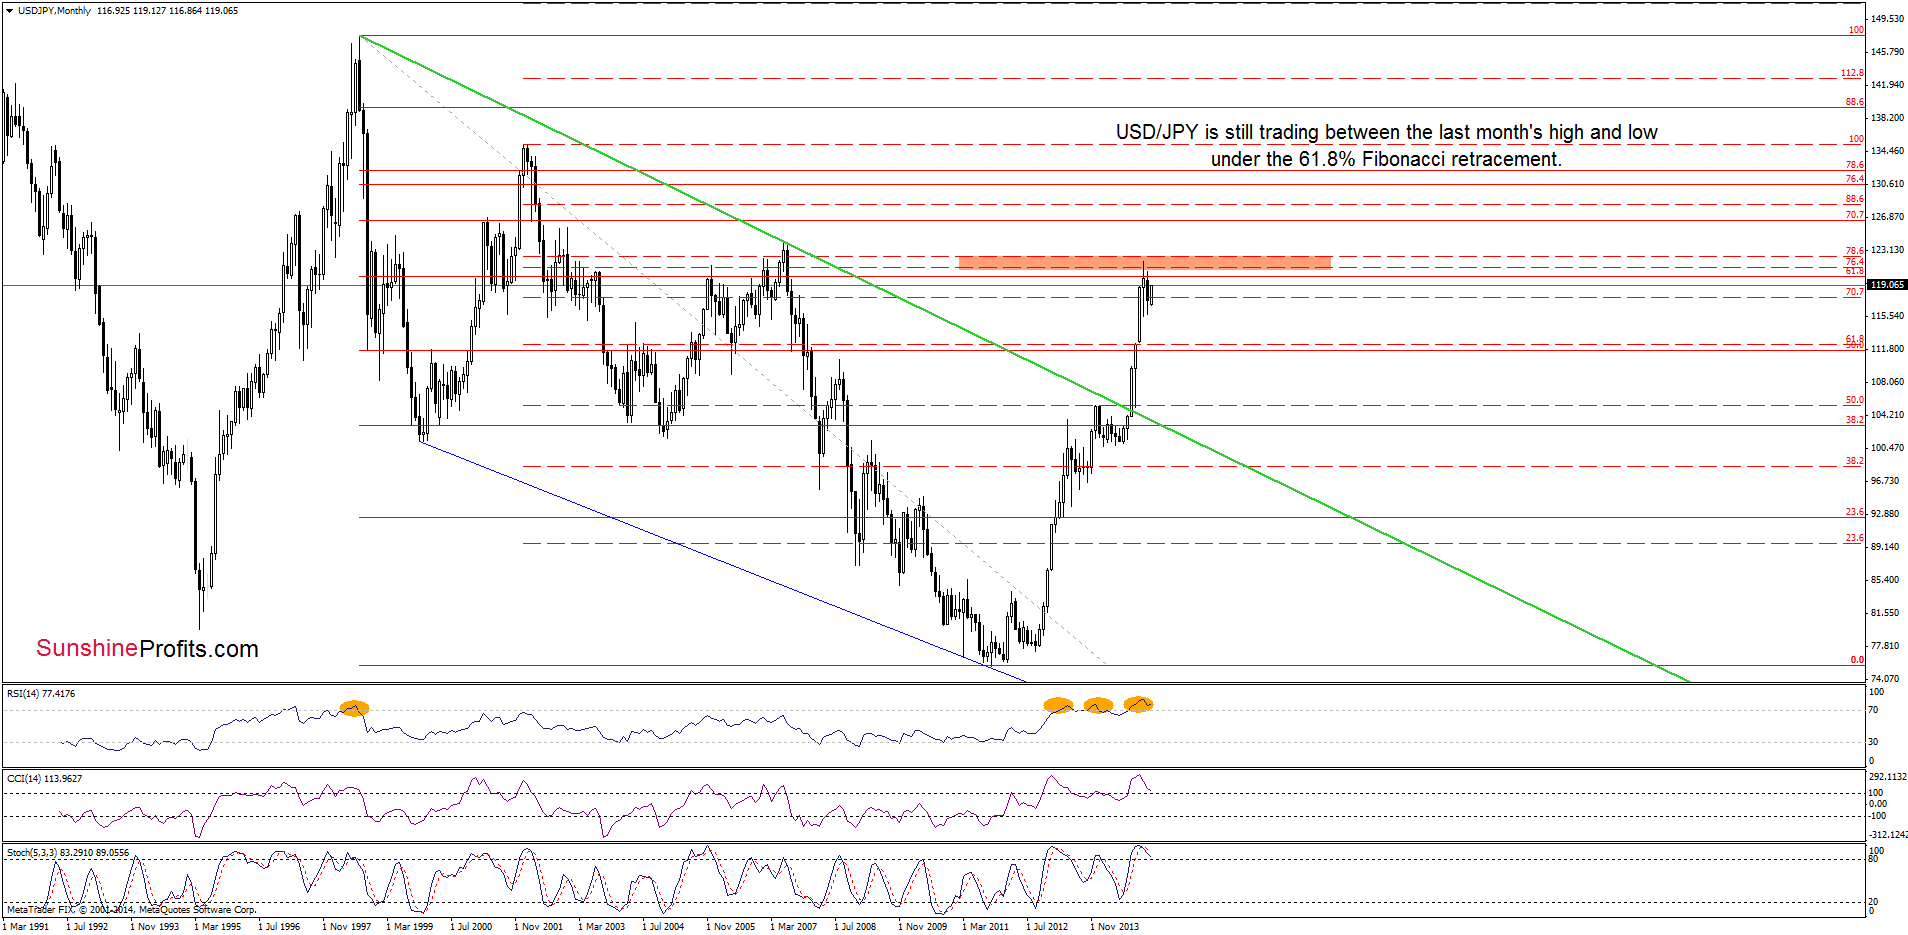
The situation in the medium-term hasn’t changed much as USD/JPY is still trading between the Dec high and low, under the 61.8% Fibonacci retracement.
Will the daily chart give us more clues about future moves? Let’s check.
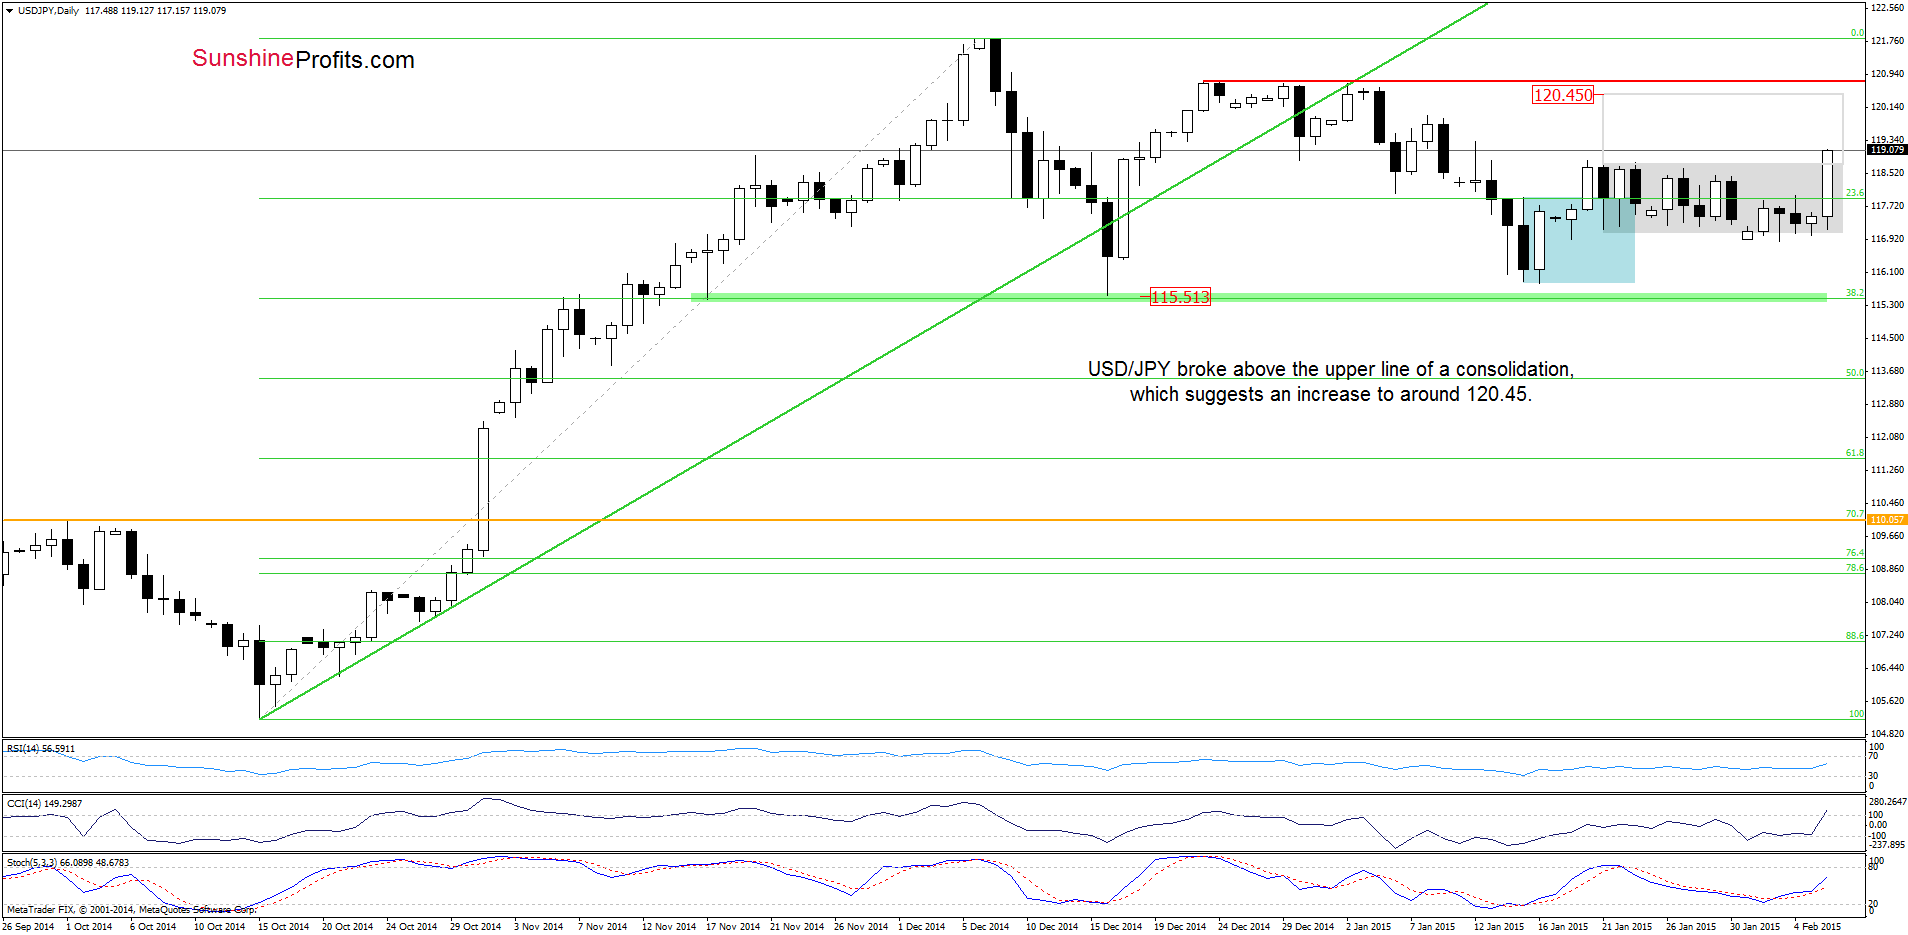
In our last commentary on this currency pair, we wrote the following:
(…) USD/JPY dropped under the lower border of the consolidation (…) this small deterioration was only temporary and the pair came back inside the formation, invalidating earlier breakdown. Taking this fact into account, and combining it with buy signals generated by the Stochastic Oscillator and CCI, it seems to us that the exchange rate will increase to around 118.65-118.80, where the recent highs are.
From today’s point of view, we see that the situation not only developed in line with the above mentioned scenario, but currency bulls managed to push the pair above the upper line of the consolidation. This is a positive sign, which suggests further improvement and an increase to around 120.45, where the size of the upswing will corresponds to the height of the formation.
Very short-term outlook: bullish
Short-term outlook: mixed
MT outlook: mixed
LT outlook: bullish
Trading position (short-term; our opinion): No positions are justified from the risk/reward perspective at the moment. We will keep you informed should anything change, or should we see a confirmation/invalidation of the above.
USD/CAD
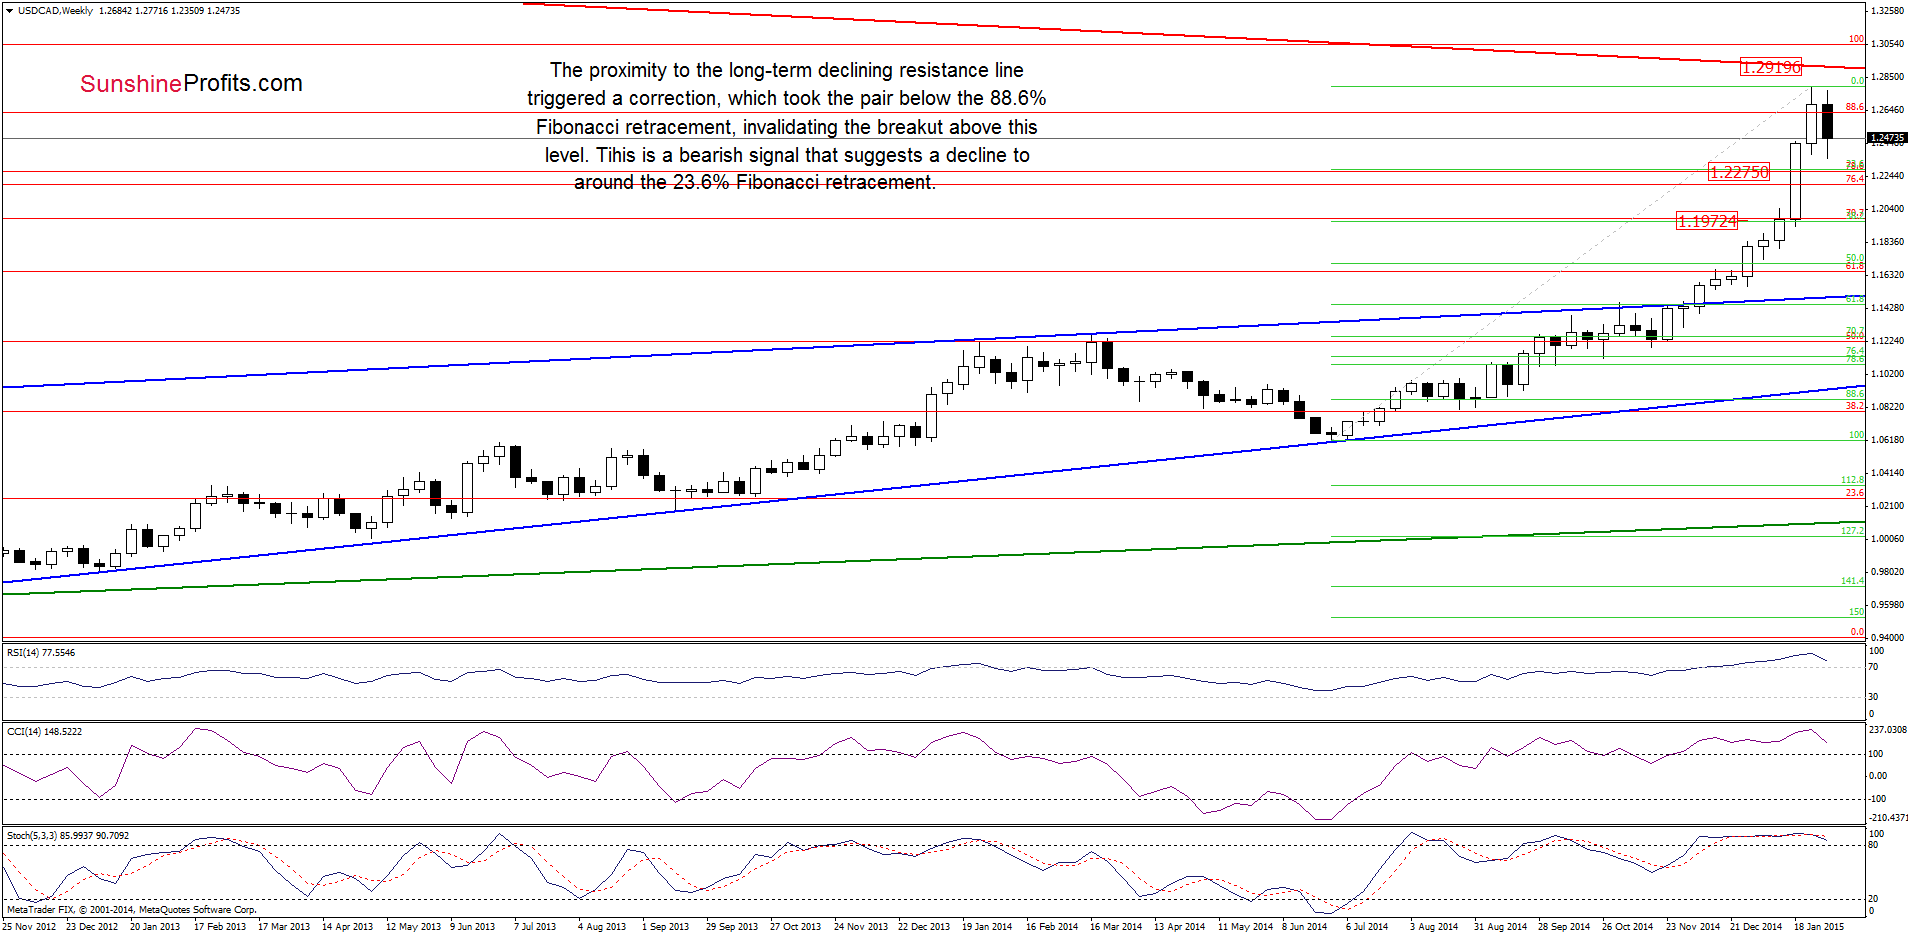
As you see on the weekly chart, although the pair rebounded slightly, USD/CAD is still trading below the previously- broken 88.6% Fibonacci retracement. Therefore, what we wrote on Tuesday is up-to-date:
(…) This (…) bearish signal (…) suggests a drop to the 23.6% (around 1.2275) or even 38.2% (at 1.1973) Fibonacci retracement based on the entire Jun-Jan rally in the coming week.
Are there any short-term factors that could hinder the realization of the above scenario? Let’s examine the daily chart and find out.
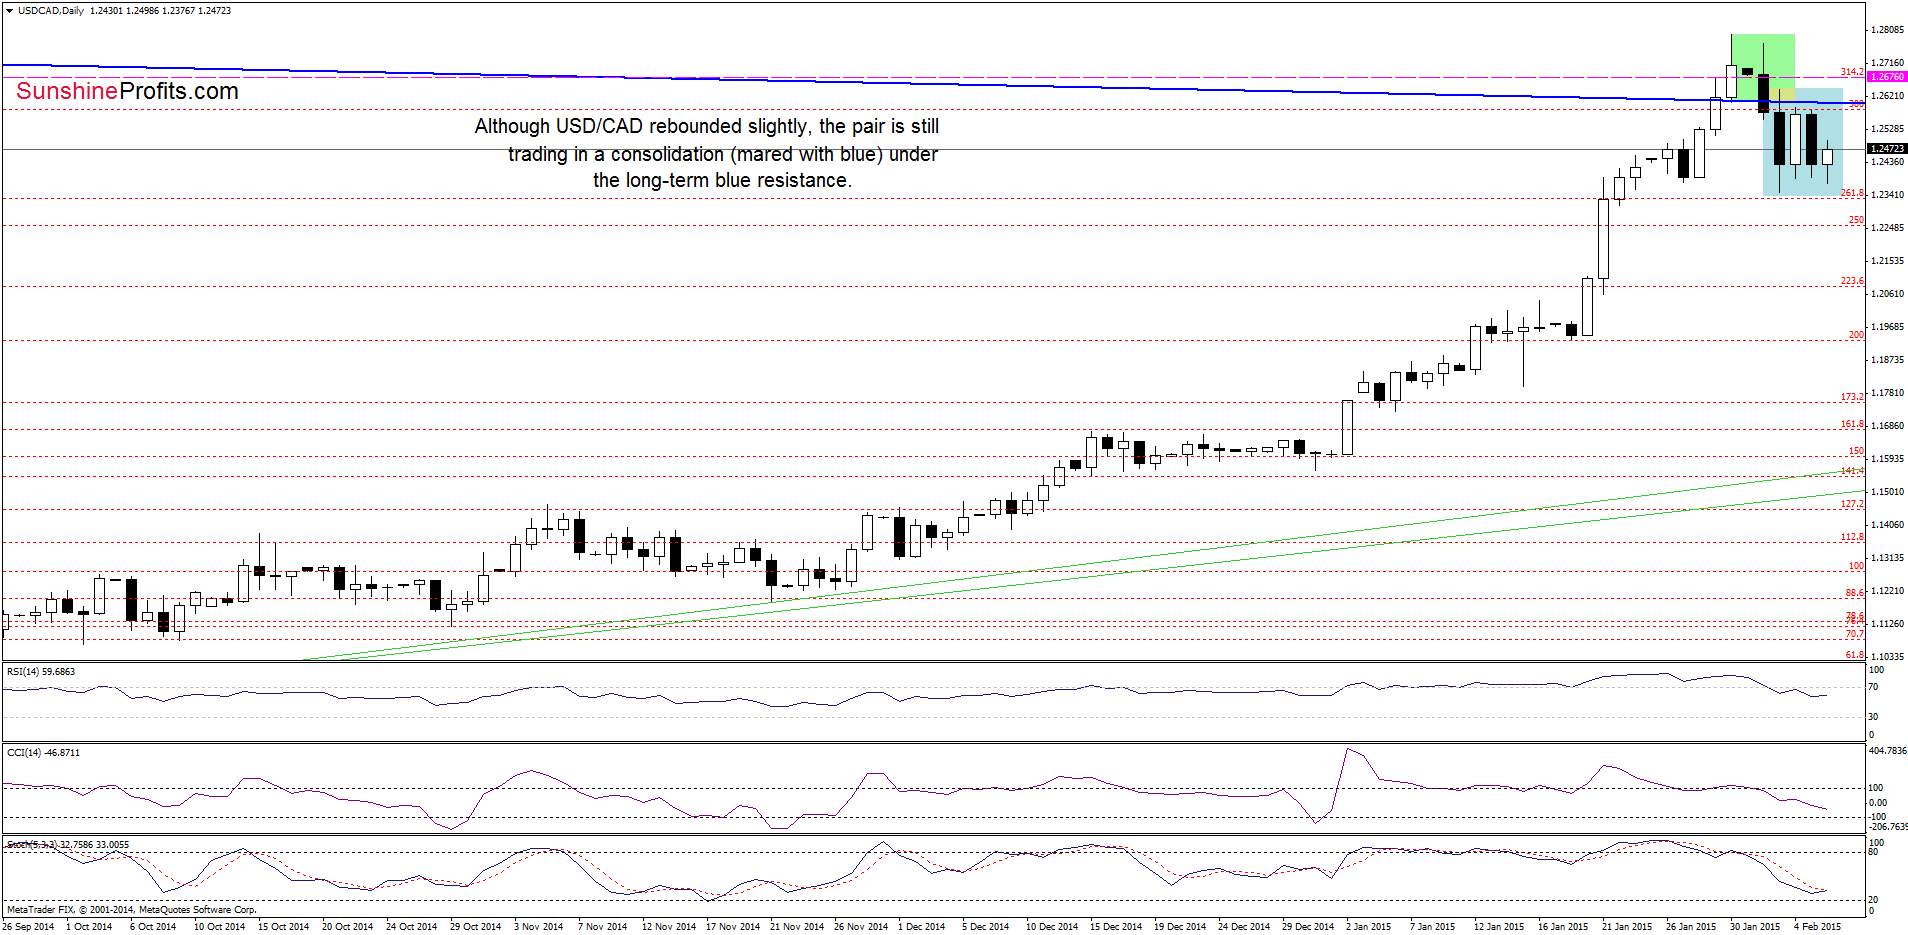
Quoting our last commentary on this currency pair:
(…) How low could the exchange rate go? The initial downside target will be around 1.2379, where the bottom of the previous correction is.
From today’s point of view, we see that the situation developed in tune with the above-mentioned scenario as USD/CAD slipped to our target. Although the exchange rate rebounded slightly, the pair still remains in a consolidation (marked with blue) below the previously-broken long-term blue resistance line. Taking this fact into account (and combining it with the medium-term picture), we think that another attempt to move lower and a test of the lower border of the consolidation is likely.
Very short-term outlook: mixed with bearish bias
Short-term outlook: mixed
MT outlook: mixed
LT outlook: mixed
Trading position (short-term; our opinion): Short positions with a stop loss order at 1.2676 are justified from the risk/reward perspective at the moment. We will keep you informed should anything change, or should we see a confirmation/invalidation of the above.
USD/CHF
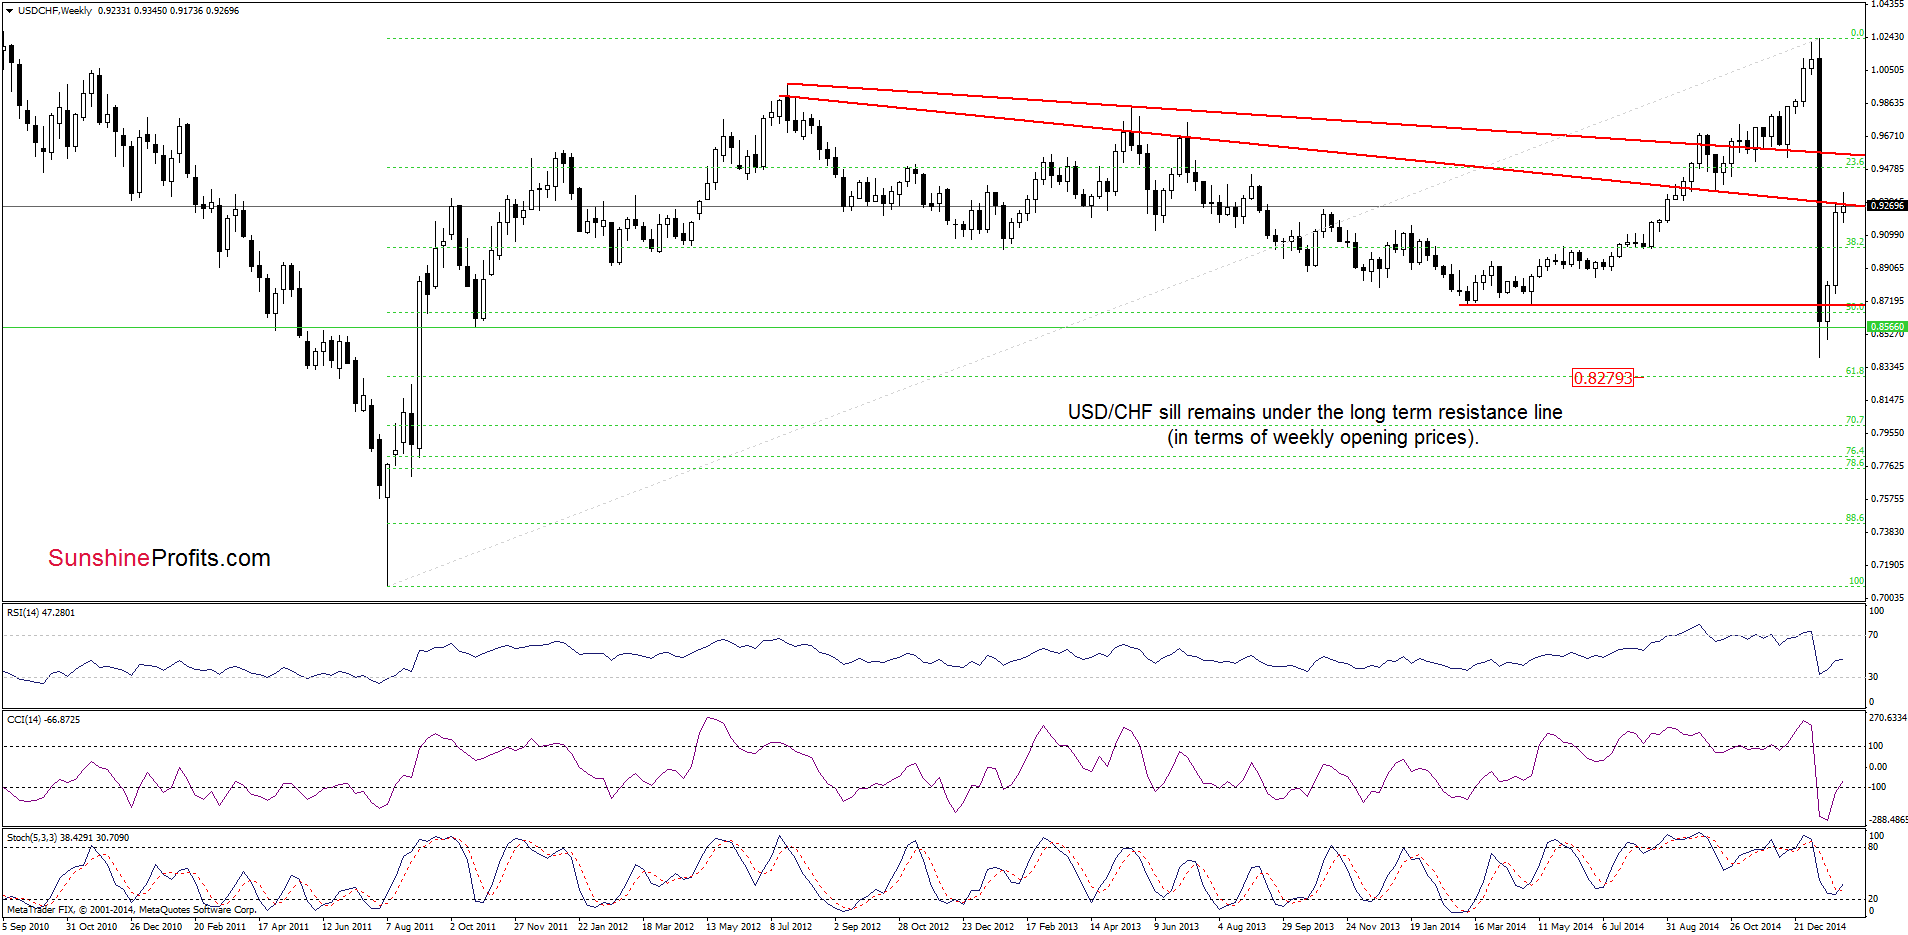
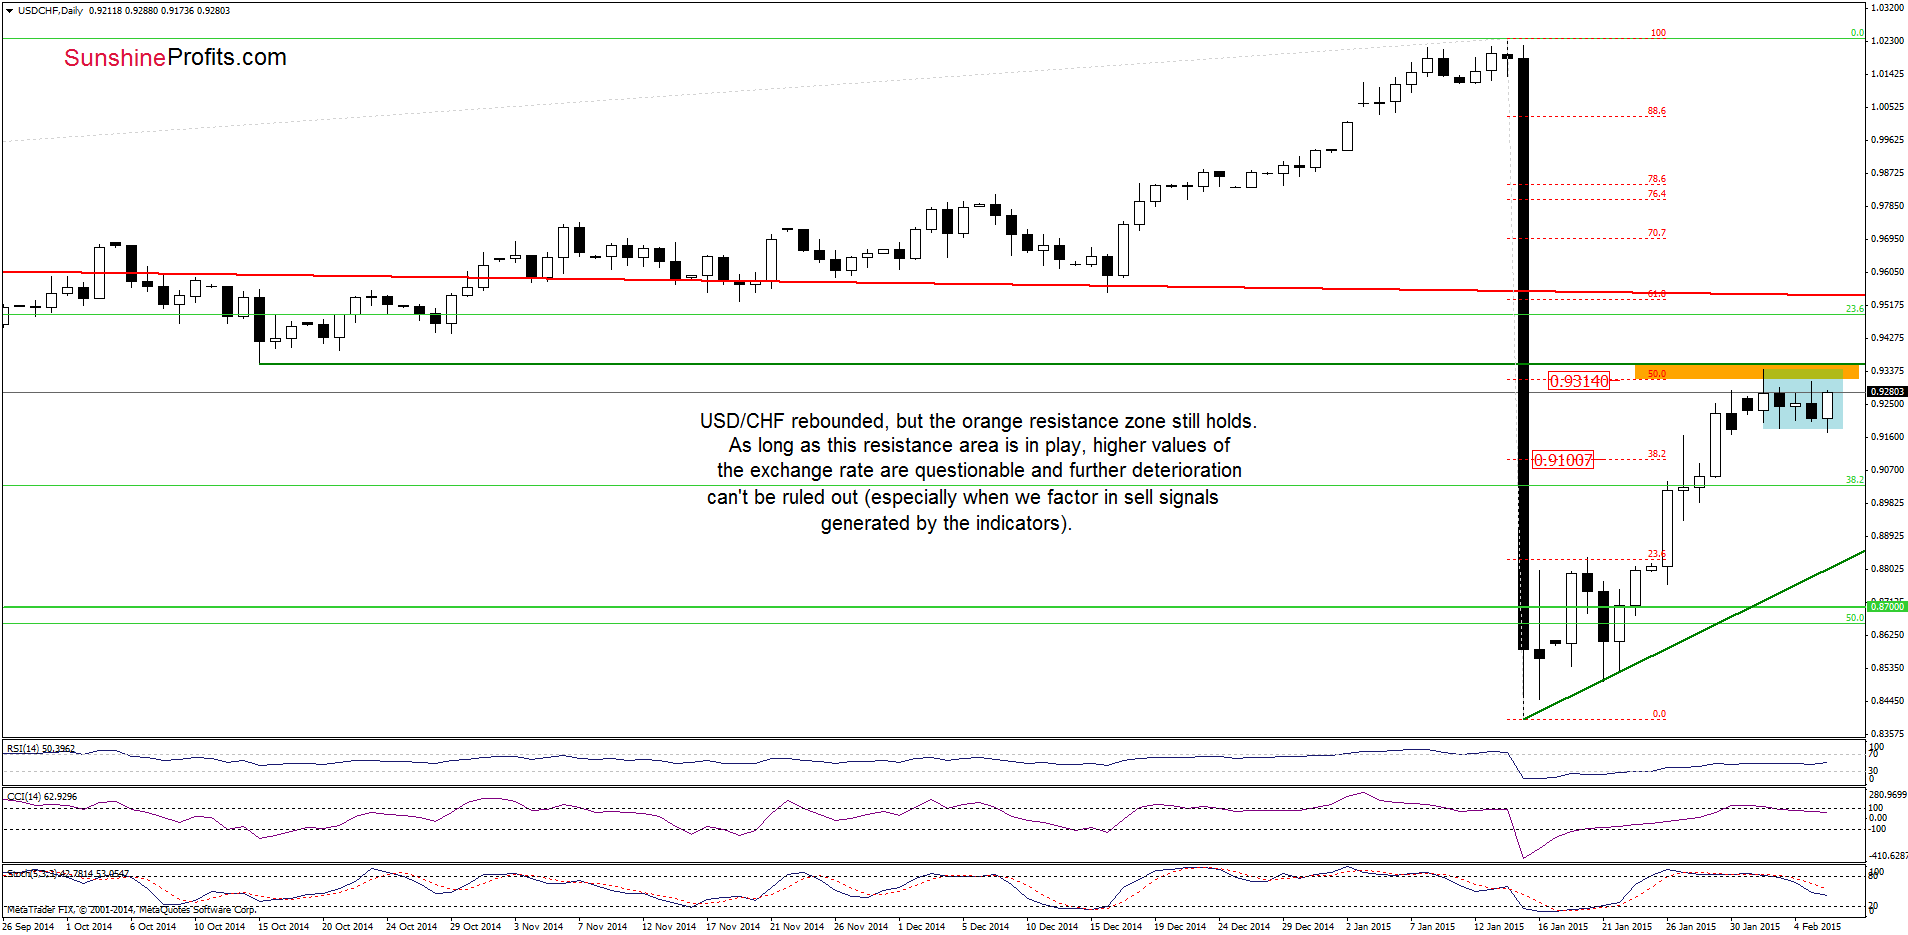
On the daily chart, we see that although USD/CHF rebounded, the orange resistance zone (created by the 50% Fibonacci retracement and the Oct 2014 low) still holds. At this point, it is worth noting that in this area is also the long-term red resistance line (based on the weekly opening prices), which reinforces the zone. Therefore, we believe that as long as there is no breakout above these levels, higher values of the exchange rate are questionable and further deterioration can’t be ruled out – especially when we factor in sell signals generated by the indicators.
Very short-term outlook: mixed with bearish bias
Short-term outlook: mixed
MT outlook: mixed
LT outlook: bearish
Trading position (short-term; our opinion): No positions are justified from the risk/reward perspective at the moment. We will keep you informed should anything change, or should we see a confirmation/invalidation of the above.
AUD/USD
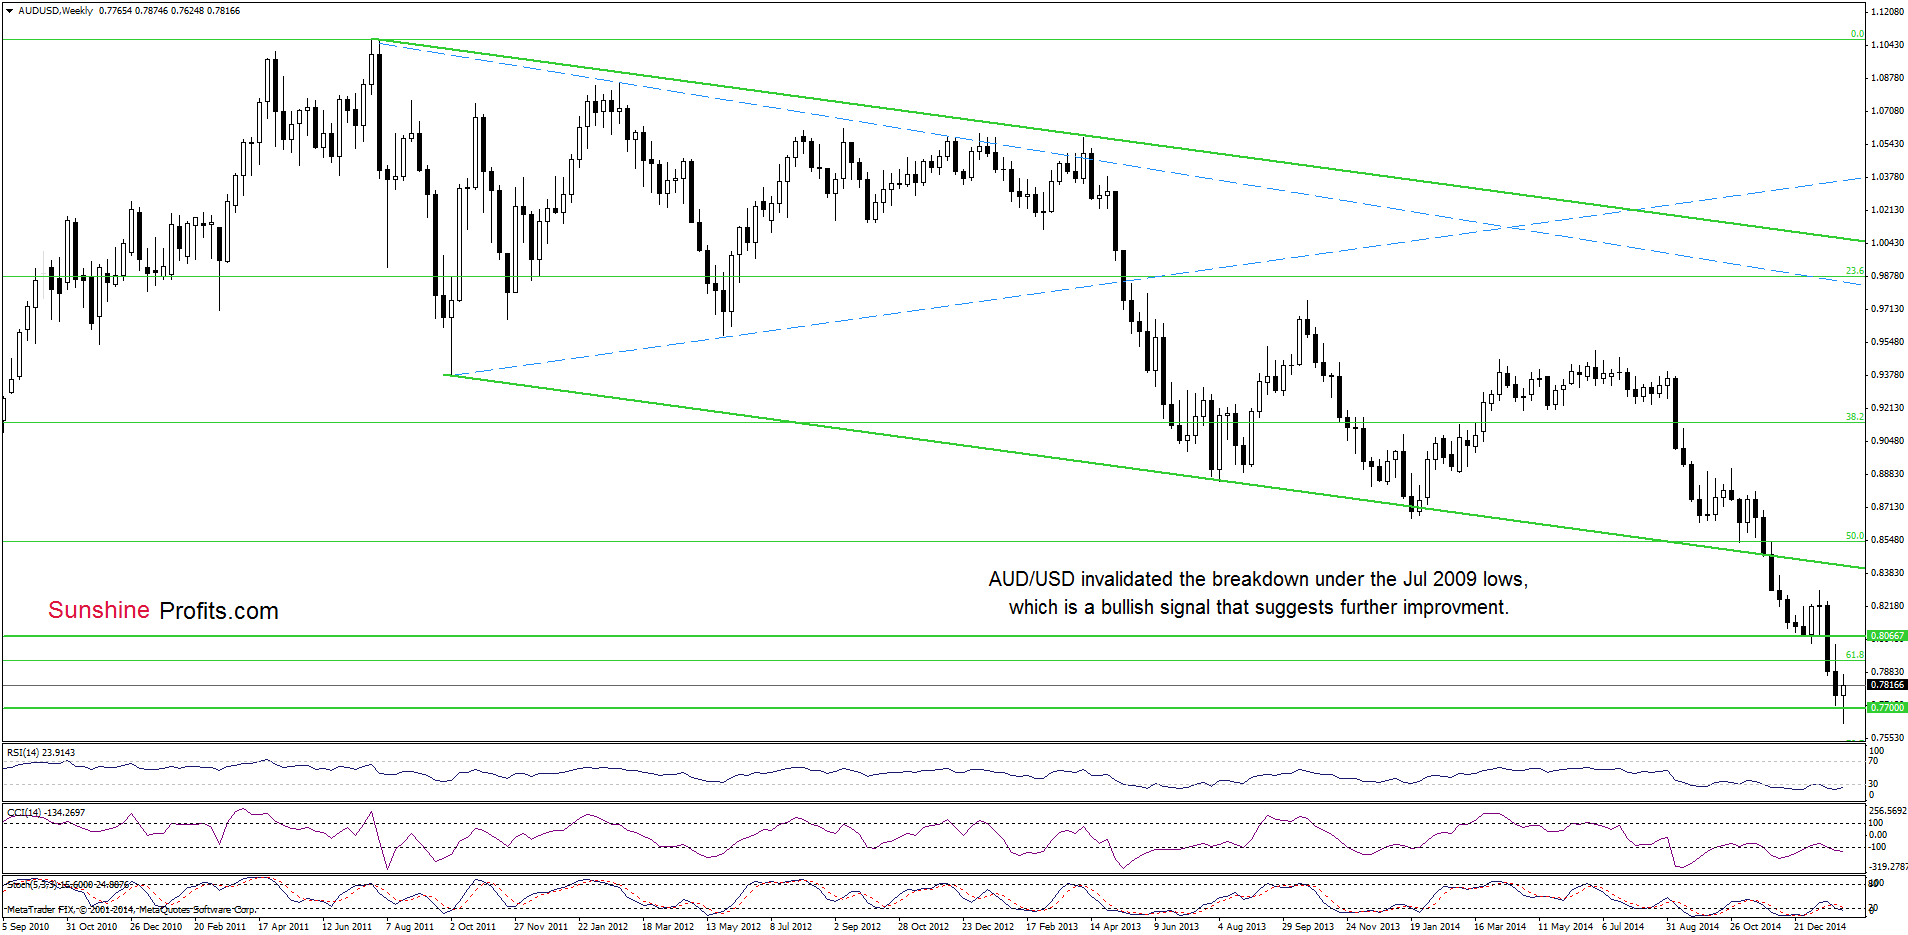
As you see on the weekly chart, an invalidation of the breakdown below the Jul 2009 lows and its potential positive impact on future moves is still in effect.
Having said that, let’s take a closer look at the daily chart.
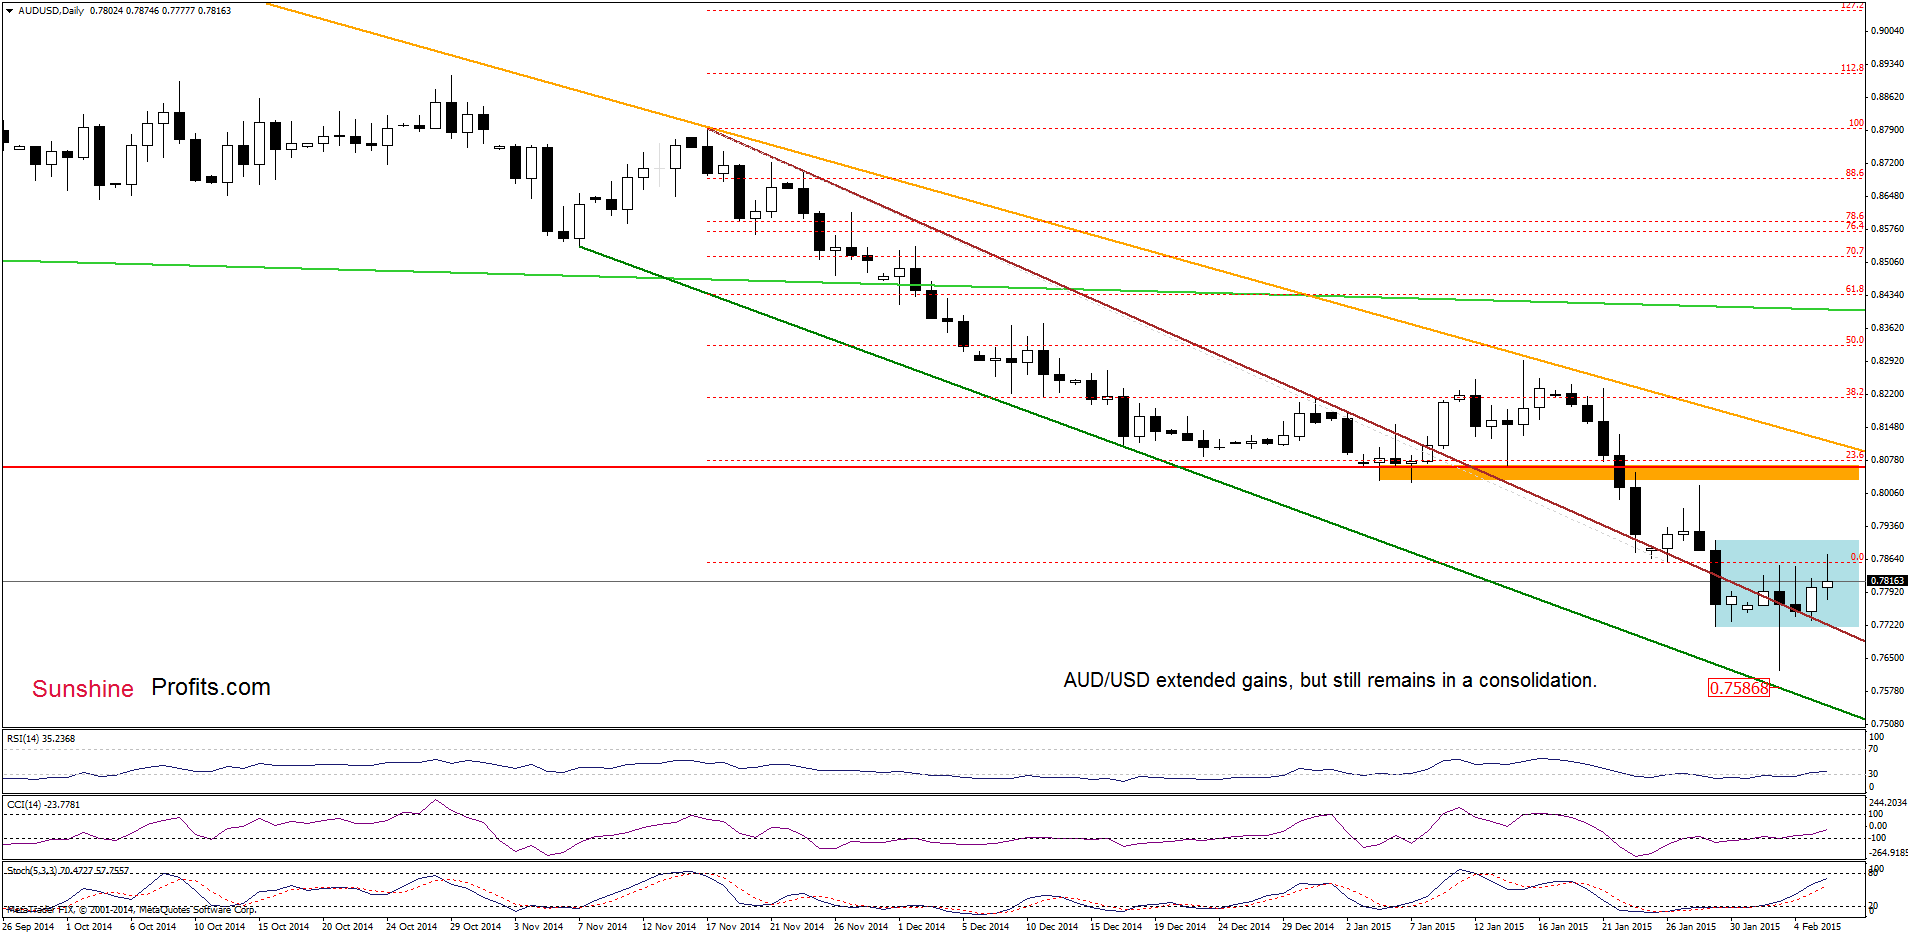
As you see on the above chart, AUD/USD extended gains and approached the upper line of the consolidation earlier today. Despite this improvement, the pair is still trading in a narrow range, which means that as long as there is no breakout above the Jan 29 high of 0.7905 further rally is not likely to be seen and another test of the brown support line can’t be ruled out.
Very short-term outlook: mixed
Short-term outlook: mixed
MT outlook: mixed
LT outlook: mixed
Trading position (short-term; our opinion): No positions are justified from the risk/reward perspective at the moment. We will keep you informed should anything change, or should we see a confirmation/invalidation of the above.
Thank you.
Nadia Simmons
Forex & Oil Trading Strategist
Przemyslaw Radomski, CFA
Founder, Editor-in-chief
Gold & Silver Trading Alerts
Forex Trading Alerts
Oil Investment Updates
Oil Trading Alerts

