
Earlier today, the data showed that the Chicago purchasing managers' index climbed to 59.4 in January, beating analysts’ expectation for a drop to 57.5. Tanks to these numbers, the USD Index moved higher climbing above 95. How did this increase affect the picture of major currency pairs? Did it change their outlooks?
In our opinion the following forex trading positions are justified - summary:
EUR/USD
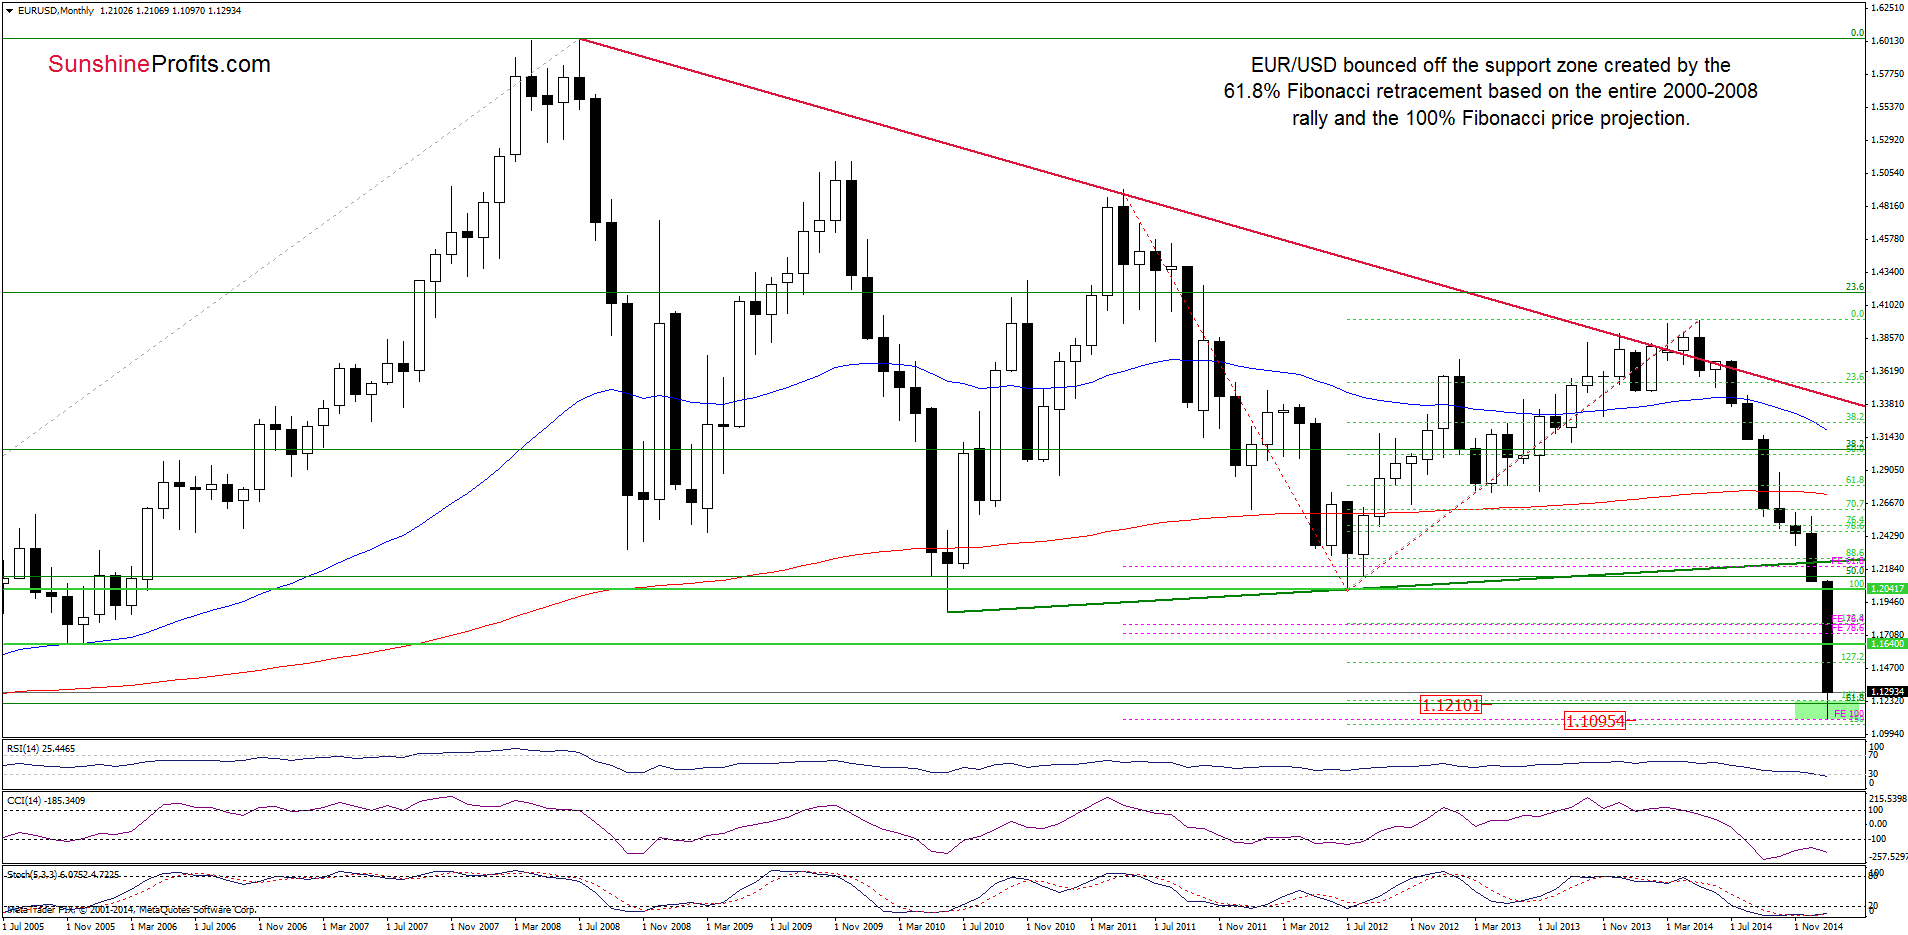
The medium-term picture hasn’t changed much as and invalidation of the breakdown below the 61.8% Fibonacci retracement and its positive impact on the exchange rate are still in effect. Having said that, let’s focus on the daily chart.
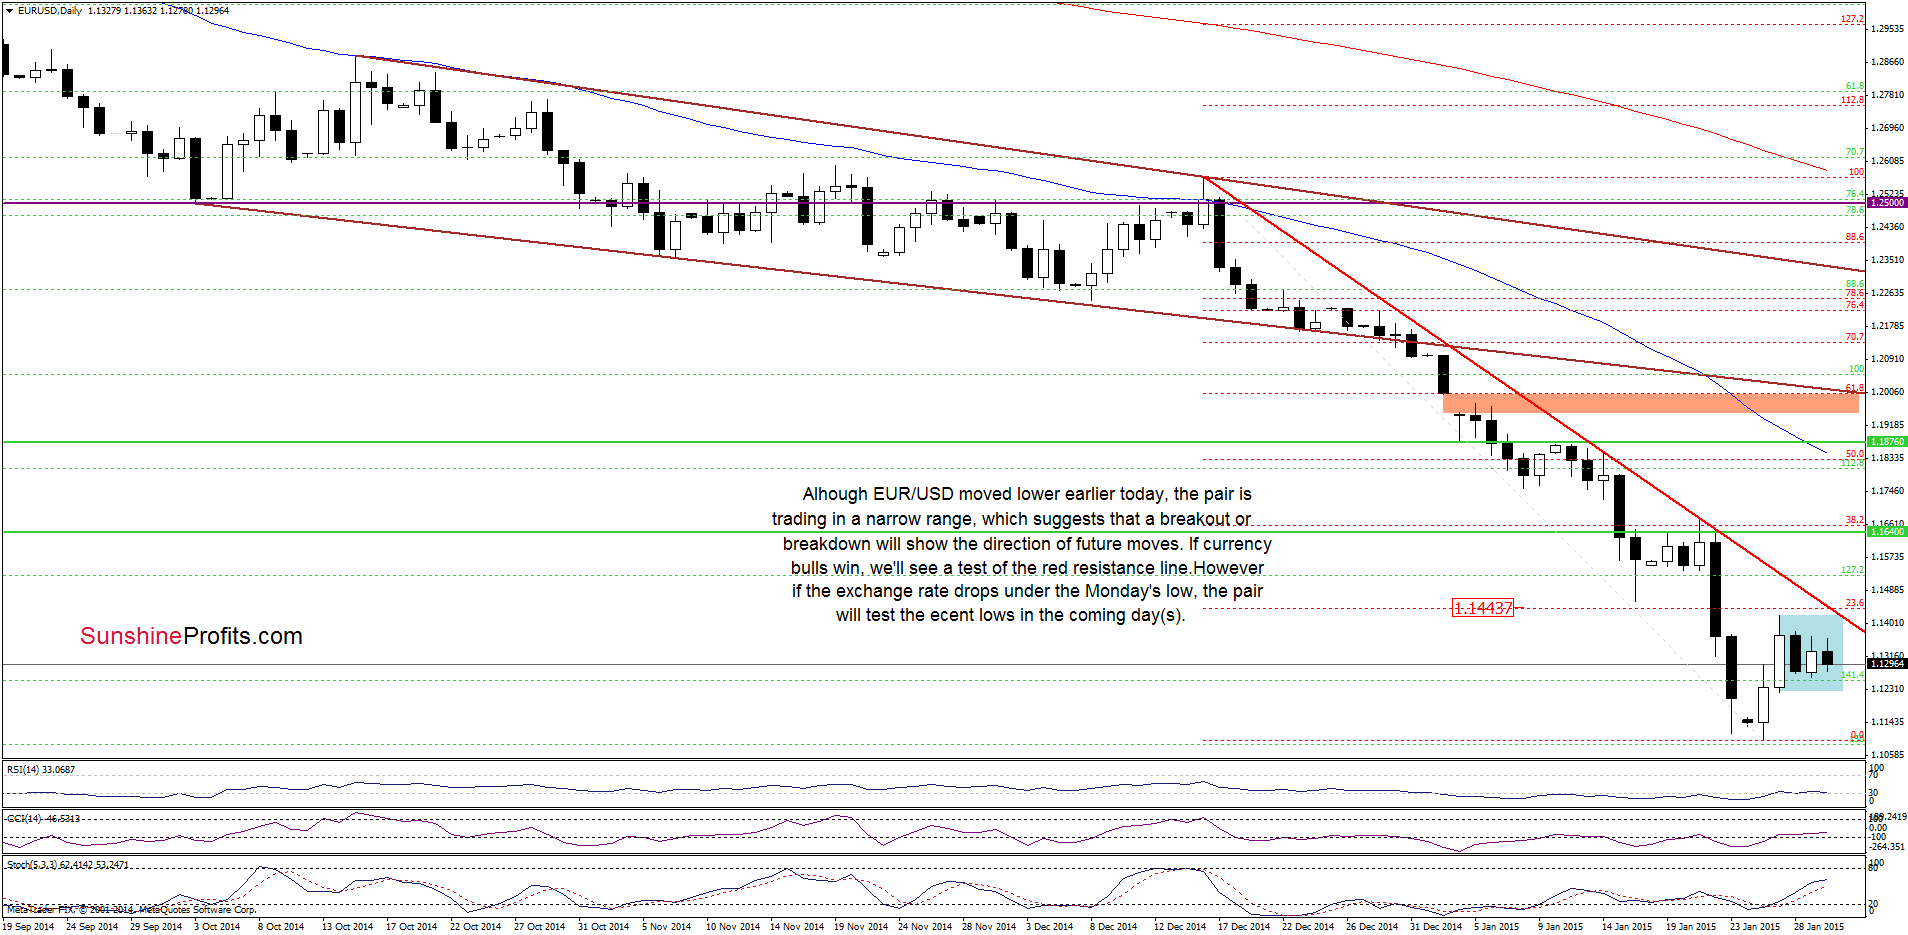
On the above chart, we see that although EUR/USD moved lower once again, the pair is trading in a narrow range between Monday’s high and low. Therefore, what we wrote yesterday is up-to-date:
(…) a breakout/breakdown will show the direction of future moves. If currency bulls win, we’ll see a test of the 23.6% Fibonacci retracement (based on the Dec 16-Jan 26 declines) and the red declining line (based on the Dec 16 and Jan 14 highs). On the other hand, if the exchange rate drops under 1.1223, the pair will likely test the recent lows in the coming day(s). Which scenario is more likely? As you see on the daily chart, buy signals generated by the indicators still support the bullish case. Nevertheless, (…) the red declining line based on the Dec 16 and Jan 14 highs (…) successfully stopped further improvement in the previous week, which suggests that we could see a similar price action (a pullback) in the near future.
Taking all the above into account, we think that the situation is too unclear to make any investment decision at the moment. However, if currency bulls manage to push the exchange rate above the nearest resistance area, we’ll consider opening long positions, because such price action would be a solid positive signal that will trigger an increase to around 1.1640, where the next resistance zone (created by the last week’s high and the previously-broken Nov 2005 low) is.
Very short-term outlook: mixed
Short-term outlook: mixed
MT outlook: mixed
LT outlook: mixed
Trading position (short-term): In our opinion, no positions are justified from the risk/reward perspective at the moment. However, if we see a successful breakout above the red declining line based on the Dec 16 and Jan 14 highs, we’ll consider opening long positions. We will keep you informed should anything change, or should we see a confirmation/invalidation of the above.
GBP/USD
Yesterday, we wrote:
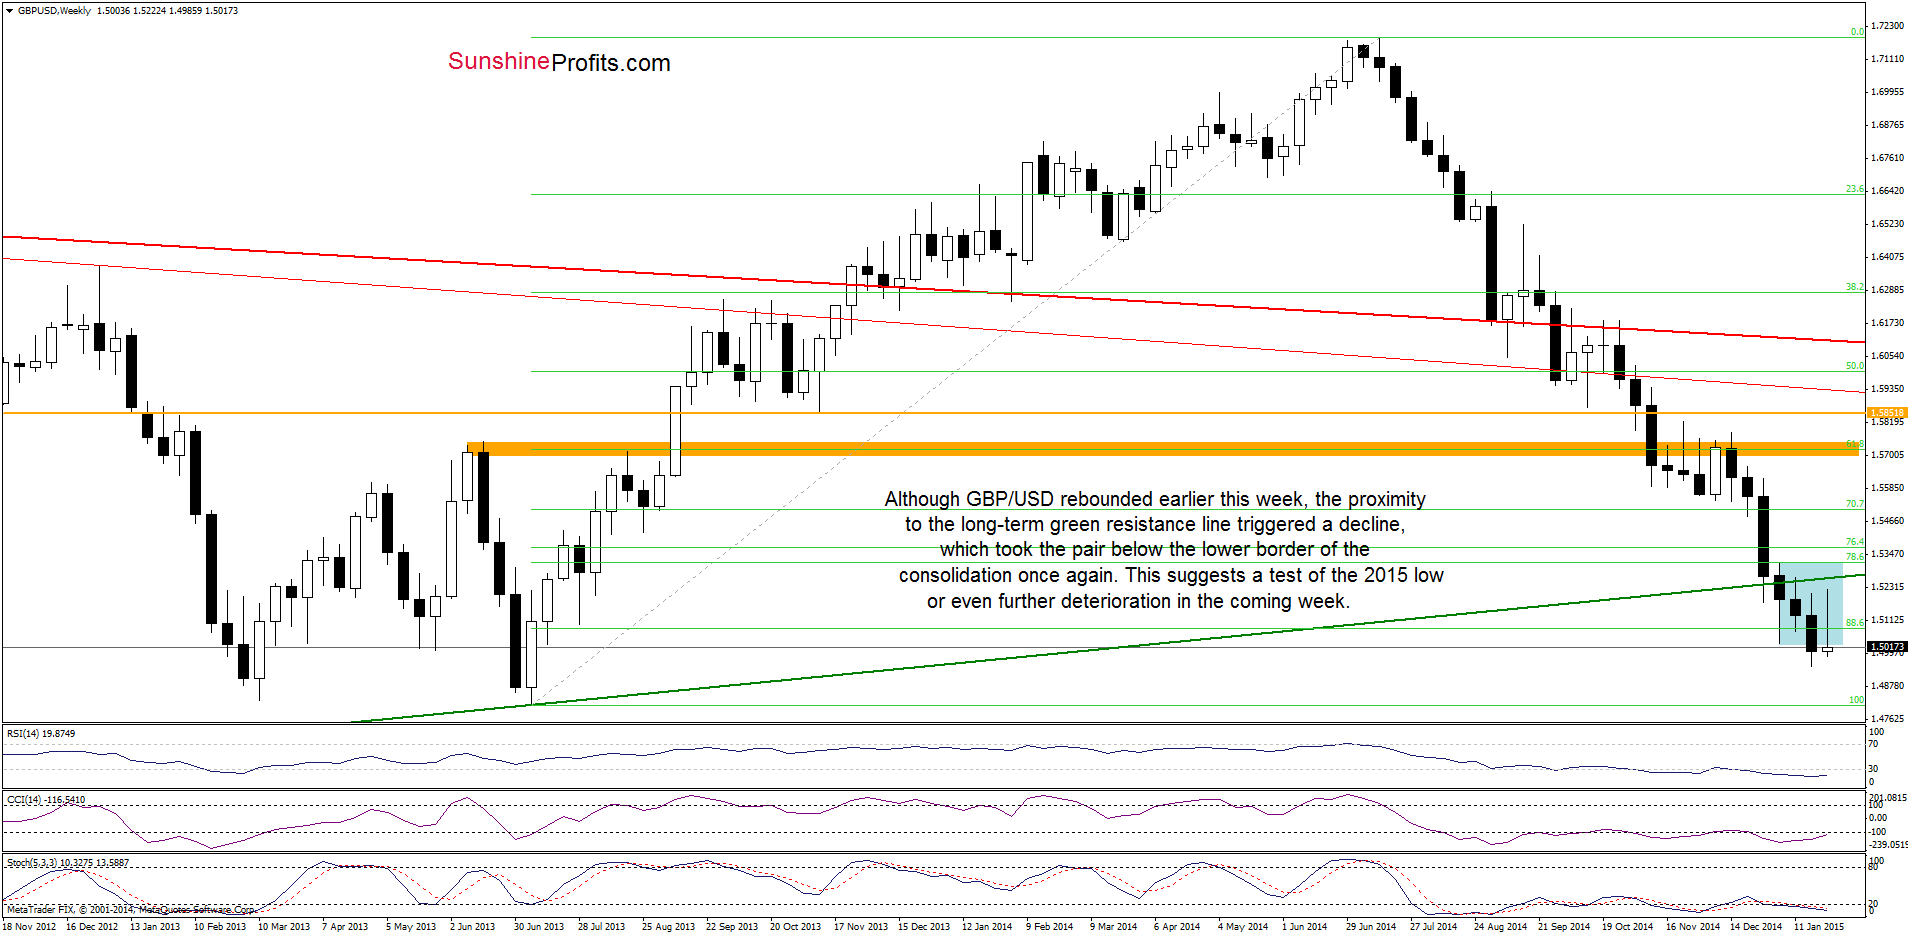
(…) although GBP/USD moved sharply higher earlier this week, invalidating the breakdown below the lower border of the consolidation (marked with blue on the weekly chart) and the breakdown under the medium-term green support/resistance line, the pair reversed and declined slightly – similarly to what we saw in the previous weeks.
(…) In all previous cases, currency bulls weren’t strong enough to push the pair higher, which triggered pullbacks. Taking this fact into account, and combining it with the medium-term picture, we think that as long as the exchange rate remains under the long-term resistance line (marked on the weekly chart) and the gap between the Jan 2 low and Jan 4 high is open further rally is questionable and another pullback to the medium-term green support/resistance line in the coming days is likely.
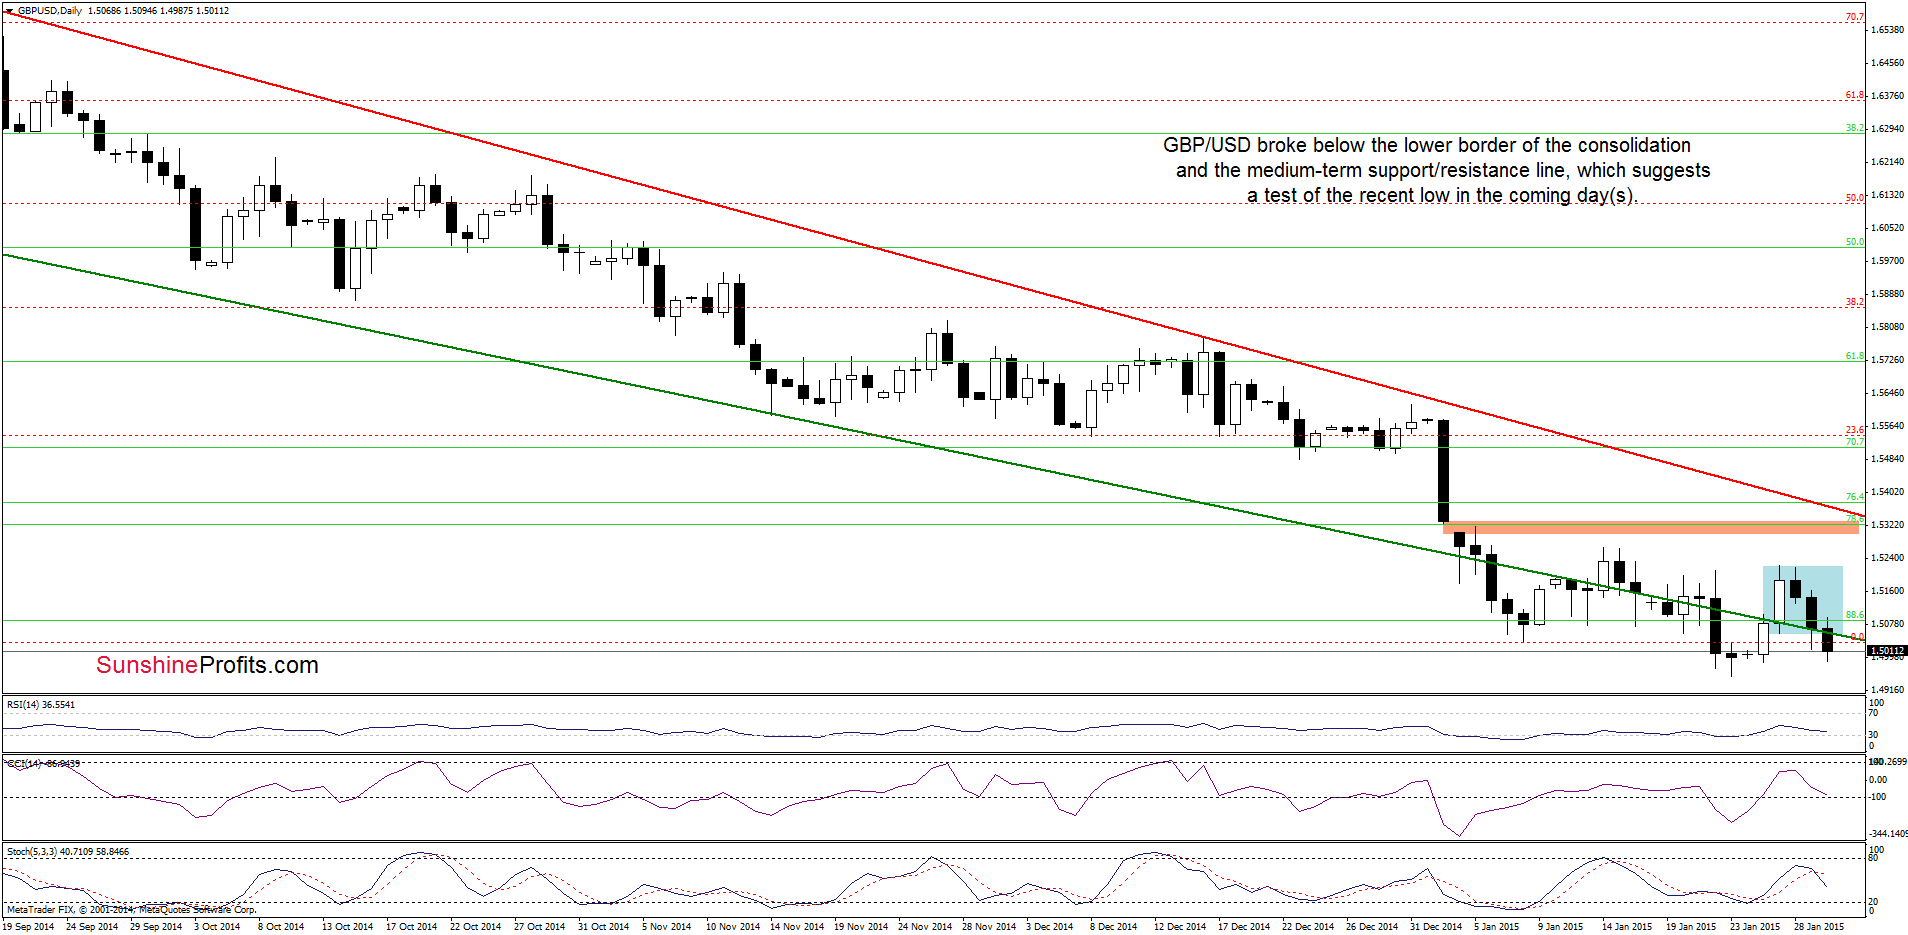
As you see on the daily chart, currency bulls not only took the pair to the medium-term green support/resistance line as we expected, but also managed pushed GBP/USD below it, which resulted in a breakdown below the lower border of the consolidation (marked with blue). This is a negative signal, which suggests further deterioration and a test of the recent low. Additionally, today’s downswing resulted in a drop under the lower line of the consolidation (marked with blue on the weekly chart), which increases the likelihood of further declines (especially if the pair closes the week under this line).
Very short-term outlook: mixed with bearish bias
Short-term outlook: mixed
MT outlook: mixed
LT outlook: mixed
Trading position (short-term): In our opinion, no positions are justified from the risk/reward perspective at the moment. We will keep you informed should anything change, or should we see a confirmation/invalidation of the above.
USD/JPY
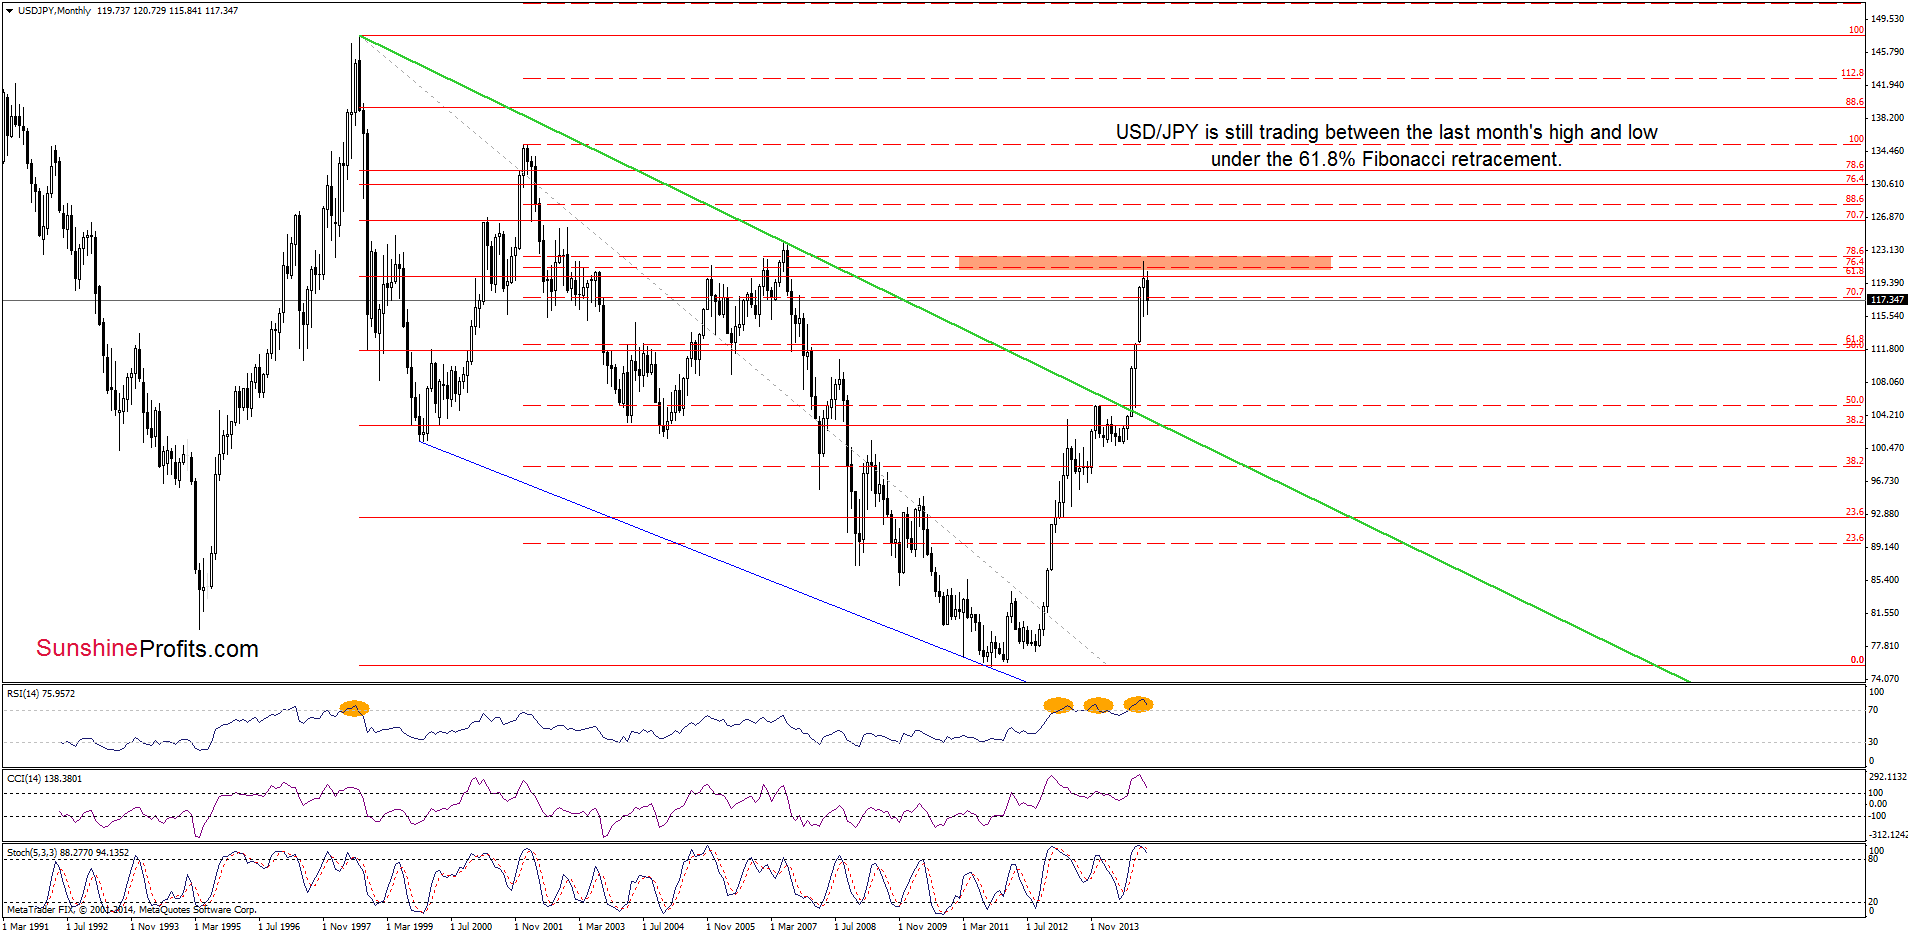
The situation in the medium-term hasn’t changed much as USD/JPY is still trading between the last month’s high and low, under the 61.8% Fibonacci retracement.
Will the daily chart give us more clues about future moves? Lets check.
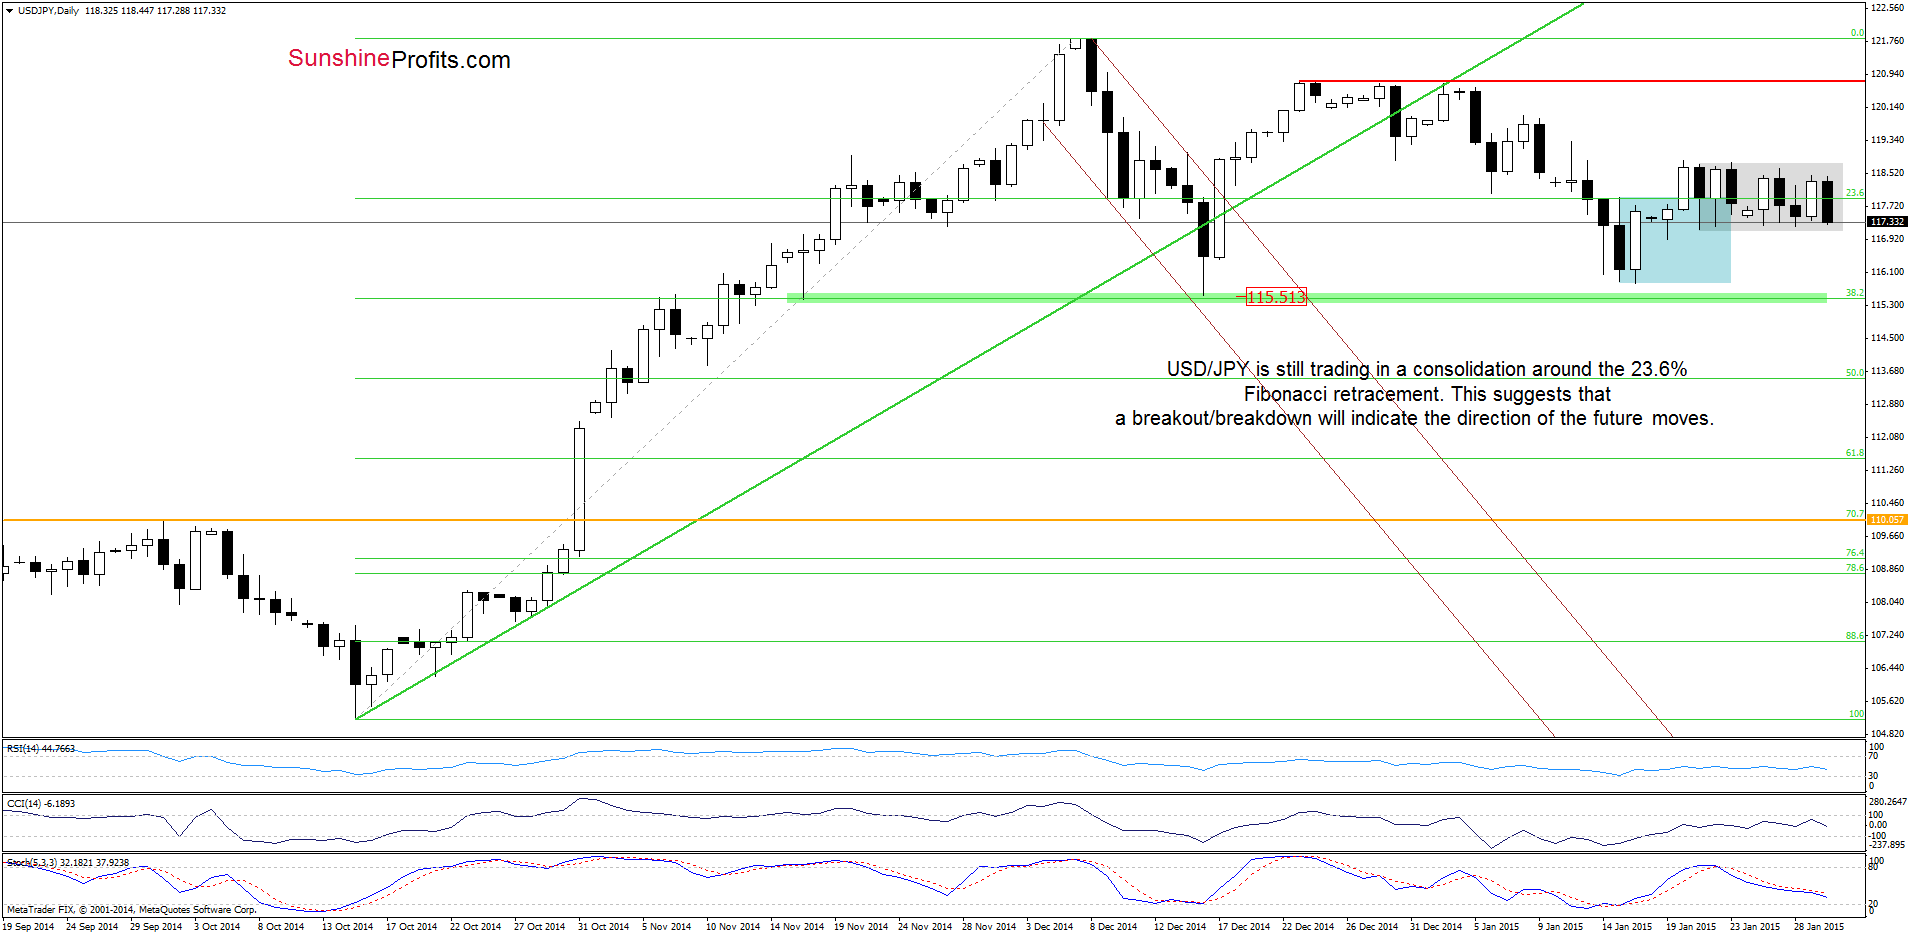
Looking at the above chart, we see that USD/JPY is still trading in a narrow range around the 23.6% Fibonacci retracement. Therefore, what we wrote on Wednesday is up-to-date:
(…) a breakout/breakdown will indicate the direction of the future moves. However, taking into account an invalidation of the breakout above the upper border of the previous consolidation (marked with blue), it seems that the pair will test the Jan 21 low of 117.17 (the lower line of the current consolidation). If it holds (and the Stochastic Oscillator generates a buy signal), we’ll see a rebound and an increase to at least 118.80, but if it’s broken, USD/JPY will test the Jan lows in the coming day(s).
Very short-term outlook: mixed
Short-term outlook: mixed
MT outlook: mixed
LT outlook: bullish
Trading position (short-term; our opinion): No positions are justified from the risk/reward perspective at the moment. We will keep you informed should anything change, or should we see a confirmation/invalidation of the above.
USD/CAD
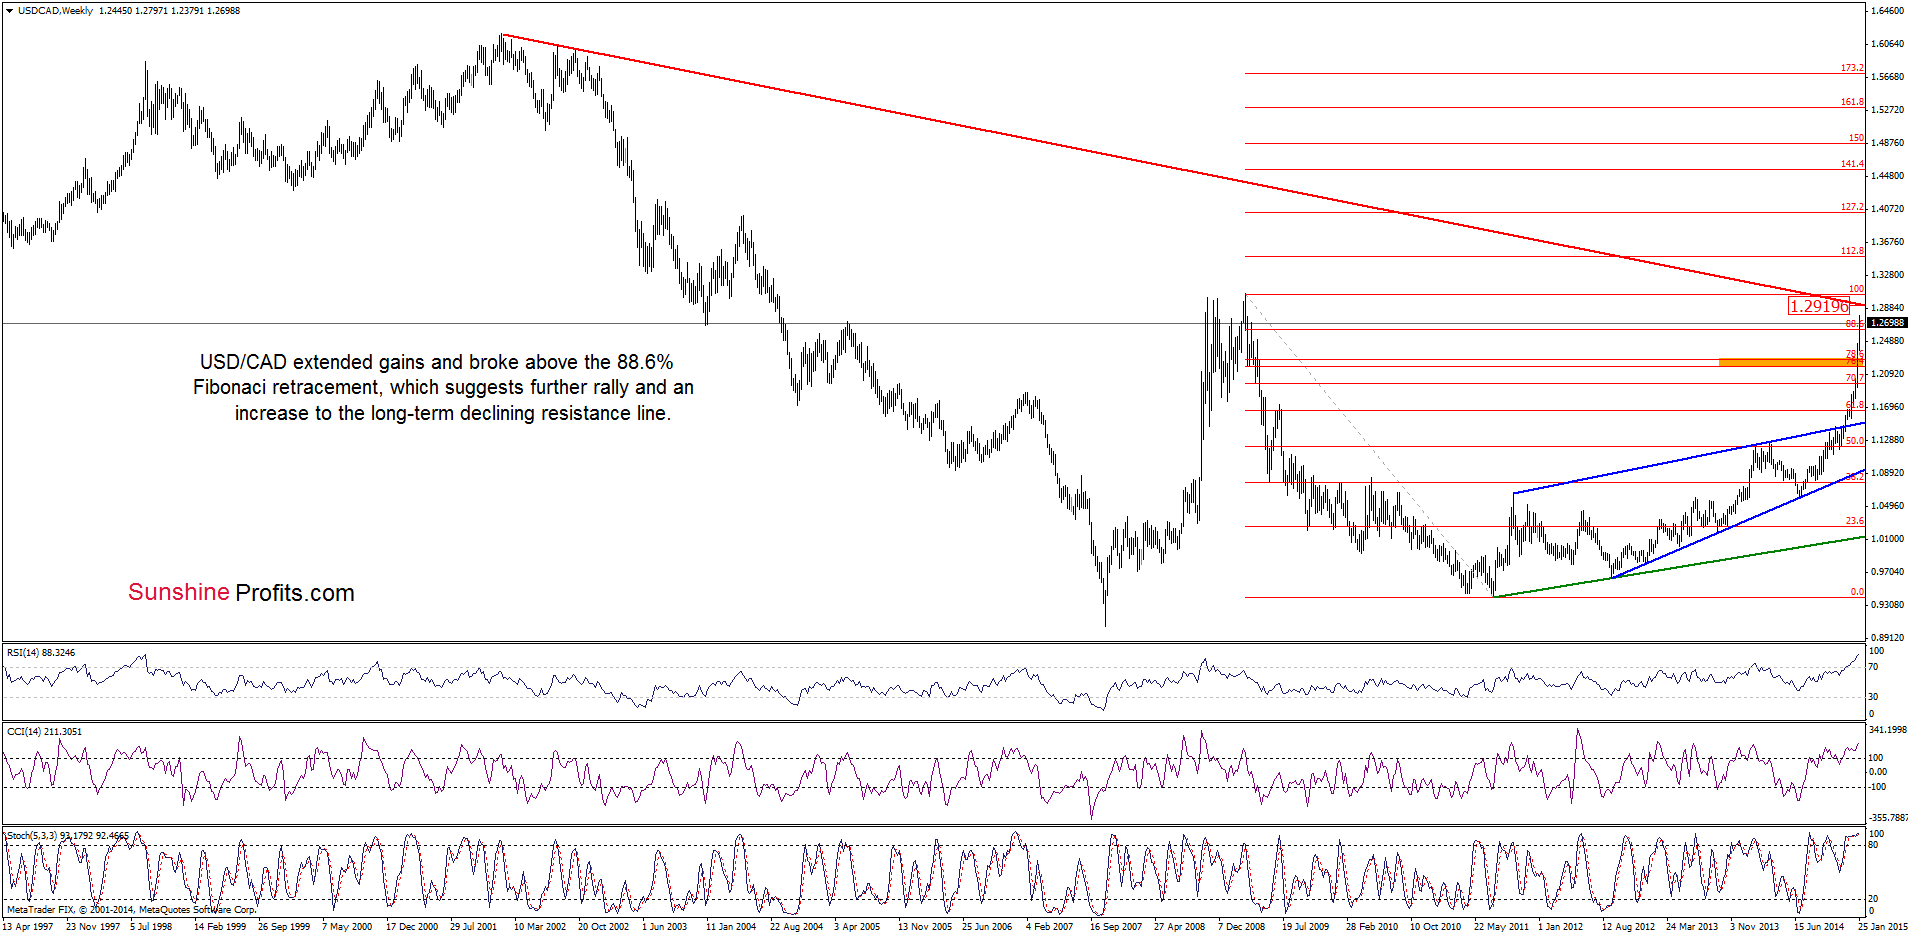
In our Forex Trading Alert posted on Jan 23, we wrote:
(…) USD/CAD broke above the orange resistance zone which suggests further improvement and an increase to around 1.2628, where the 88.6% Fibonacci retracement is. Nevertheless, before currency bulls realize this scenario, they will have to push the pair above 1.2585-1.2600, where the nearest resistance zone (created by the 300% Fibonacci extension and the long-term blue line based on the Jan 2002 and Sep 2002 highs) is.
On Wednesday, we added:
(…) although USD/CAD corrected the recent rally, yesterday’s pullback is very shallow (compared to earlier gains) and the pair is still trading above the previously-broken 261.8% Fibonacci extension and the orange resistance zone (marked on the weekly chart). This means that as long as there is no invalidation of the breakout above these levels, another attempt to move higher can’t be ruled out. If this is the case, the bullish scenario from our Forex Trading Alert posted on Friday will be in play.
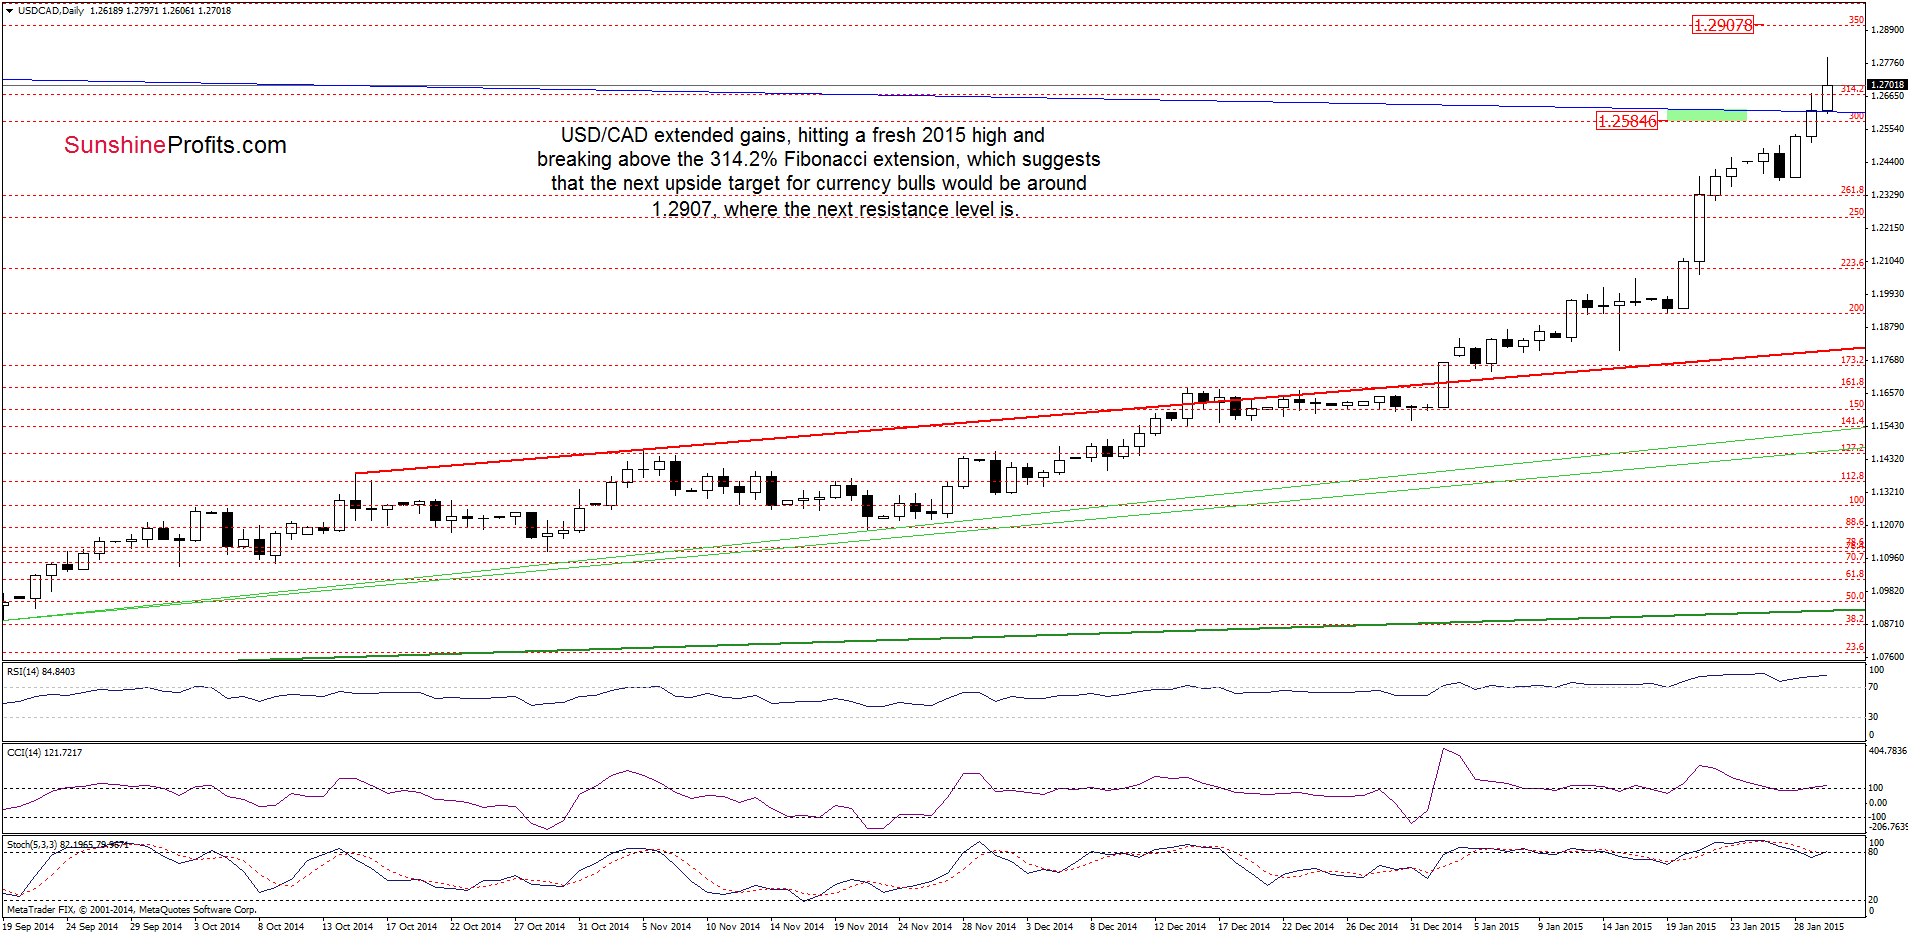
Looking at the charts, we see that the situation developed in line with the above-mentioned scenario and USD/CAD extended gains, increasing above our upside targets earlier today. This is a bullish sign, which suggests further rally and an increase to around 1.2907-1.2919, where the next resistance zone (created by the 350% Fibonacci extension and the long-term red declining resistance line based on the Jan and Sep highs) is.
Very short-term outlook: bullish
Short-term outlook: mixed with bullish bias
MT outlook: mixed
LT outlook: mixed
Trading position (short-term; our opinion): No positions are justified from the risk/reward perspective at the moment. We will keep you informed should anything change, or should we see a confirmation/invalidation of the above.
USD/CHF
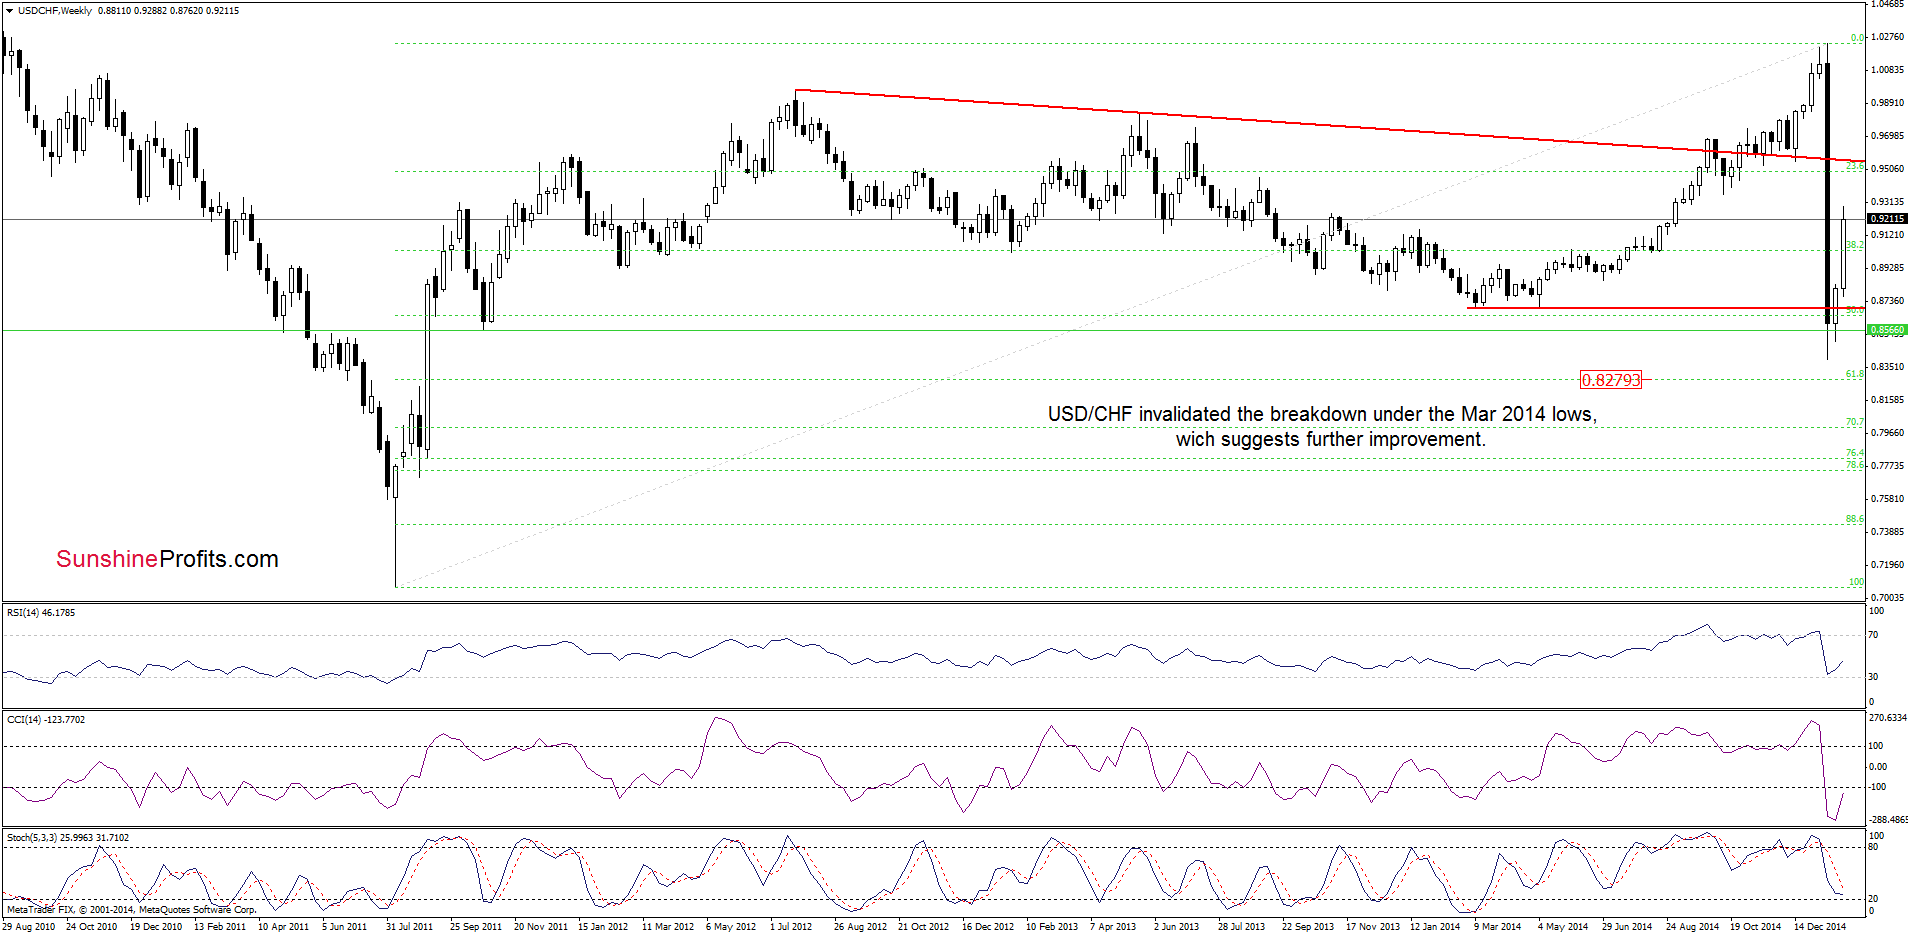
The situation in the medium-term has’t changed much as an invalidation of the breakdown below the Mar 2014 lows and its postive impact on cutent moves is still in play.
What can we infer from the daily chart? Let’s find out.
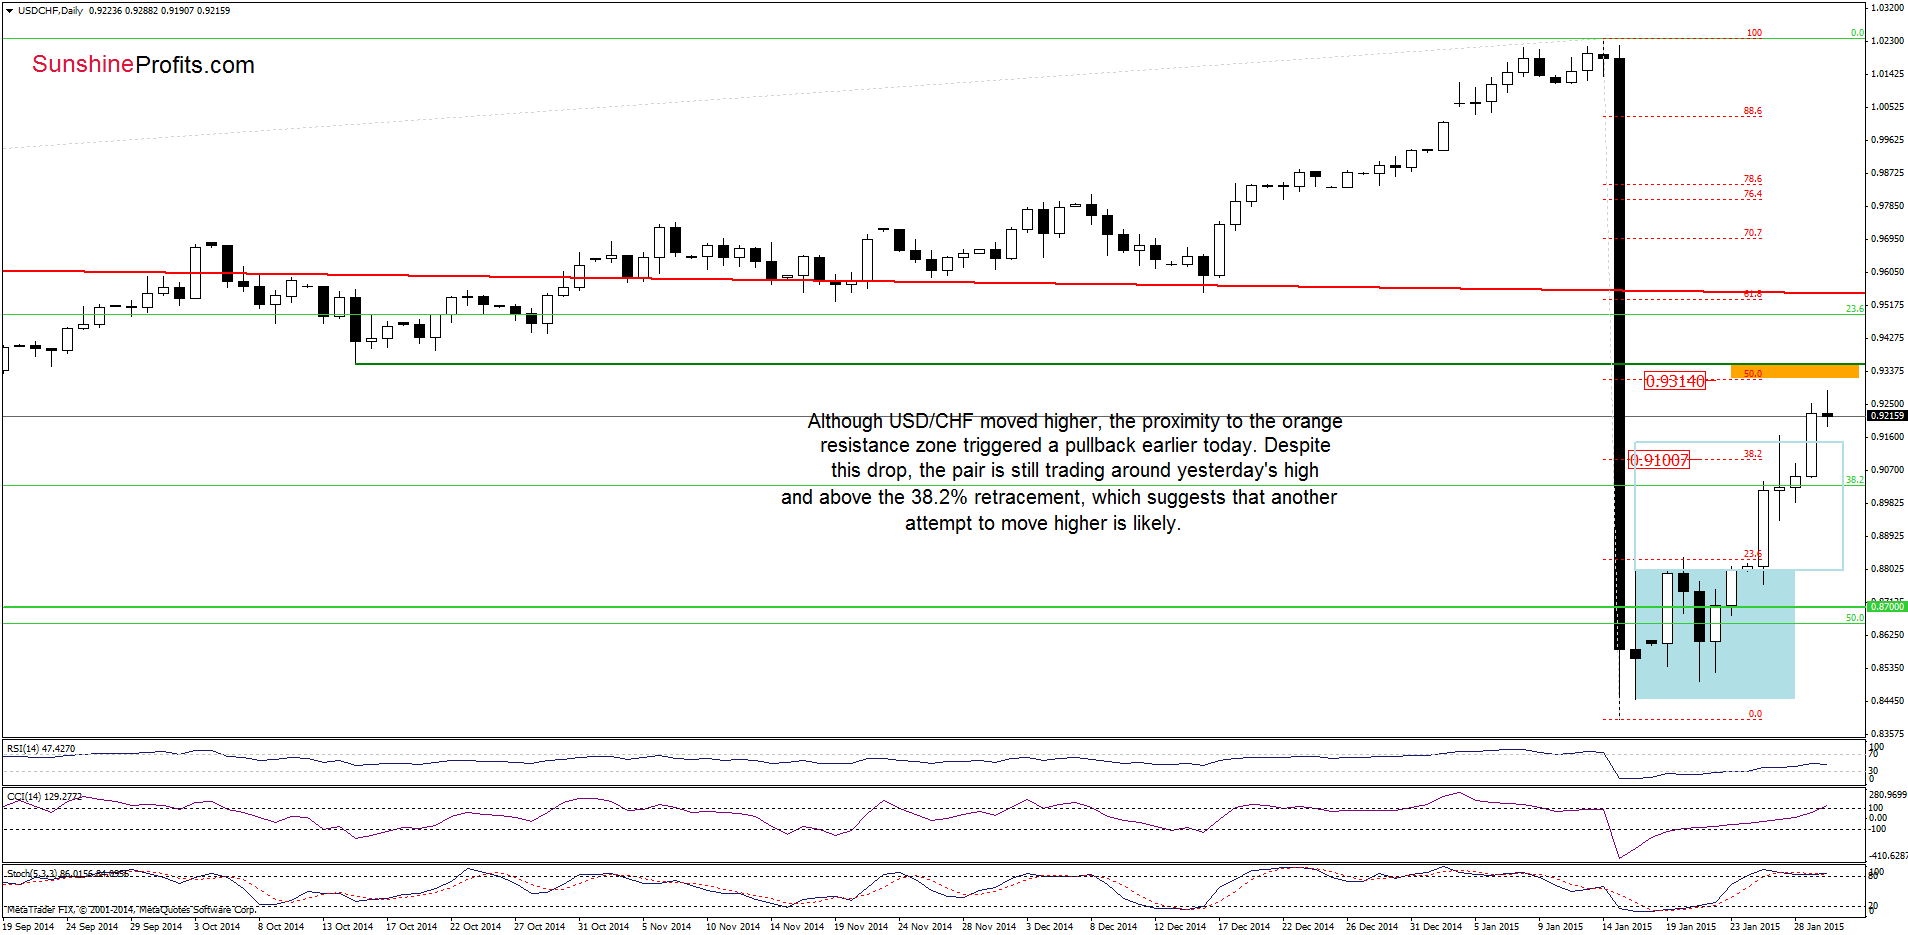
Quoting our Forex Trading Alert posted last Friday:
(…) currency bulls (…) push the pair above the 38.2% Fibonacci retracement. This is another positive signal that suggests further improvement and an increase to at least 0.9314, where the next Fibonacci retracement is.
On the daily chart, we see that although USD/CHF approached our upside target, the proximity to the orange resistance zone (created by the 50% Fibonacci retracement and the Oct 2014 low) triggered a pullback earlier today. Despite this drop, the pair is still trading around yesterday’s high and above the previously-broken 38.2% Fibonacci retracement, which suggests that another attempt to move higher is likely.
Very short-term outlook: bullish
Short-term outlook: mixed
MT outlook: mixed
LT outlook: bearish
Trading position (short-term; our opinion): No positions are justified from the risk/reward perspective at the moment. We will keep you informed should anything change, or should we see a confirmation/invalidation of the above.
AUD/USD
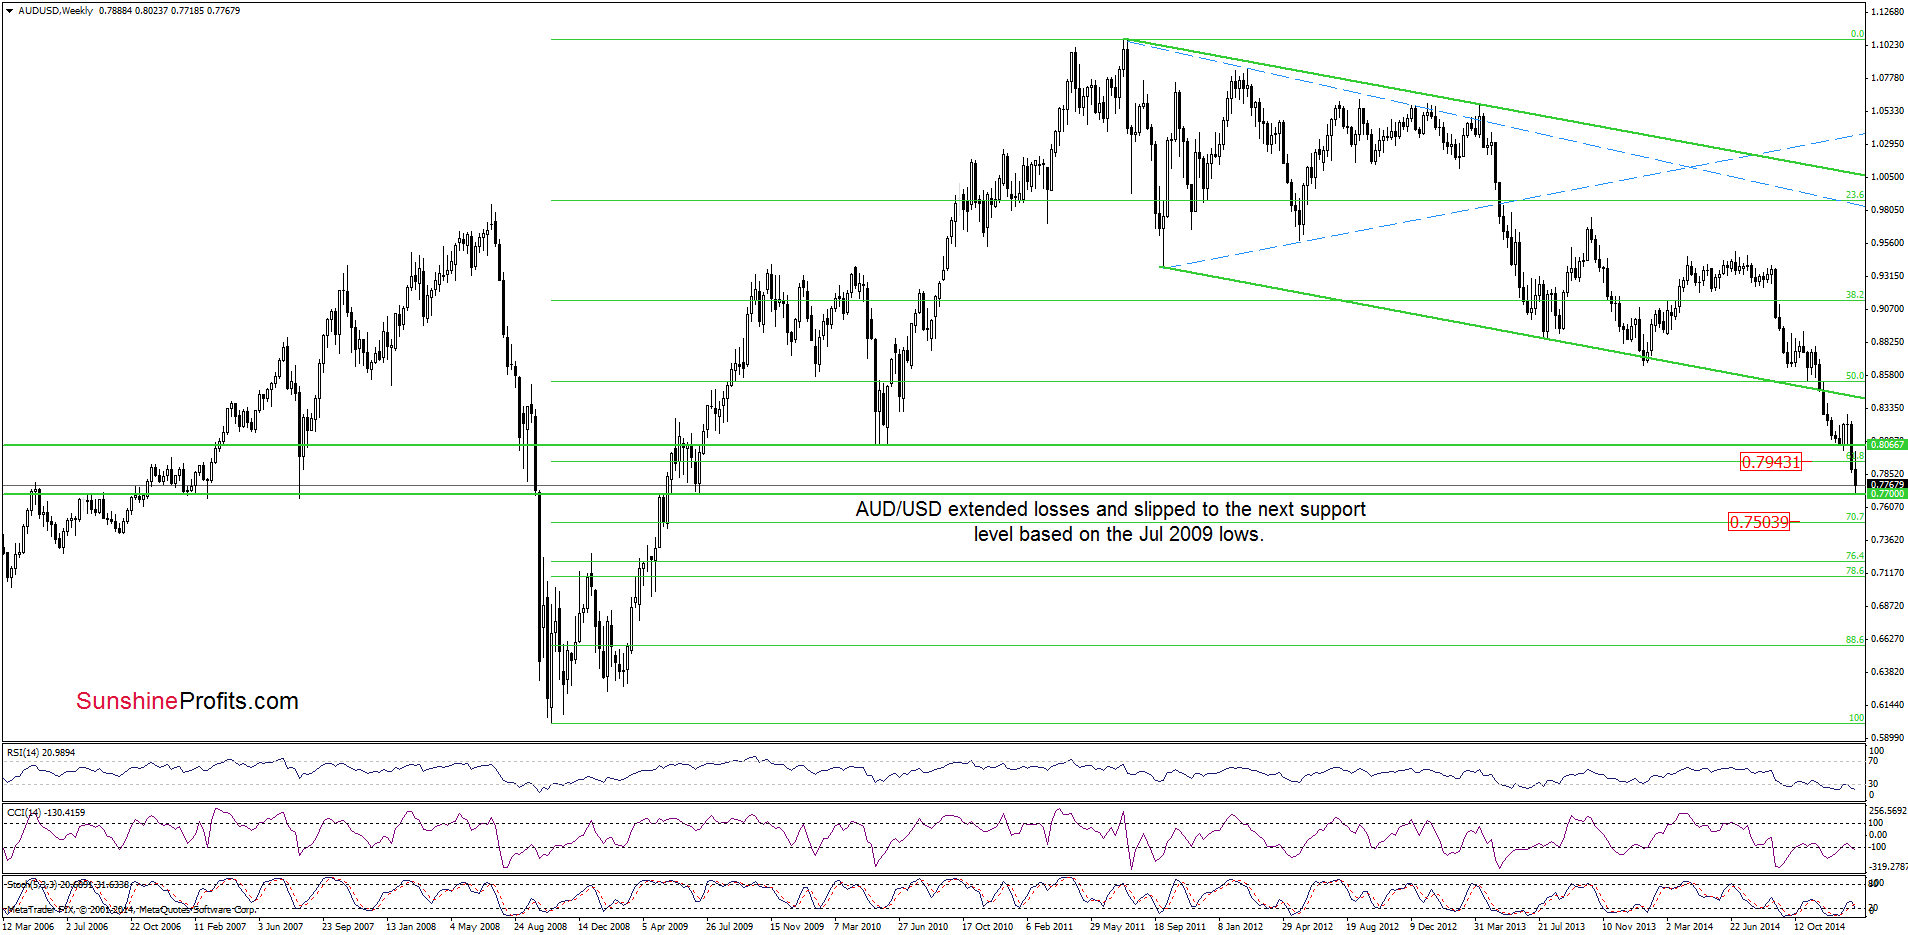
Quoting our last commentary on this currency pair:
(…) AUD/USD bounced off the previously-broken upper line of the declining trend channel. With this upward move, the exchange rate invalidated also the breakdown under the 61.8% Fibonacci retracement (seen on the weekly chart). All the above provides us with bullish implications, suggesting further improvement and an increase to around the previous Jan lows (marked with orange).
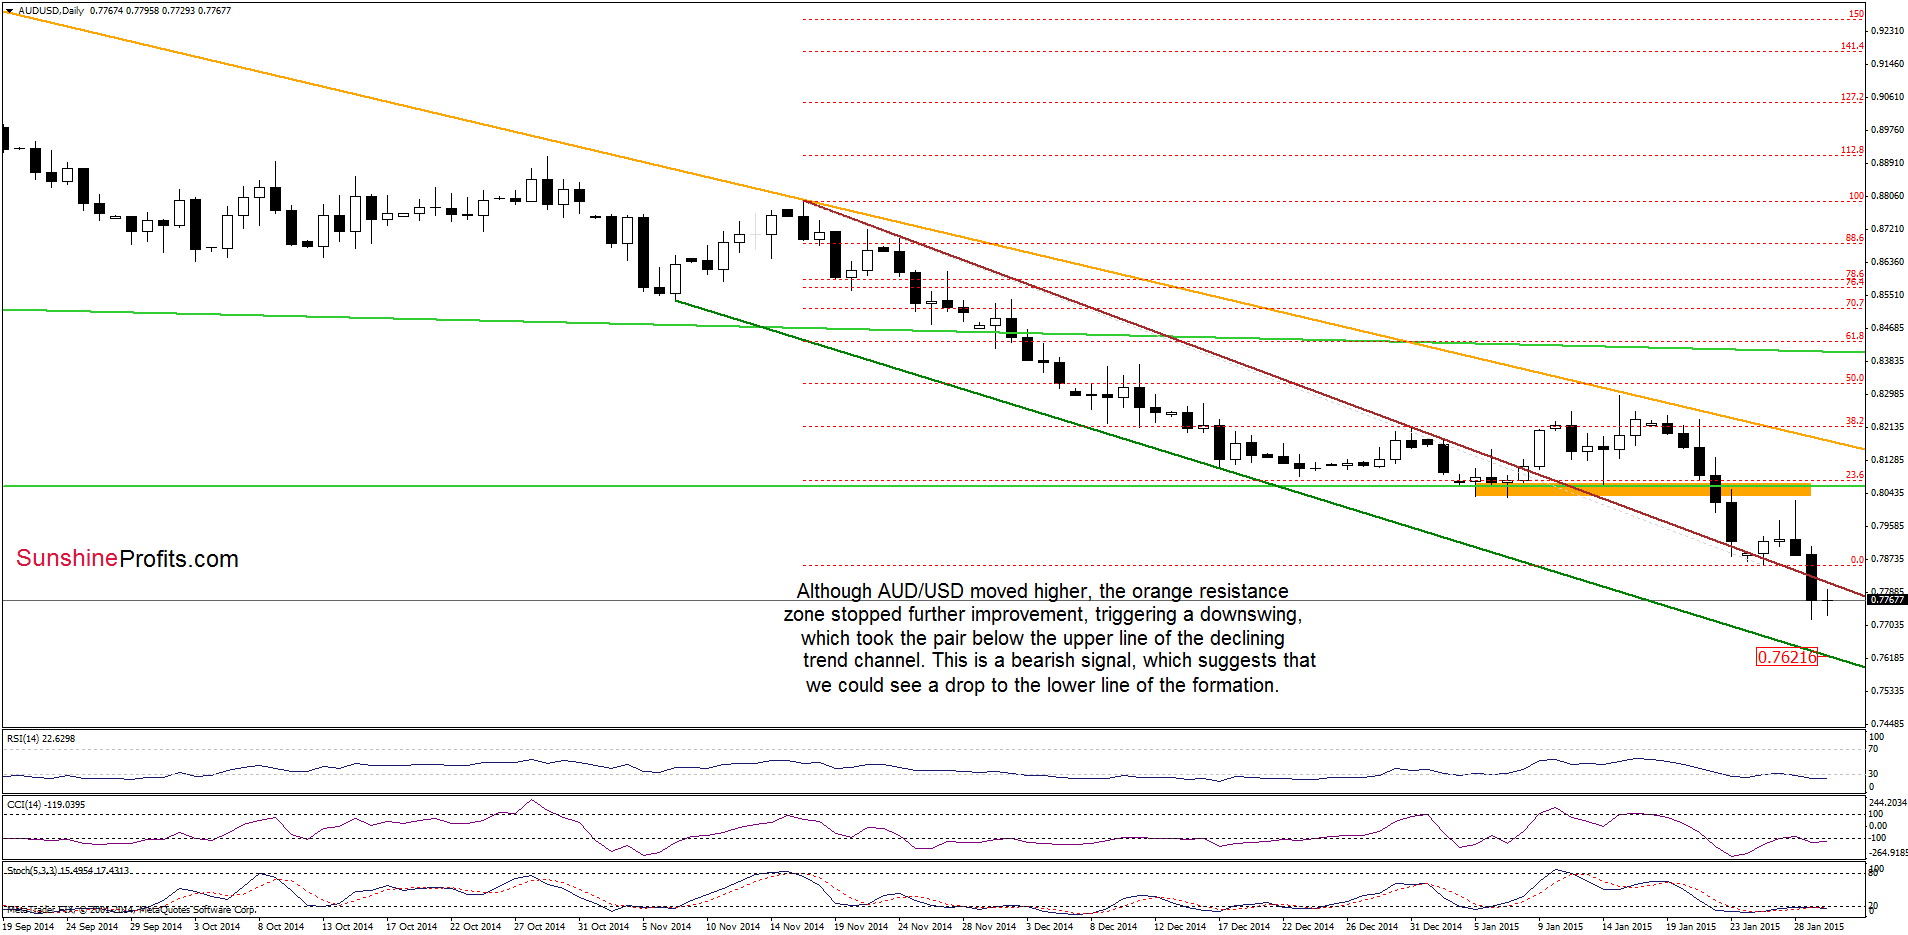
From today’s point of view, we see that the situation developed in line with the above mentioned scenario and AUD/USD approached our upside target. Despite this improvement, currency bulls weren’t strong enough to push the pair higher, which translated to a downswing that took the pair below the upper line of the declining trend channel and a fresh 2015 low. As you see on the weekly chart, with this downswing the exchange rate approached the support level based on the Jul 2009 lows. If this area encourages currency bulls to act, we’ll see an attempt to comeback above the upper line of the trend channel. However, if it is broken, the next downside target would be around 0.7621, where the lower line of the formation is.
Very short-term outlook: mixed
Short-term outlook: mixed
MT outlook: mixed
LT outlook: mixed
Trading position (short-term; our opinion): No positions are justified from the risk/reward perspective at the moment. We will keep you informed should anything change, or should we see a confirmation/invalidation of the above.
Thank you.
Nadia Simmons
Forex & Oil Trading Strategist
Przemyslaw Radomski, CFA
Founder, Editor-in-chief
Gold & Silver Trading Alerts
Forex Trading Alerts
Oil Investment Updates
Oil Trading Alerts

