
Earlier today, data showed that Germany’s services PMI dropped to a 16-month low of 52.1 in November, while the composite PMI dropped to a 17-month low of 51.7. Additionally, the French composite PMI fell to a nine-month low of 47.9, missing analysts’ expectations. On top of that, euro zone’s composite purchasing managers’ index dropped to 51.1 last month from 52.1 in October. These bearish numbers pushed EUR/USD lower, which resulted in a fresh 2014 low. How low could the exchange rate go in the coming days?
In our opinion the following forex trading positions are justified - summary:
EUR/USD
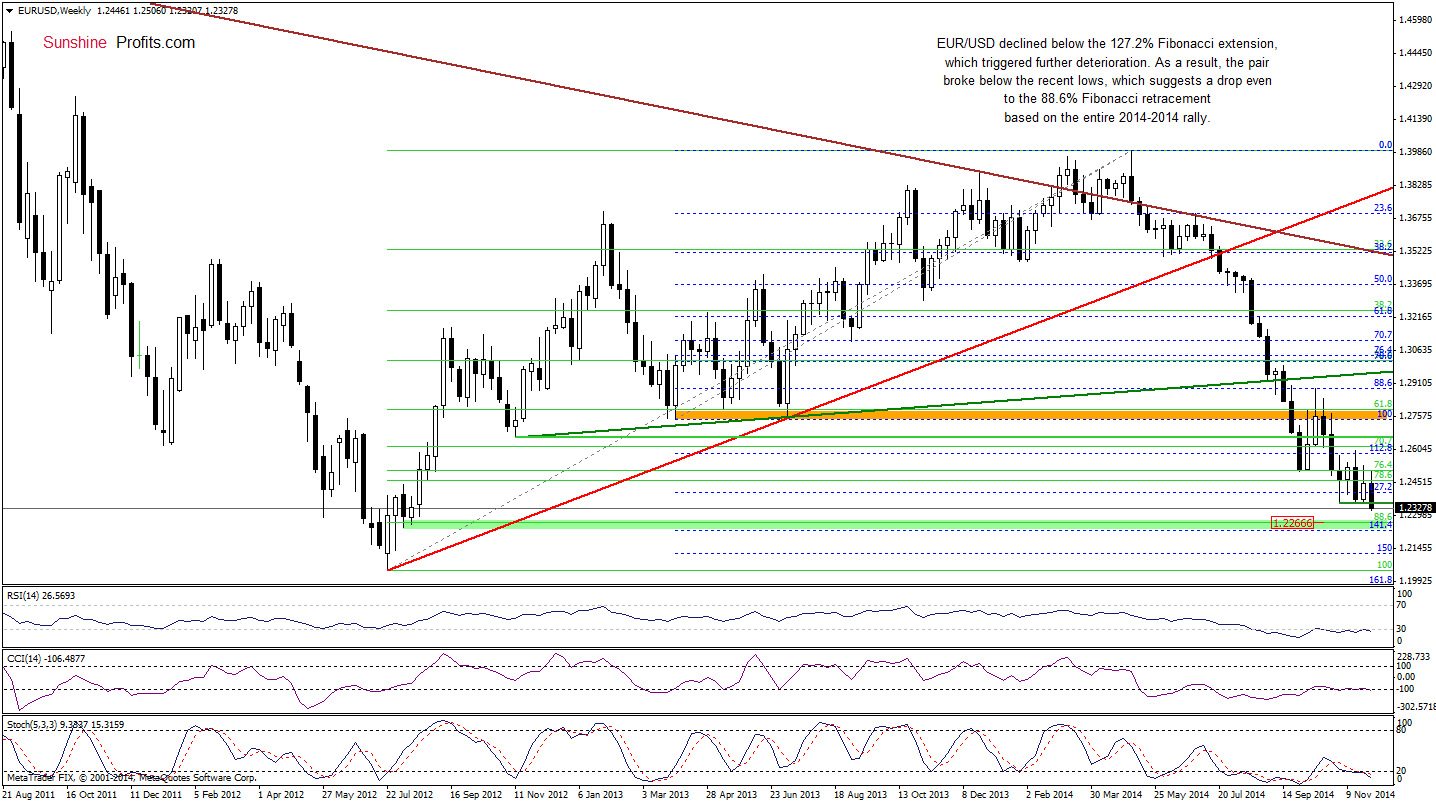
The medium-term picture has deteriorated as EUR/USD declined below the 127.2% Fibonacci extension and the recent lows. This breakdown suggests that we could see a drop even to around 1.2266, there the 88.6% Fibonacci retracement based on the entire 2012-2014 rally is.
Are there any short-term supports that could hinder a realization of the above-mentioned scenario? Let’s examine the daily chart and find out.
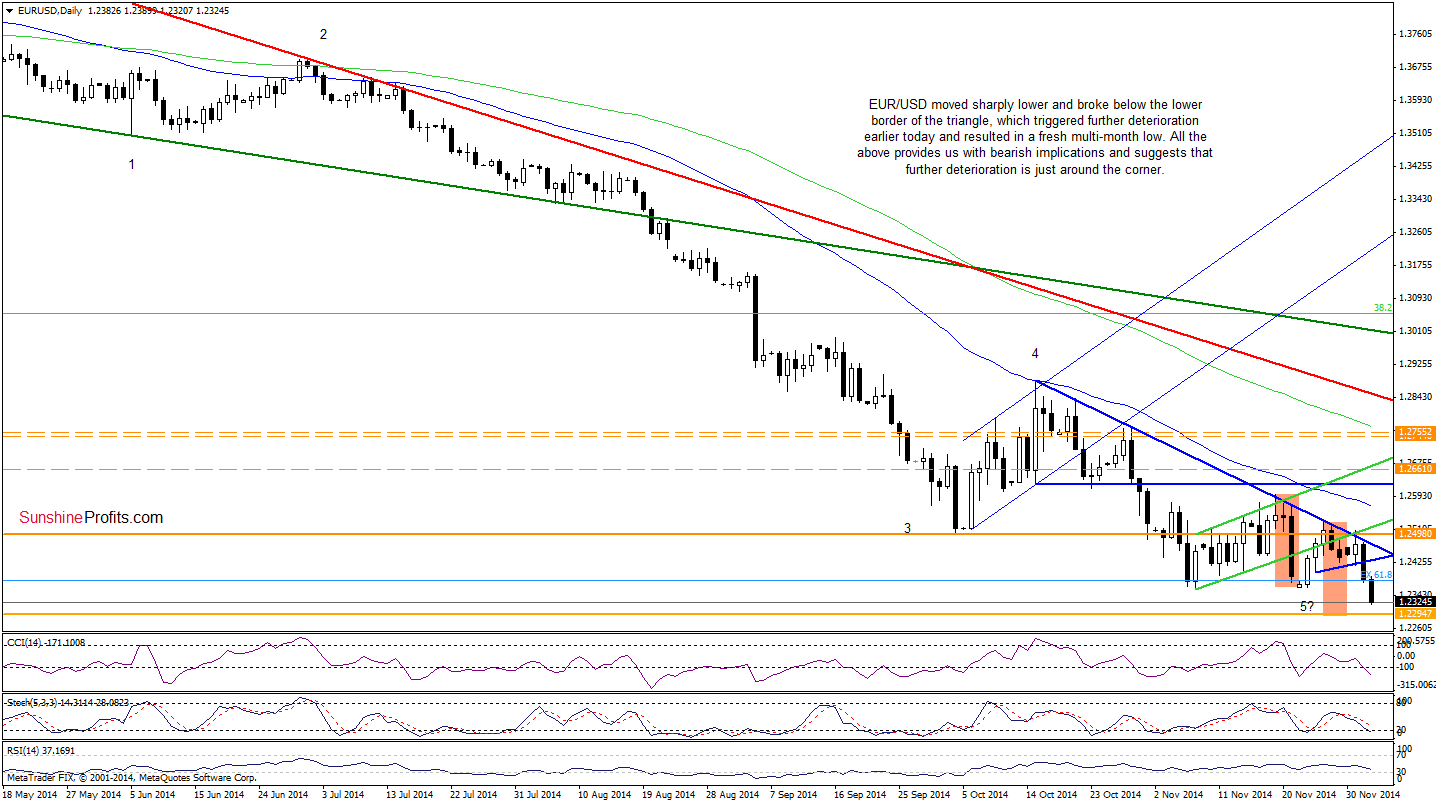
In our last Forex Trading Alert we wrote the following:
(…) the combination of the lower border of the rising trend channel and the declining blue resistance line stopped further improvement, triggering a pullback (…) when we take a closer look at the daily chart, we can see that the exchange rate has been trading in a triangle (marked with blue) in the recent days. This means that if the pair drops below the lower line of the formation, we’ll see a test of the strength of Nov 25 low of 1.2399. However, taking into account the height of the triangle, it seem that we could even see a drop to the recent lows in the coming week.
Looking at the daily chart, we see that currency bears not only realized the above-mentioned scenario as we expected, but also managed to push the exchange rate to a fresh 2014 low. Will we see further deterioration? When we take into account the current position of the indicators, we think that the answer is: yes. In our opinion, the initial downside target will be around 1.2292, where the size of the recent downward move will correspond to the downswing that we saw between Nov 19 and Nov 23 (both moves marked with orange). At this point, it’s worth noting that this area is also supported by the 127.2% Fibonacci extension based on the Nov 7- Nov 19 rally, which could pause further deterioration. However, taking into account the current position of the indicators, it seems that a drop to the above-mentioned 88.6% Fibonacci retracement (marked on the weekly chart) can’t be ruled out.
Very short-term outlook: mixed with bearish bias
Short-term outlook: mixed with bearish bias
MT outlook: mixed
LT outlook: bearish
Trading position (short-term): In our opinion, no positions are justified from the risk/reward perspective at the moment. We will keep you informed should anything change, or should we see a confirmation/invalidation of the above.
GBP/USD
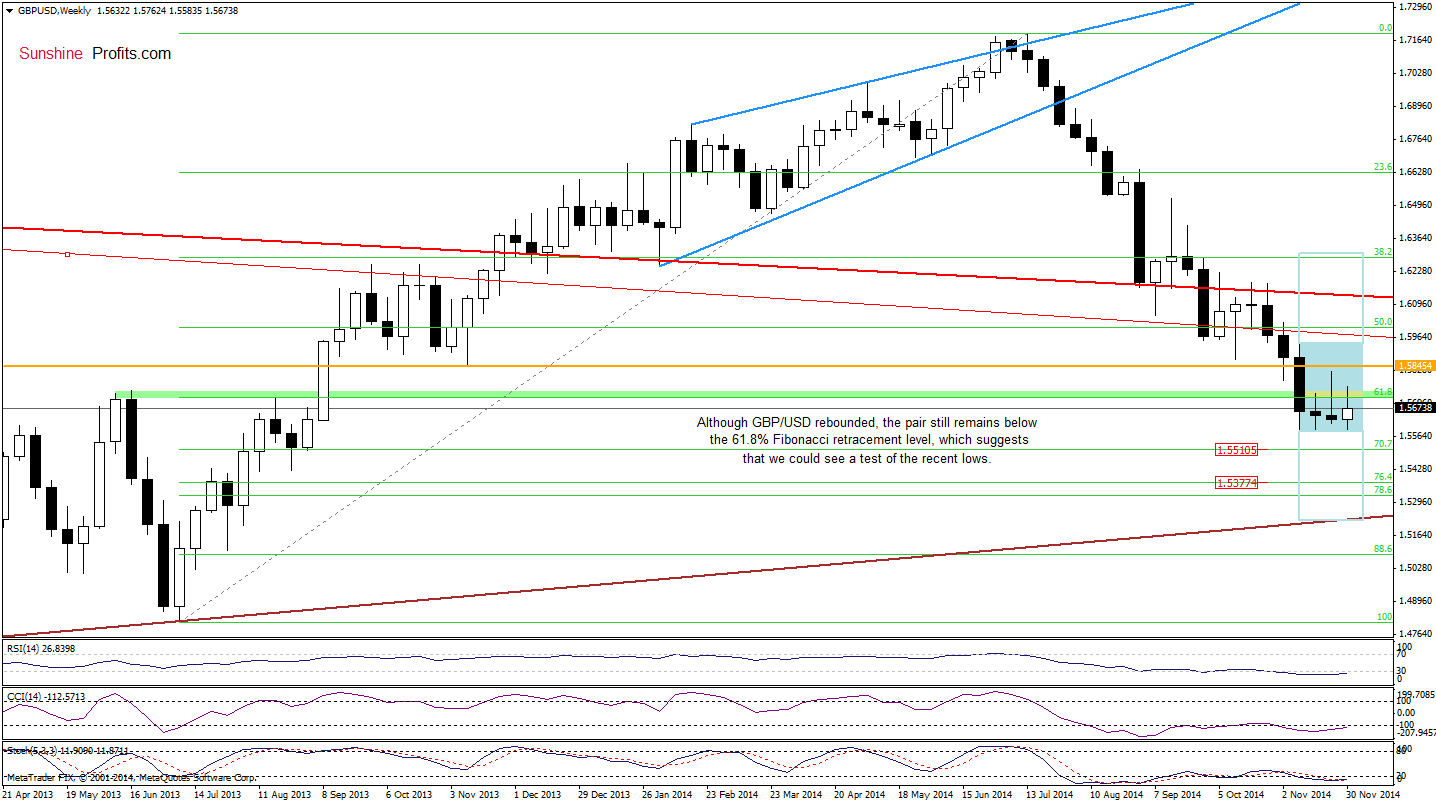
From the medium-term perspective, we see that the situation hasn’t changed much as GBP/USD is still trading in a consolidation (marked with blue) between the recent lows and the long-term red, declining resistance line. Therefore, we think that as long as there is no weekly close above/below these levels, a sizable upward/downward move is not likely to be seen.
Will the daily chart give us more clues about future moves? Let’s check.
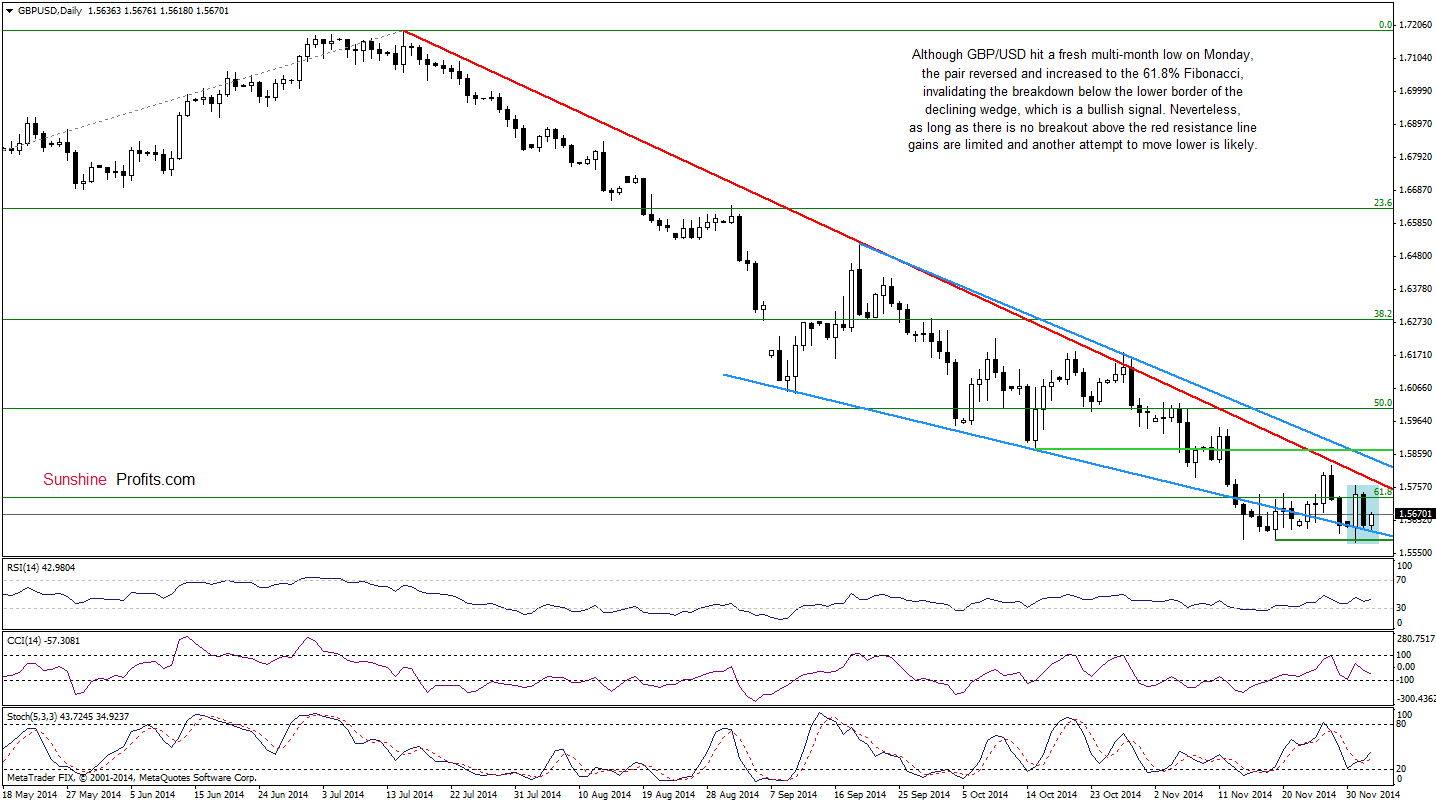
As you see on the daily chart, GBP/USD hit a fresh multi-month low on Monday, but the pair reversed and increased to the previously-broken 61.8% Fibonacci retracement, invalidating the breakdown below the lower border of the declining wedge. Although this is a bullish signal, we should keep in mind that we saw similar price action several times in Nov. Back then, all upswings were not effective, because they didn’t lead to a breakout above the medium-term declining red line and the resistance level created by the Nov 2013 (marked on the weekly chart). Therefore, we think that as long as these resistances are in play, a sizable upward move is not likely to be seen and another move lower can’t be ruled out.
Very short-term outlook: mixed
Short-term outlook: mixed
MT outlook: mixed
LT outlook: mixed
Trading position (short-term): In our opinion, no positions are justified from the risk/reward perspective at the moment. We will keep you informed should anything change, or should we see a confirmation/invalidation of the above.
USD/CHF
In our last commentary on this currency pair, we wrote:
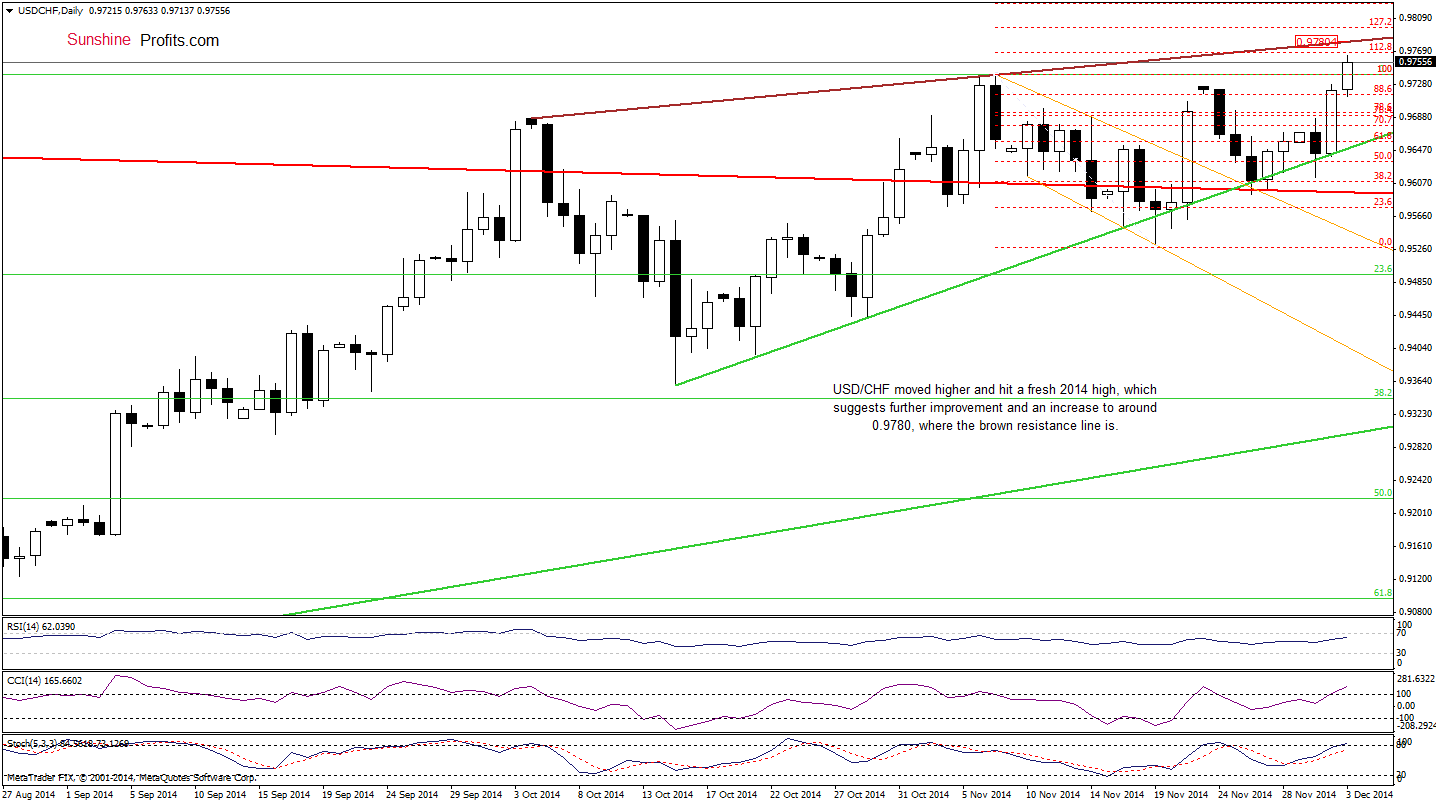
(…) Although currency bears tried to push the pair lower three times in a row, they failed, which resulted in a rebound. Taking this positive fact into account, we think that USD/CHF will extend gains and we’ll see an increase to around 0.9722 (the Nov 24 high) in the coming week.
Looking at the daily chart, we see that the situation developed in line with the above-mentioned scenario and USD/CHF moved sharply higher, increasing not only to our upside target, but also hitting a fresh 2014 high. With this upward move, the exchange rate climbed to the 112.8% Fibonacci extension, however, taking into account the position of the indicators (although they are overbought, there are no sell signals), we think that the pair will reach the brown resistance line or even the 127.2% Fibonacci extension in the near future. What could happen if this area is broken? Let’s take a closer look at the weekly chart and find out.
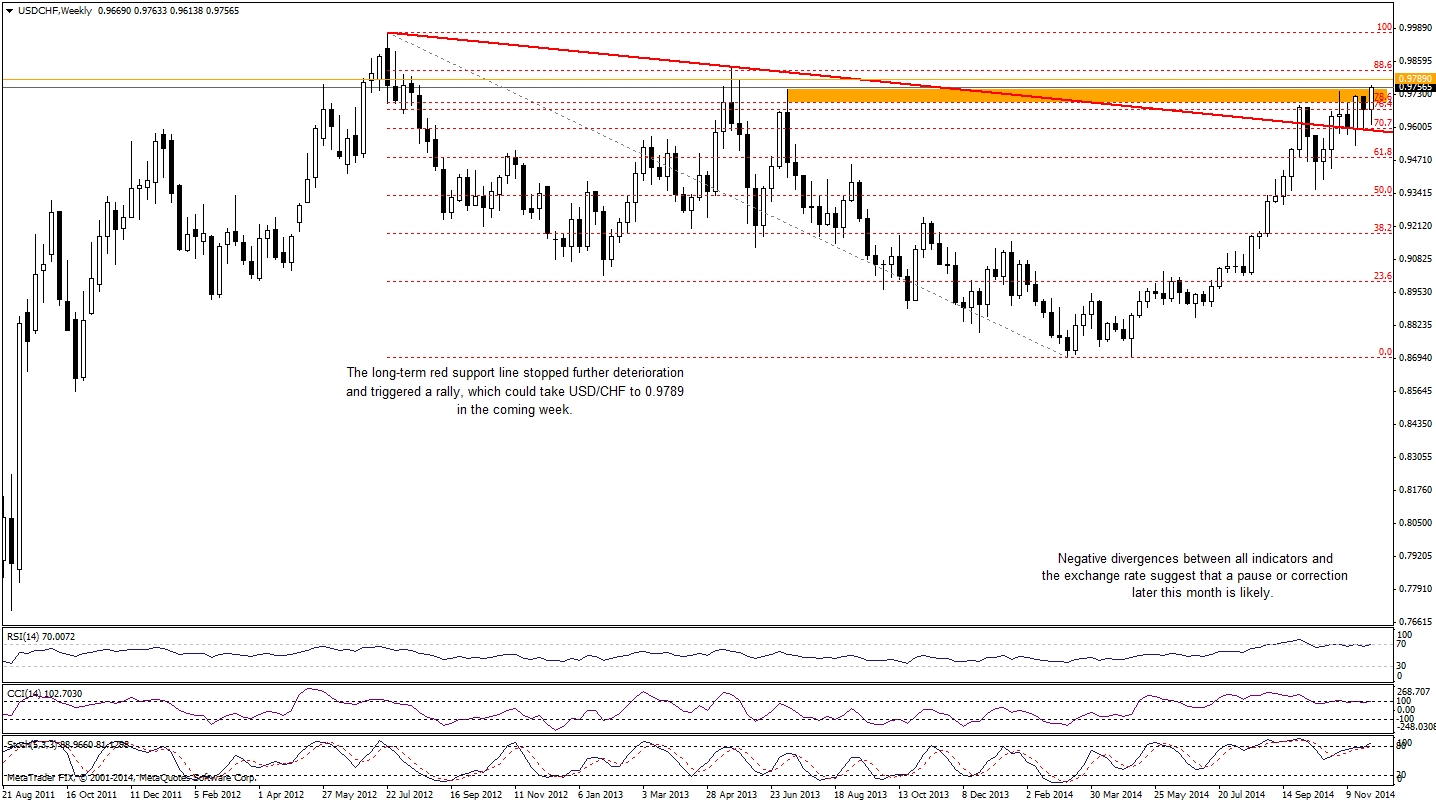
From this perspective, we see that USD/CHF broke above the orange resistance zone, which suggests further improvement and an increase to around 0.9789-0.9821, where the next resistance area (created by the May 29 high and the 88.6% Fibonacci retracement based on the entire 2012-2014 decline) is. Nevertheless, please keep in mind that there are clearly visible negative divergences between all indicators and the exchange rate, which suggests that a pause or correction in the coming weeks is likely.
Very short-term outlook: mixed with bullish bias
Short-term outlook: mixed
MT outlook: mixed
LT outlook: bearish
Trading position (short-term; our opinion): No positions are justified from the risk/reward perspective at the moment. We will keep you informed should anything change, or should we see a confirmation/invalidation of the above.
Thank you.
Nadia Simmons
Forex & Oil Trading Strategist
Przemyslaw Radomski, CFA
Founder, Editor-in-chief
Gold & Silver Trading Alerts
Forex Trading Alerts
Oil Investment Updates
Oil Trading Alerts

