
Yesterday’s minutes of the Federal Reserve’s latest meeting supported the greenback and pushed the U.S. currency to a fresh seven-year high against the yen. In this way, USD/JPY extended rally and reached a solid resistance zone. Will it be strong enough to stop currency bulls’ charge in the coming days?
In our opinion the following forex trading positions are justified - summary:
- EUR/USD: none
- GBP/USD: short (stop-loss: 1.5763; initial price target: 1.5307)
- USD/JPY: none
- USD/CAD: none
- USD/CHF: none
- AUD/USD: none
EUR/USD
The medium-term picture of EUR/USD hasn’t changed much as the exchange rate is trading around the last week’s high. Today, we’ll focus on the very short-term changes.
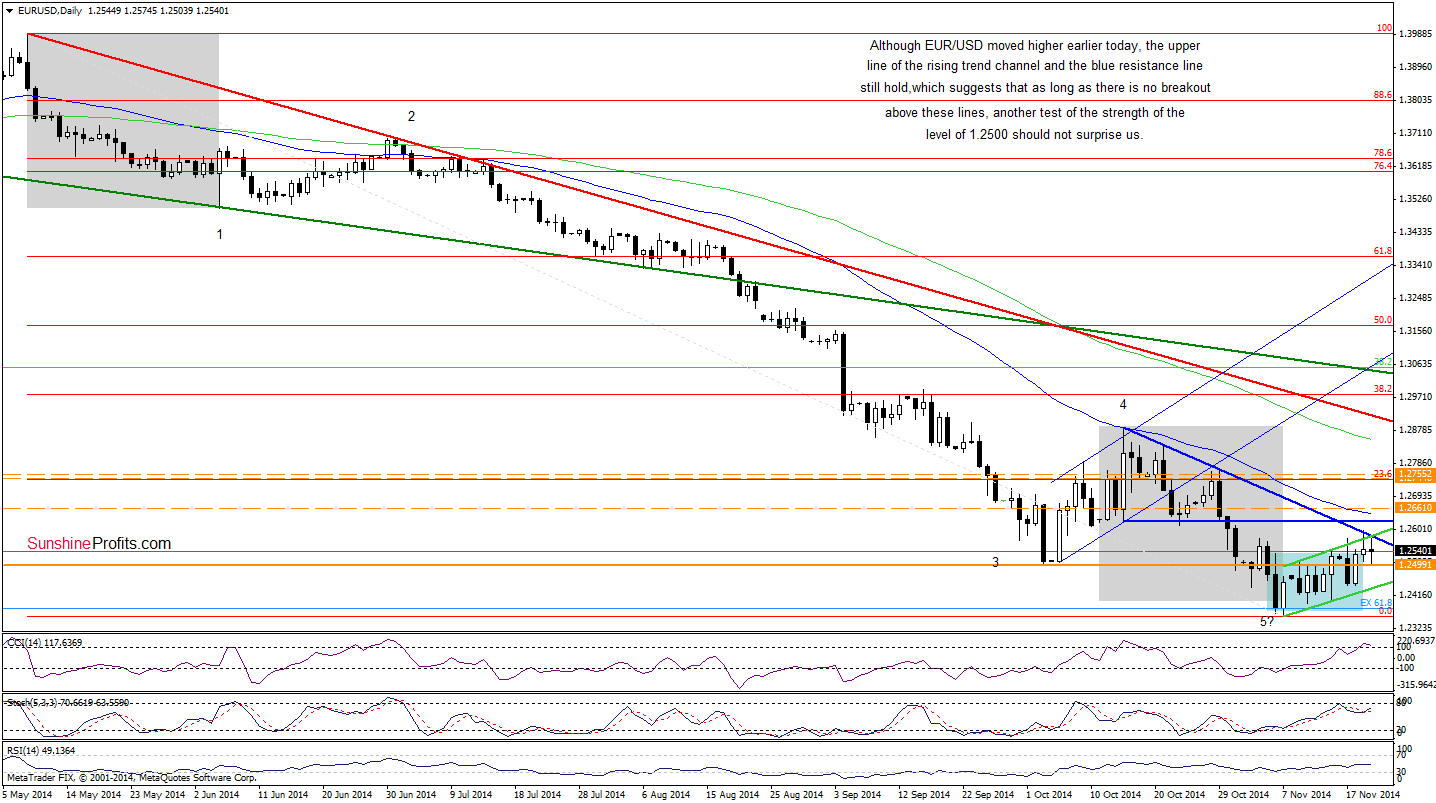
Looking at the above chart it’s hard to see any important changes and clues about future moves. As you see, the exchange rate is still trading in a narrow range between the resistance area (created by the upper border of the rising trend channel and the blue declining line) and the level of 1.2500. Therefore, we still think that as long as there is no breakout/breakdown above/below these lines, a sizable upward or downward move is not likely to be seen. Nevertheless, if currency bulls push the pair higher, EUR/USD will likely increase to at least 1.2770,where the Oct 29 high and the 23.6% Fibonacci retracement based on the entire May-Nov decline is. On the other hand, if the pair breaks below 1.2500, we could see further deterioration and a test of the strength of the lower border of the rising trend channel (currently around 1.2435).
Very short-term outlook: mixed
Short-term outlook: mixed
MT outlook: mixed
LT outlook: bearish
Trading position (short-term): In our opinion, no positions are justified from the risk/reward perspective at the moment. We will keep you informed should anything change, or should we see a confirmation/invalidation of the above.
USD/JPY
On Friday we wrote the following:
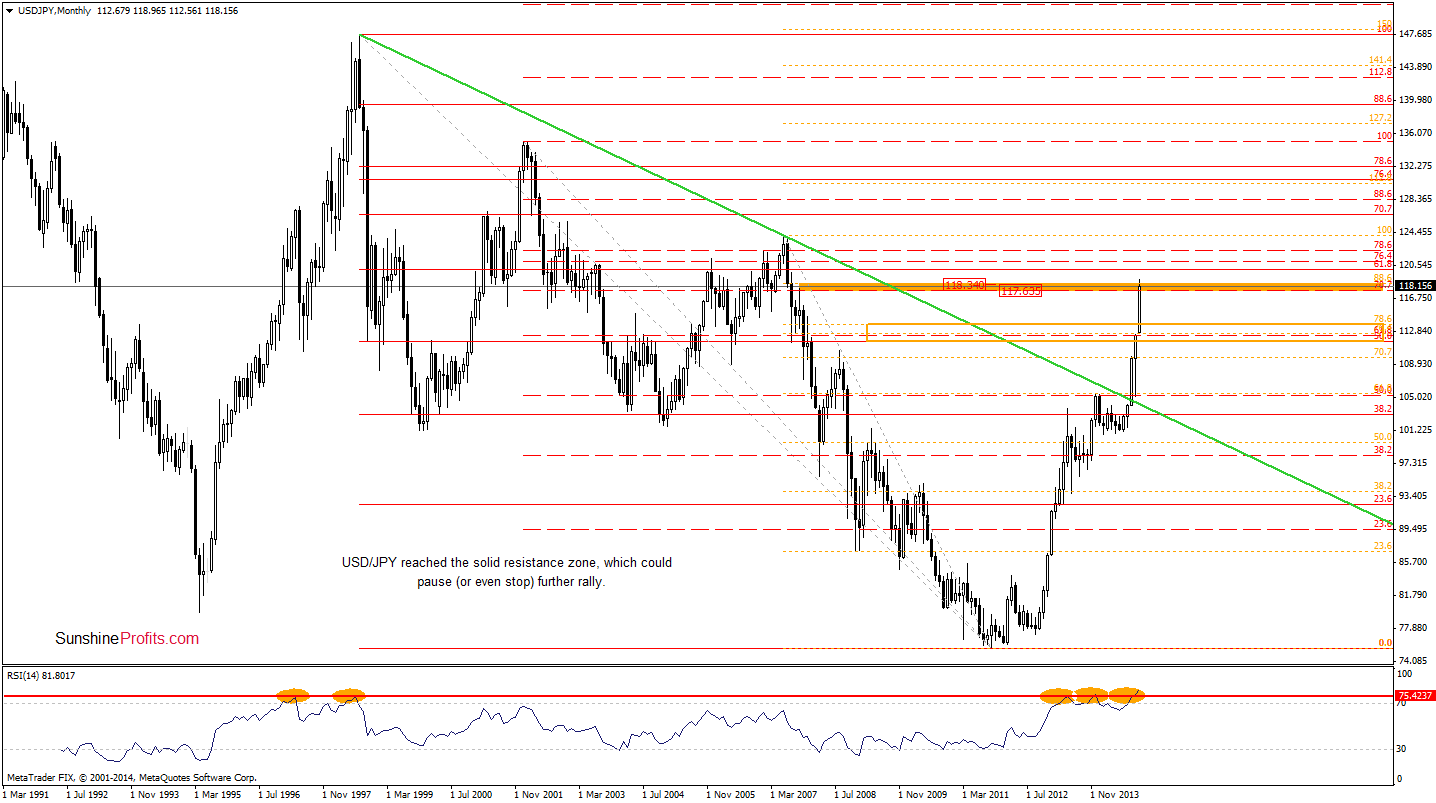
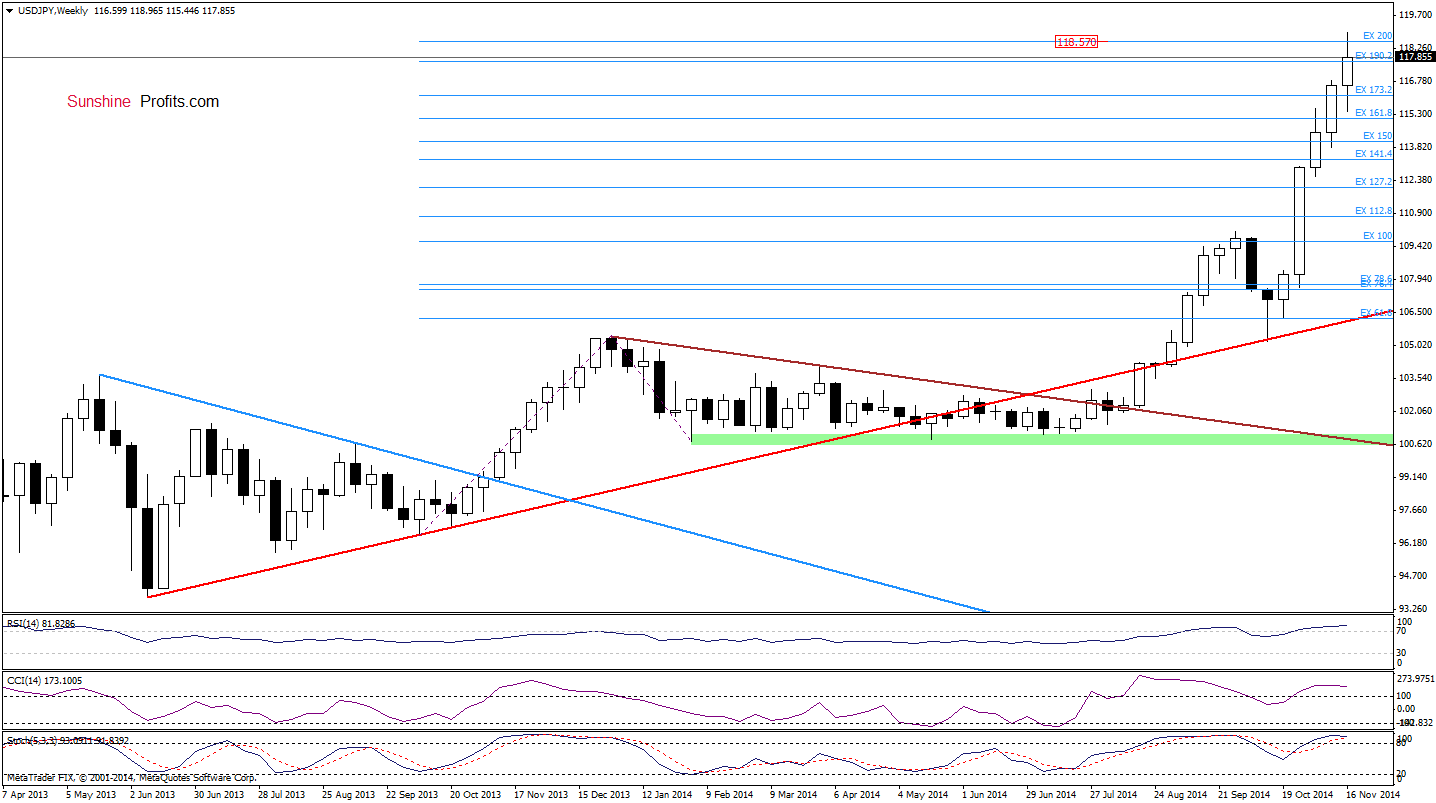
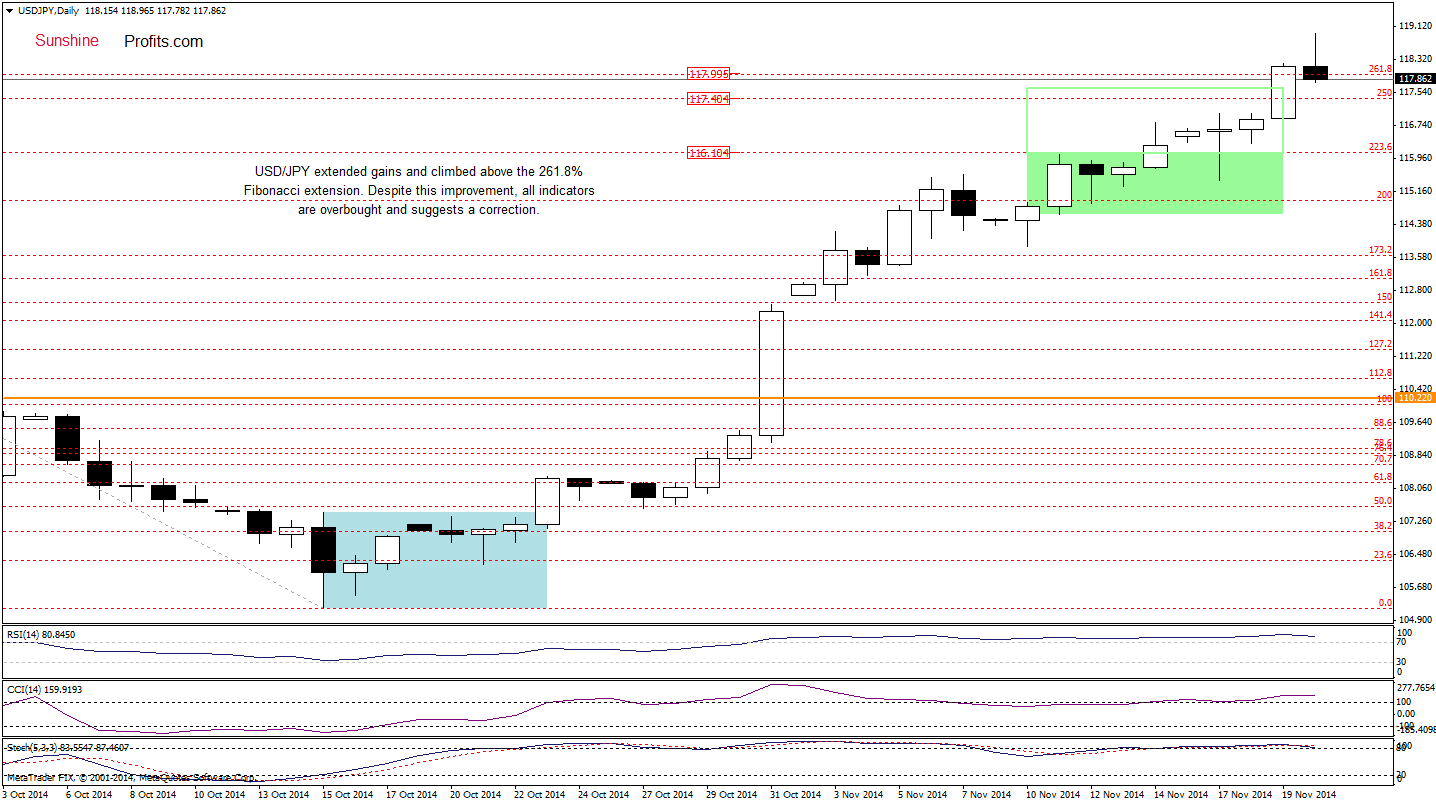
(…) the initial upside target would be the 250% Fibonacci extension at 117.40 or even the solid resistance zone (marked on the monthly chart) around 117.60-118.57.
Looking at the above charts, we see that the situation developed in line with the above-mentioned scenario as USD/JPY extended rally and hit a seven-year high of 118.96 earlier today. With this move, the exchange rate climbed to the strong resistance zone created by the 261.8% Fibonacci extension (marked on the daily chart), the 200% Fibonacci price projection (seen on the weekly chart), the 70.7% Fibonacci retracement (based on the 2002-2011 decline) and 88.6% retracement (based on the 2007-2011 move). In our opinion, the combination of these four resistance levels is strong enough to (at least) pause further improvement and trigger a correction in the near future. Please note that this scenario is currently reinforced by the position of the indicators: the daily RSI climbed to its highest level since Sep (while the monthly indicator hasn’t been so high since 1992) and there are negative divergences between the daily (and also weekly) CCI, the Stochastic Oscillator and the exchange rate. If this is the case, initial downside target would be around 115.72, where the 23.6% Fibonacci retracement based on the entire Oct-Nov rally is. We will consider opening short positions if we see a confirmation of the above (or after an increase to 120, where the 61.8% Fibonacci retracement based on the entire 1998-2011 decline is).
Very short-term outlook: mixed with bearish bias
Short-term outlook: mixed with bearish bias
MT outlook: bullish
LT outlook: bullish
Trading position (short-term; our opinion): No positions are justified from the risk/reward perspective at the moment. We will keep you informed should anything change, or should we see a confirmation/invalidation of the above.
USD/CHF
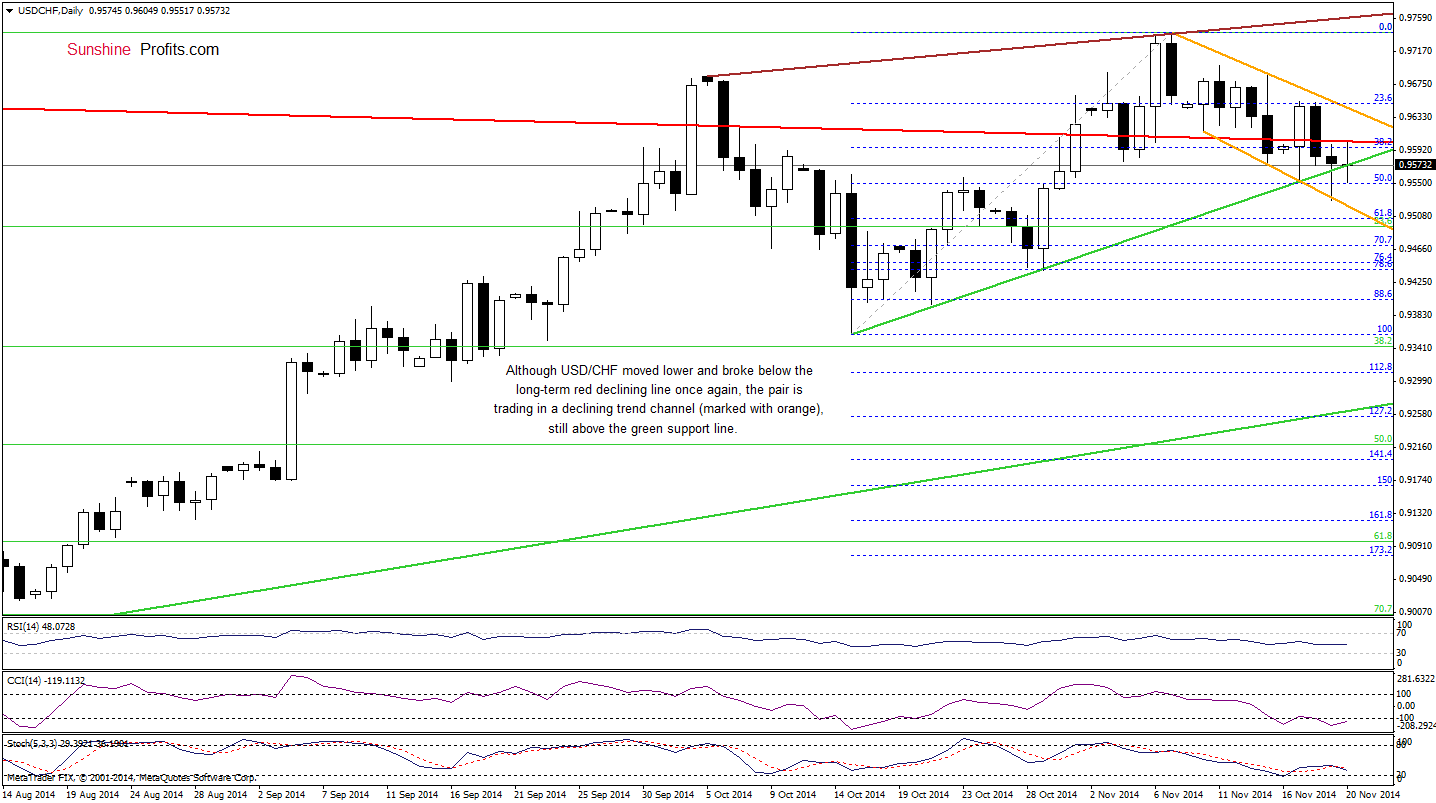
Looking at the daily chart, we see that the proximity to the upper line of the declining trend channel (marked with orange) encouraged currency bears to act and resulted in another drop below the long-term red line. Although this is a bearish sign, USD/CHF is still trading above the green rising line. In our opinion, even if we see a breakdown below this support, the lower border of the formation will likely pause further improvement – similarly to what we saw yesterday. Therefore, as long as there is no daily close below this line, a sizable downward move is not likely to be seen (on the other hand, as long as there is no breakout above the upper orange line, further rally is questionable).
Very short-term outlook: mixed
Short-term outlook: mixed
MT outlook: bearish
LT outlook: bearish
Trading position (short-term; our opinion): No positions are justified from the risk/reward perspective at the moment. We will keep you informed should anything change, or should we see a confirmation/invalidation of the above.
Thank you.
Nadia Simmons
Forex & Oil Trading Strategist
Przemyslaw Radomski, CFA
Founder, Editor-in-chief
Gold & Silver Trading Alerts
Forex Trading Alerts
Oil Investment Updates
Oil Trading Alerts

