
Earlier today, the Department of Labor reported that the U.S. economy added 214,000 jobs in Oct. Although it was the 49th straight month of positive job growth, today’s numbers missed expectations for an increase of 231,000. In a response, the USD Index, which tracks the performance of the greenback against a basket of six major currencies gave up some gains, slipping below 88. Did this drop affect the short-term outlook of major currency pairs?
In our opinion the following forex trading positions are justified - summary:
EUR/USD
In our Forex Trading Alert posted on Oct 3, we wrote the following:
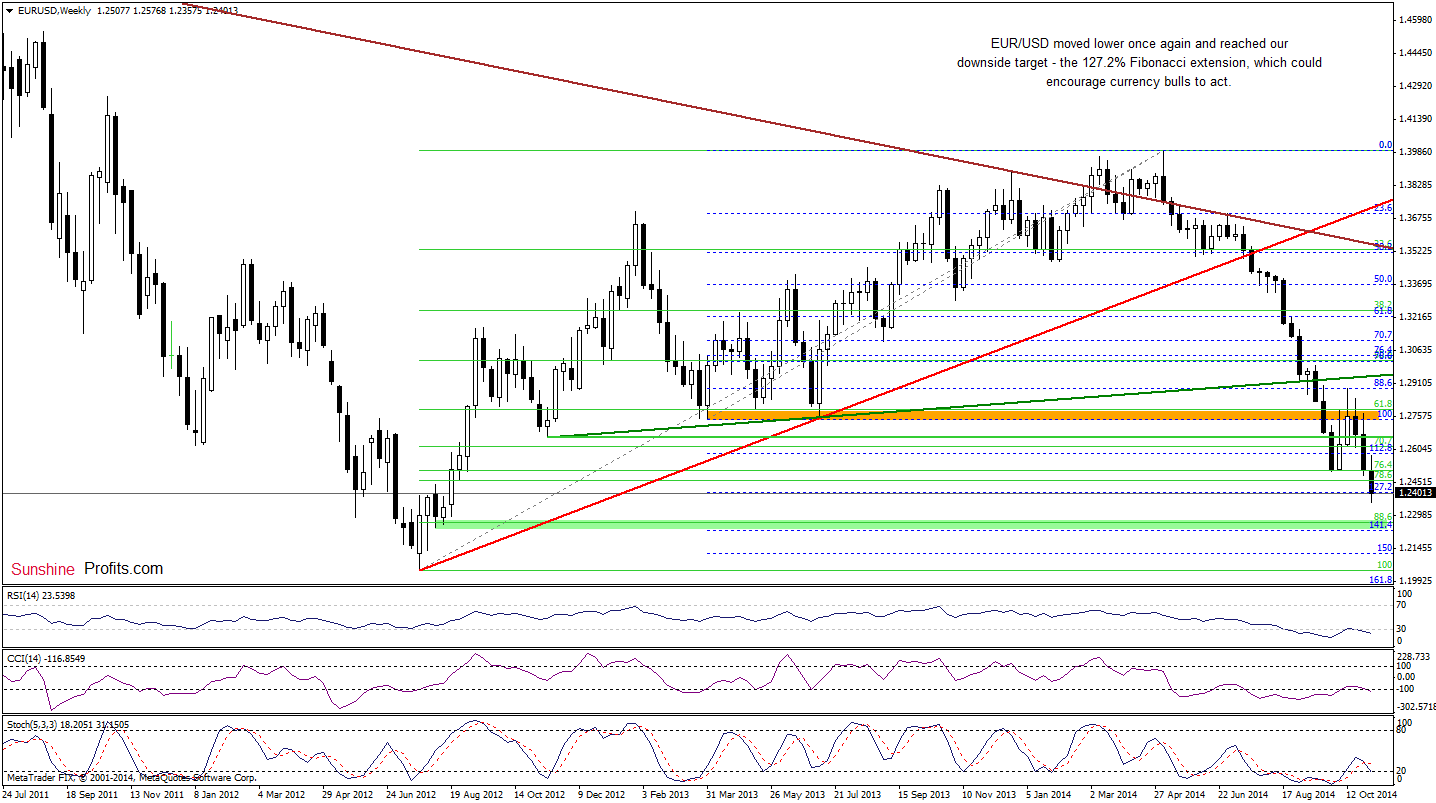
(…) EUR/USD extended losses and broke below the recent lows. With this downswing, the exchange rate also slipped under the support zone created by the 76.4% and 78.6% Fibonacci retracement levels, which is a negative signal that suggests a drop to the 127.2% Fibonacci extension (based on the Apr 2013 low and the May 2014 high) around 1.2406
The above chart shows that the situation developed in line with the above-mentioned scenario and EUR/USD slipped to our downside target earlier today. Despite this drop, the exchange rate rebounded slightly, which suggests that if the pair invalidates this breakdown, we could see a bigger upswing in the coming week. Can we infer something more from the very short-term picture? Let’s find out.
Quoting our Monday’s commentary on this currency pair:
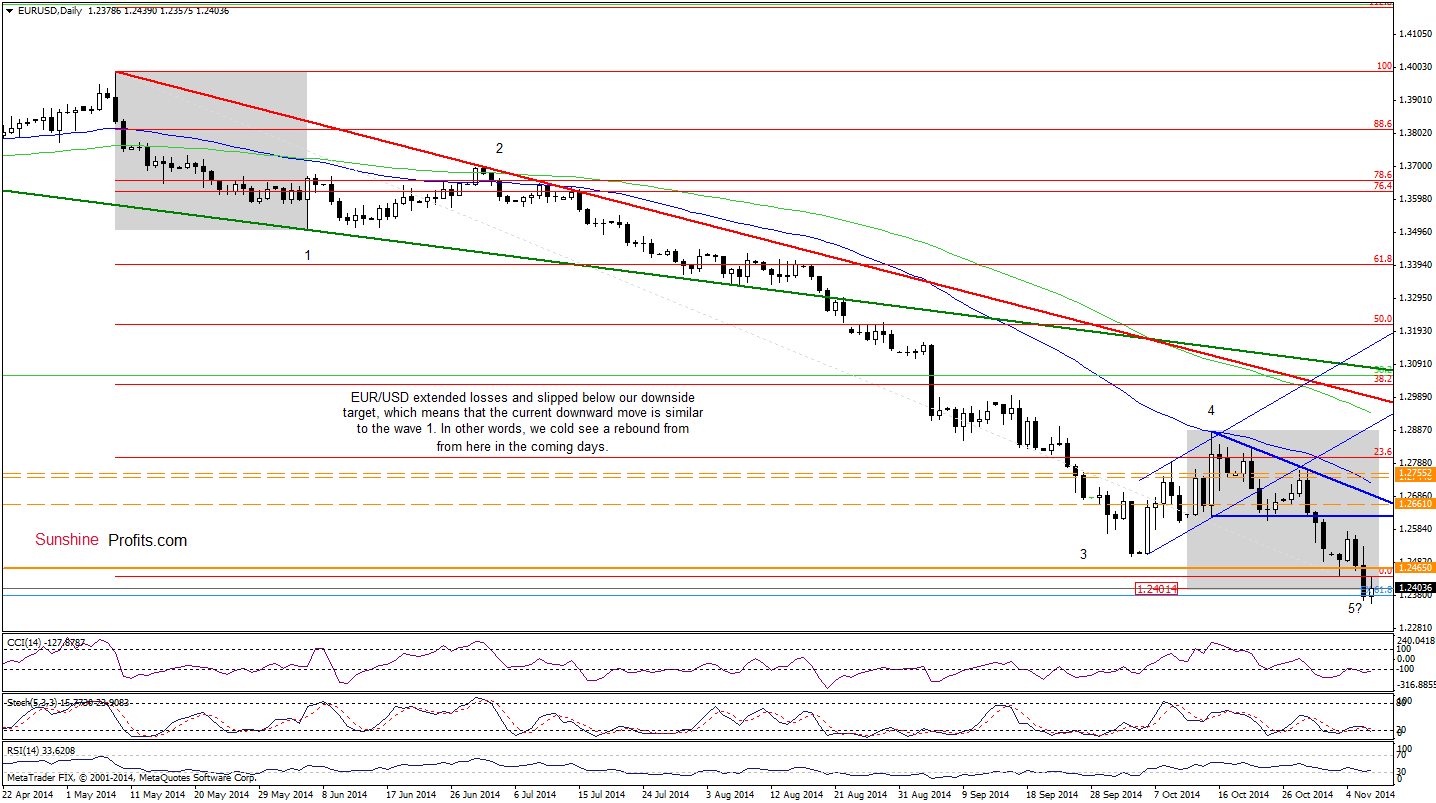
(…) we could see further deterioration and a drop to the support zone created by the 127.2% Fibonacci extension (based on the Apr 2013 low and the May 2014 high) and the psychological barrier of 1.2400. What’s interesting, when we factor in the Elliott wave theory and compare the current downward move (a potential wave 5) to the one that we saw in May (the first wave to the downside), we clearly see that they will be equal around 1.2401, which increases the probability of further declines.
As you see on the daily chart, currency bears pushed the exchange rate lower as we expected, which resulted in a drop to the above-mentioned support zone. Although EUR/USD slipped below the barrier of 1.2400, this breakdown was invalidated almost immediately, which is a positive signal. Additionally, the recent downward move is similar to wave 1, which suggests that EUR/USD could rebound from here in the coming days. If this is the case, the initial upside target would be around 1.2576, where this week’s high is. Nevertheless, we should keep in mind that as long as the pair remains under the previous lows, another test of the support area can’t be ruled out.
Very short-term outlook: mixed with bullish bias
Short-term outlook: mixed
MT outlook: mixed
LT outlook: bearish
Trading position (short-term): In our opinion, no positions are justified from the risk/reward perspective at the moment,however, we consider opening long positions. We will keep you informed should anything change, or should we see a confirmation/invalidation of the above.
GBP/USD
Yesterday, we wrote:
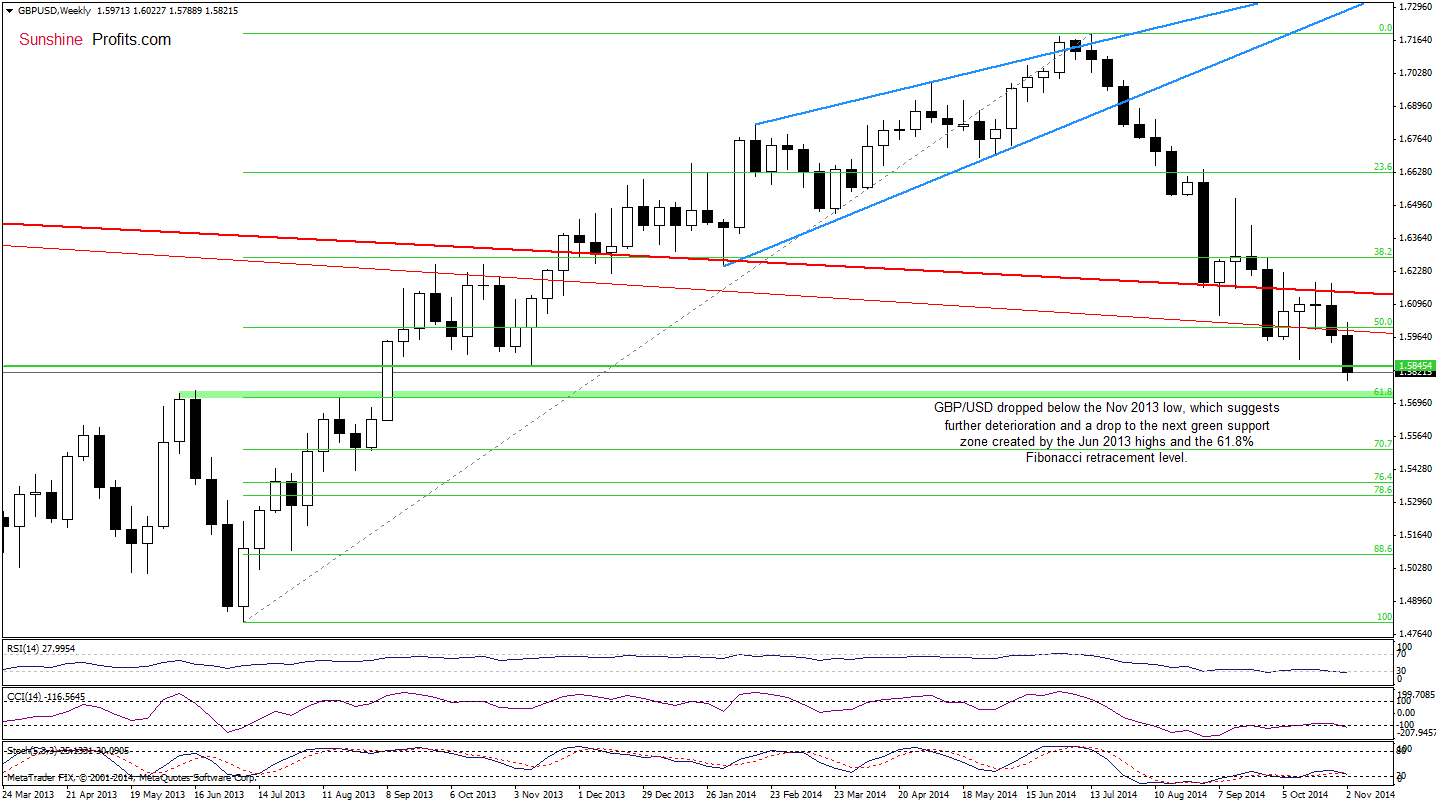
(…) the exchange rate invalidated the breakdown below the previous lows yesterday, but we think that it’s not enough to indicate a rally (…) it seems to us that the pair will extend losses and test the Nov 2013 low in the coming days.
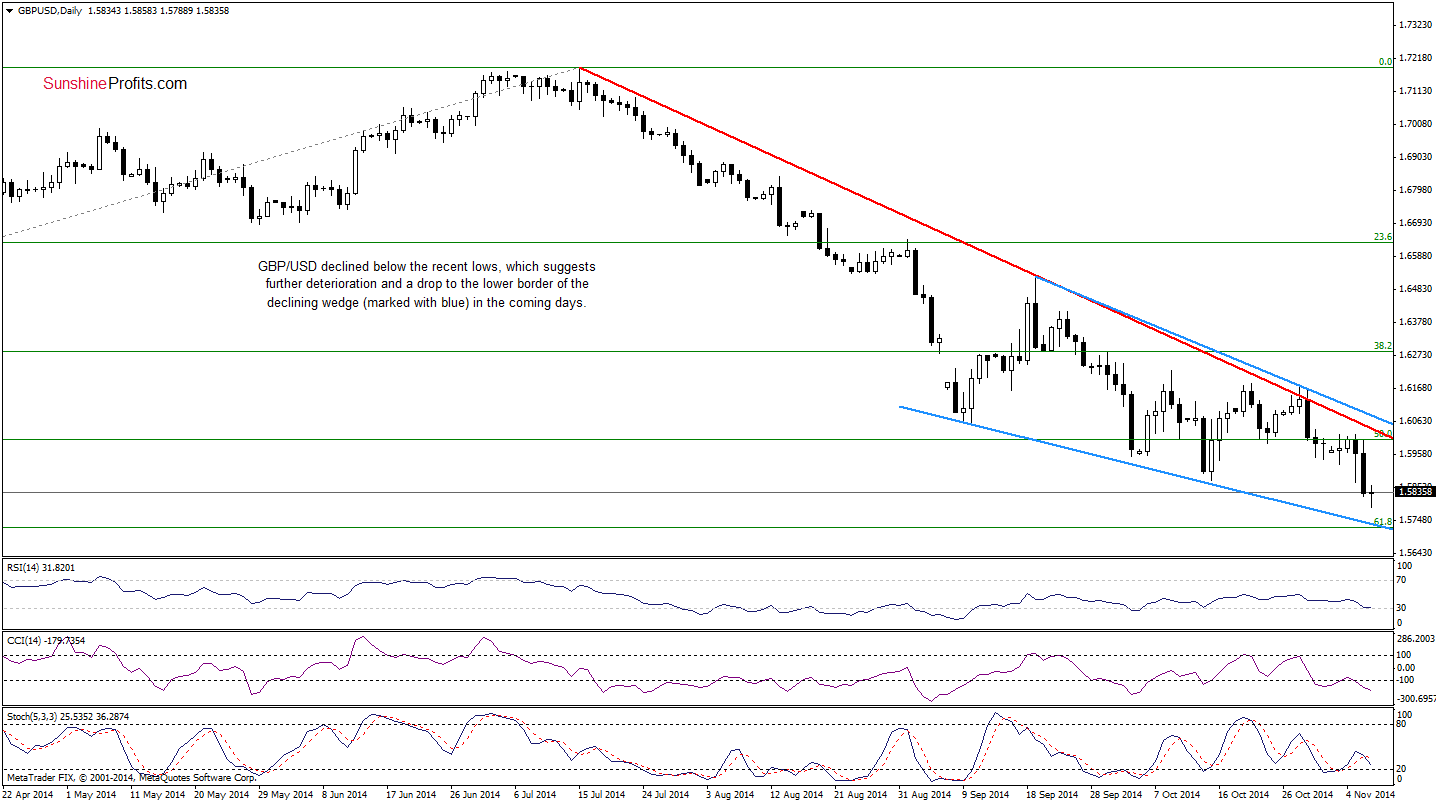
Looking at the above charts, we see that currency bulls failed around the above-mentioned key support level and GBP/USD hit a fresh multi-month low. What’s next? In our opinion, if the pair closes today’s session below this support, we’ll see further deterioration and the next downside target would be around 1.5721-1.5738, where the support zone create by the 61.8% Fibonacci retracement and the lower border of the declining wedge (marked with blue on the daily chart) are. What if the pair invalidates the breakdown? In this case, the initial upside target would be around 1.5980, where the previously-broken long-term resistance red line (seen on the weekly chart) is. However, taking into account the current position of the daily indicators, it seems that the next move will be to the downside.
Very short-term outlook: mixed with bearish bias
Short-term outlook: mixed
MT outlook: mixed
LT outlook: mixed
Trading position (short-term): In our opinion, no positions are justified from the risk/reward perspective at the moment. We will keep you informed should anything change, or should we see a confirmation/invalidation of the above.
USD/JPY
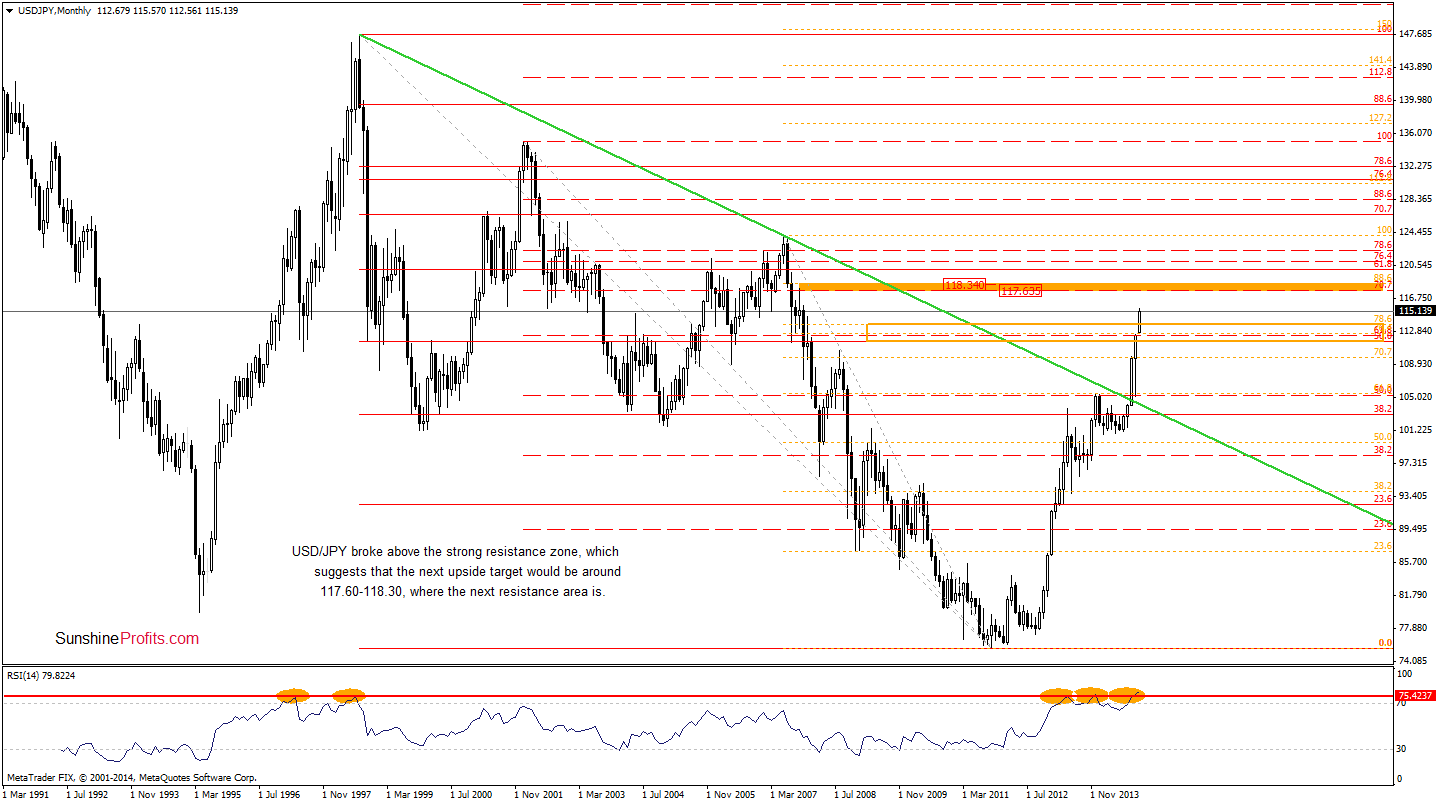
The first thing that catches the eye on the above chart is a breakout above the very strong resistance zone created by 4 Fibonacci retracement level. Although it’s not confirmed, we think that such bullish development will trigger further rally. How high could the exchange rate go? Let’s take a look at the charts below and find out.
Quoting our Wednesday’s commentary:
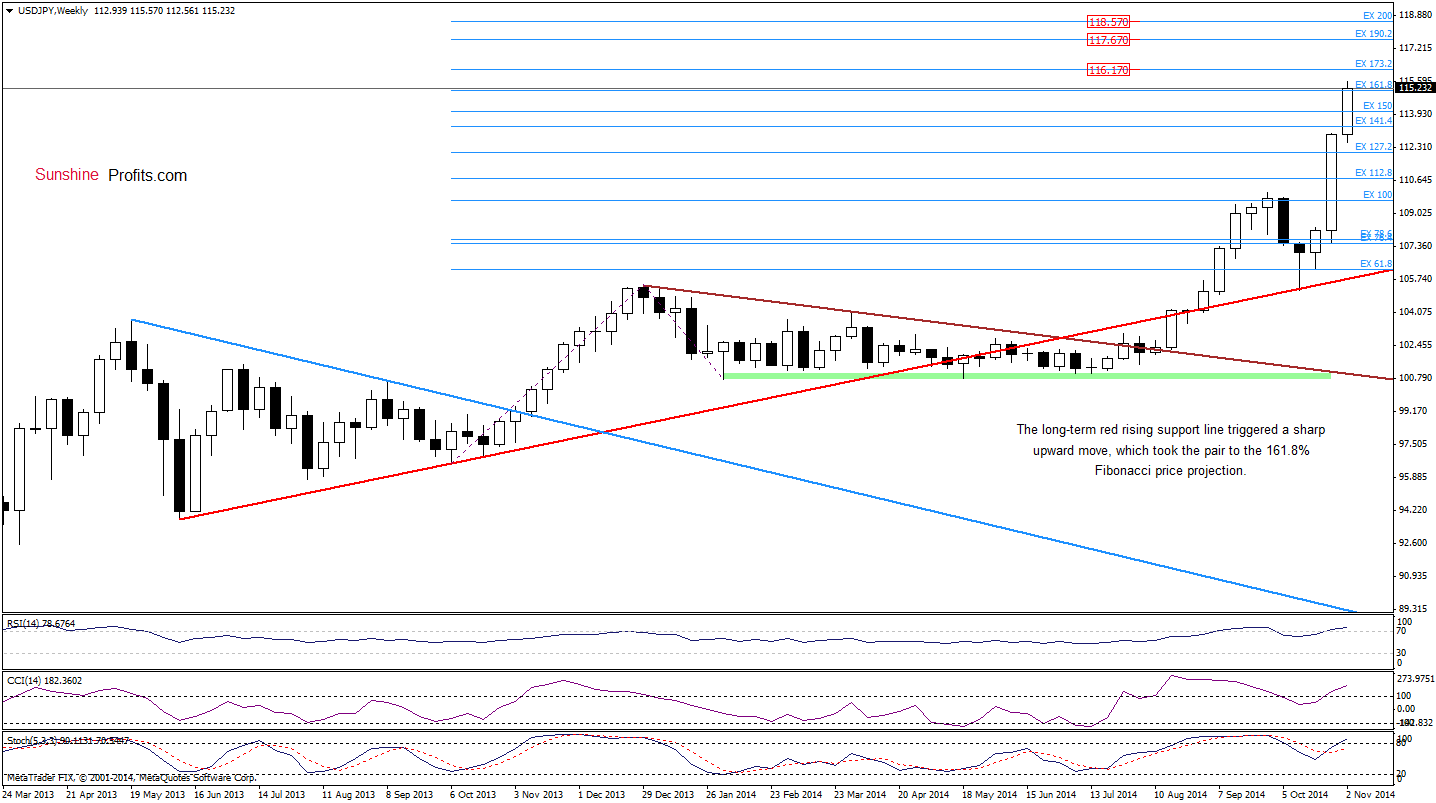
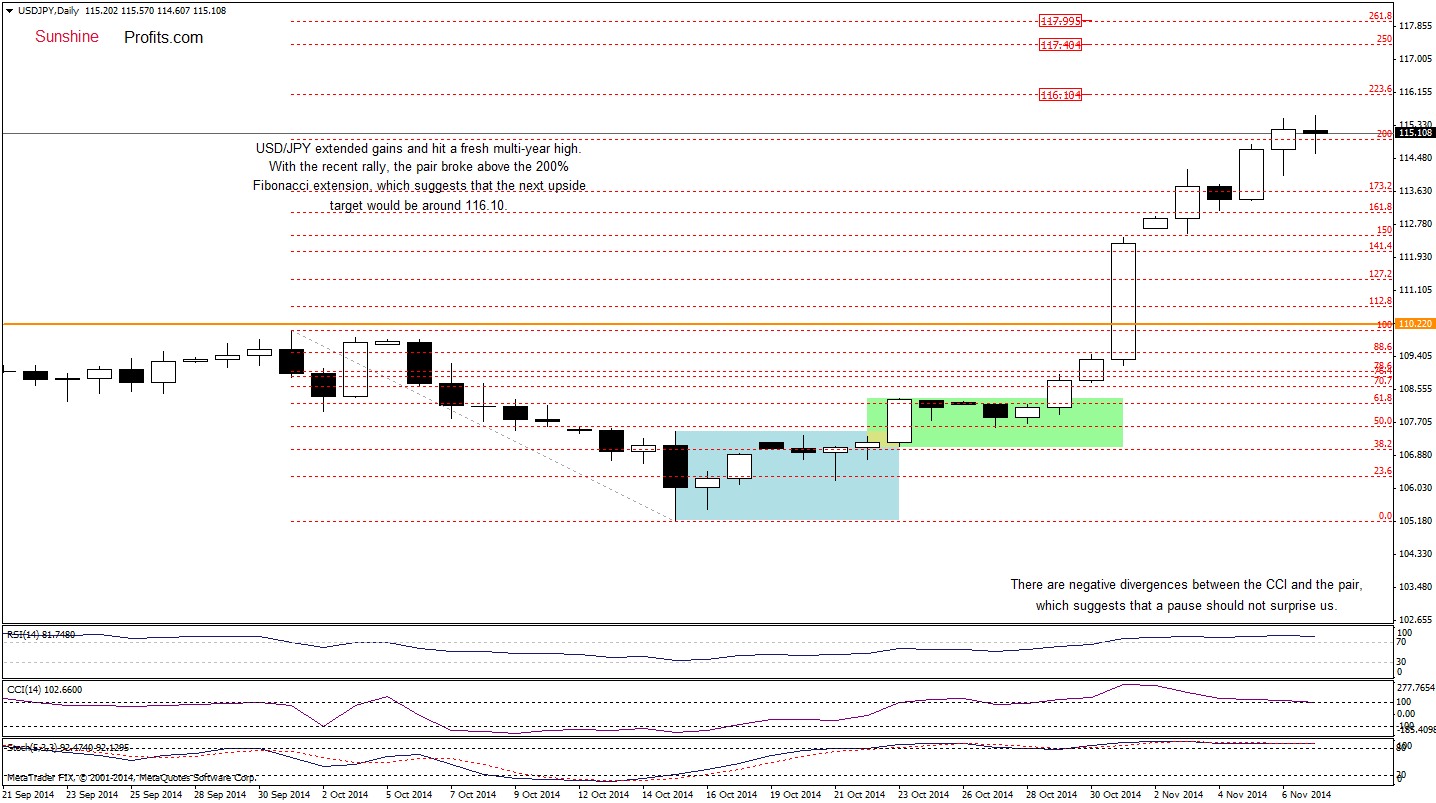
(…) the initial upside target will be around 115-115.11, where the 200% Fibonacci extension based on the Oct correction (marked on the daily chart) and the 161.8% Fibonacci price projection based on the Oct 2013 and Feb 2014 lows and Dec 2013 high (seen on the weekly chart) are.
Looking at the above charts, we see that USD/JPY reached these levels earlier today. Although the exchange rate gave up some gains, the pair is still trading near the fresh multi-year low, which suggests that further improvement is likely. If this is the case, the next target for currency bulls would be the 173.2% Fibonacci price projection at 116 or even around 117.60-118.57, where the solid resistance zone (marked on the monthly chart) is. Despite all these bullish signs, we should keep in mind that there are negative divergences between the CCI, Stochastic Oscillator and the exchange rate, while the monthly RSI climbed above the level of 75 (as a reminder, in the past such high reading of the indicator preceded bigger correcions), which suggests that a pause is just around the corner.
Very short-term outlook: bullish
Short-term outlook: mixed with bullish bias
MT outlook: bullish
LT outlook: bullish
Trading position (short-term; our opinion): No positions are justified from the risk/reward perspective at the moment. We will keep you informed should anything change, or should we see a confirmation/invalidation of the above.
USD/CAD
In our last commentary on this currency pair, we wrote the following:
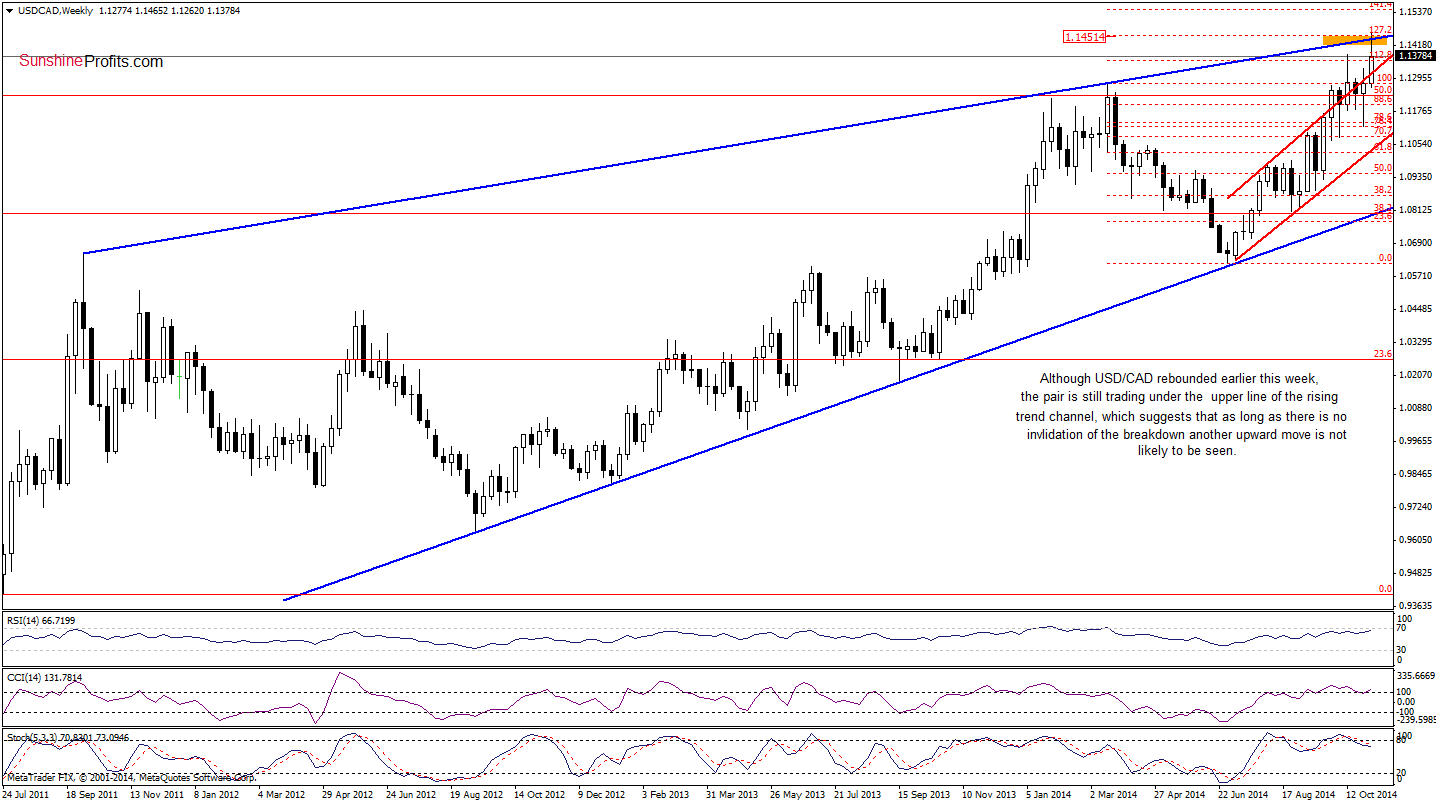
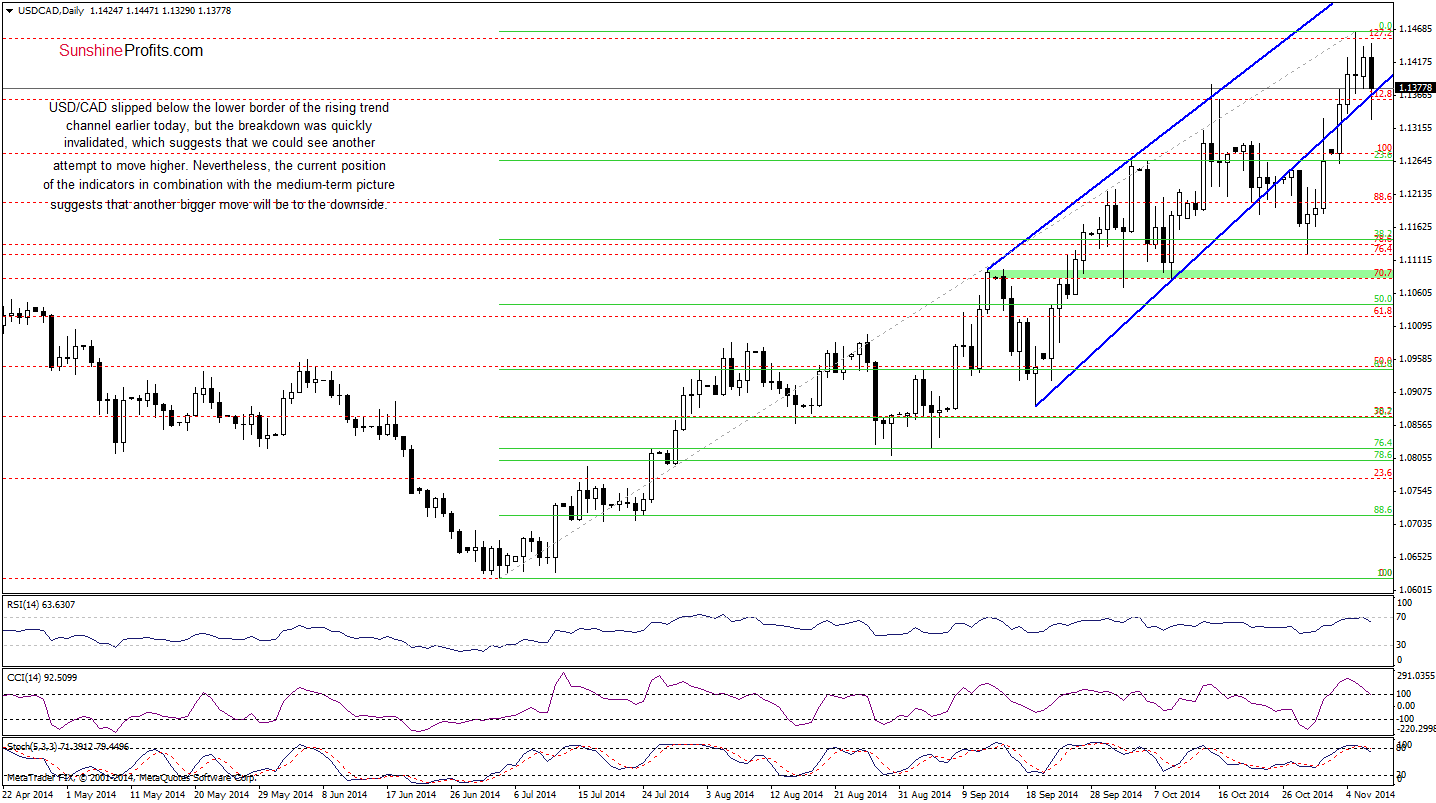
(…) the recent upward move took USD/CAD to the strong resistance zone created by the upper line of the rising trend channel and the 127.2% Fibonaci extension. In the previous month, the proximity to this area was enough to encourage crrency bears to act and trigger a correcion. Taking this fact into account and combining it with the current position of the indicators (in the medium and short term), we think that we’ll see another pullback from here in the coming days. If this is the case, the initial downside target would be around 1.1344, where the lower border of the rising trend channel (marked on the daily chart) is.
As you see on the above charts, the situation developed in tune with our scenario and USD/CAD moved lower earlier today. Although the exchange rate invalidated an intraday breakdown below the lower border of the rising trend channel (marked on the daily chart), it seems to us that the strong resistance zone will encourage currency bears to act in the near future and we’ll see a daily close below this support line. In this case, the initial downside target would be around 1.1142, where the 38.2% Fibonacci retracement (based on the entire Jul-Nov rally) is.
Very short-term outlook: mixed with bearish bias
Short-term outlook: mixed with bearish bias
MT outlook: mixed with bearish bias
LT outlook: bearish
Trading position (short-term; our opinion): No positions are justified from the risk/reward perspective at the moment. We will keep you informed should anything change, or should we see a confirmation/invalidation of the above.
USD/CHF
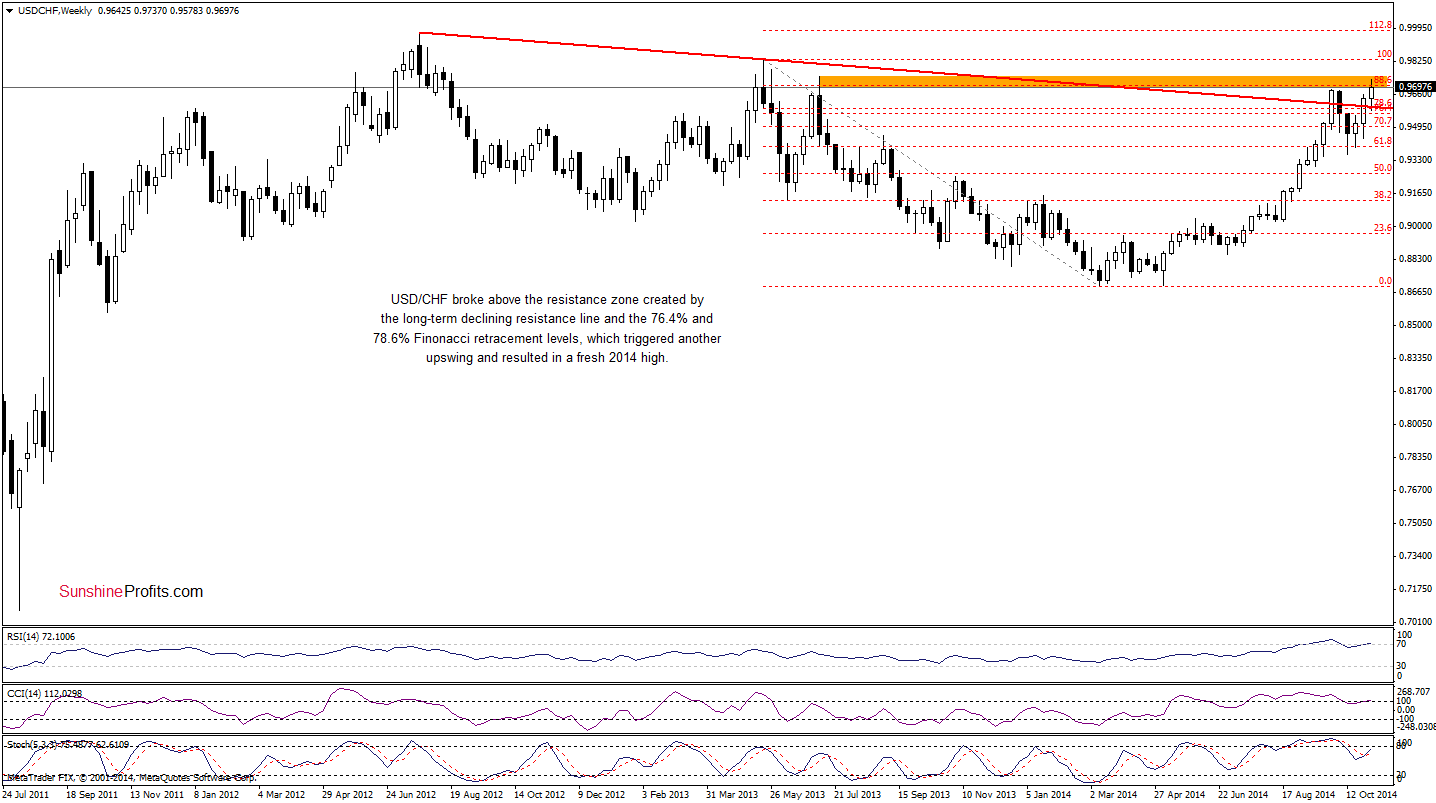
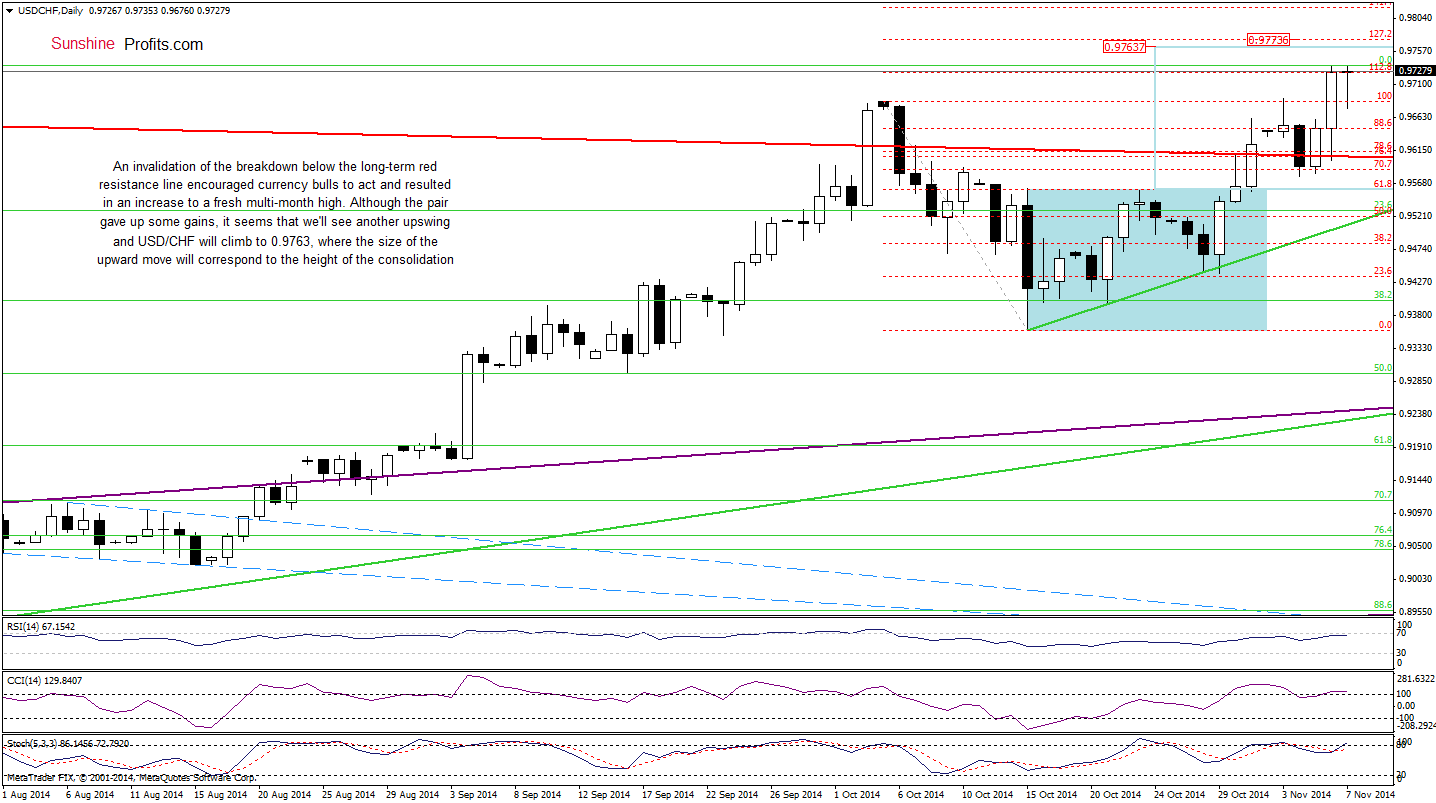
The overall situation has improved as USD/CHF invalidated a small breakdown below the long-term support/resistance line. This bullish signal triggered a sharp upswing, which took the pair to a new 2014 high. Although the exchange rate gave up some gains earlier today, it seems that as long as the long-term support/resistance line is in play, another upswing is likely. In our opinion, we could see an increase to around 0.9763, where the size of the upward move will correspond to the height of the consolidation.
Very short-term outlook: mixed with bullish bias
Short-term outlook: mixed
MT outlook: bearish
LT outlook: bearish
Trading position (short-term; our opinion): No positions are justified from the risk/reward perspective at the moment. We will keep you informed should anything change, or should we see a confirmation/invalidation of the above.
AUD/USD
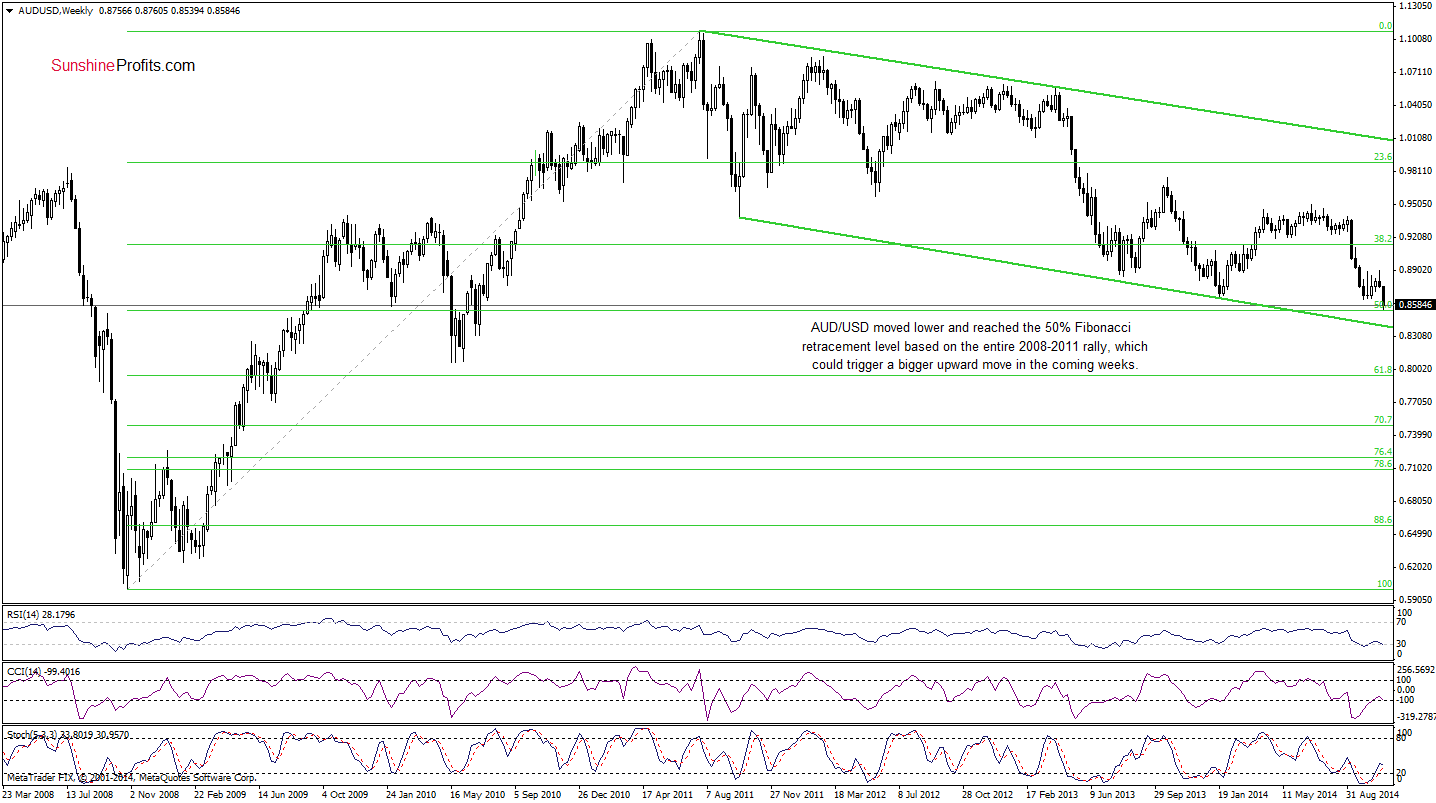
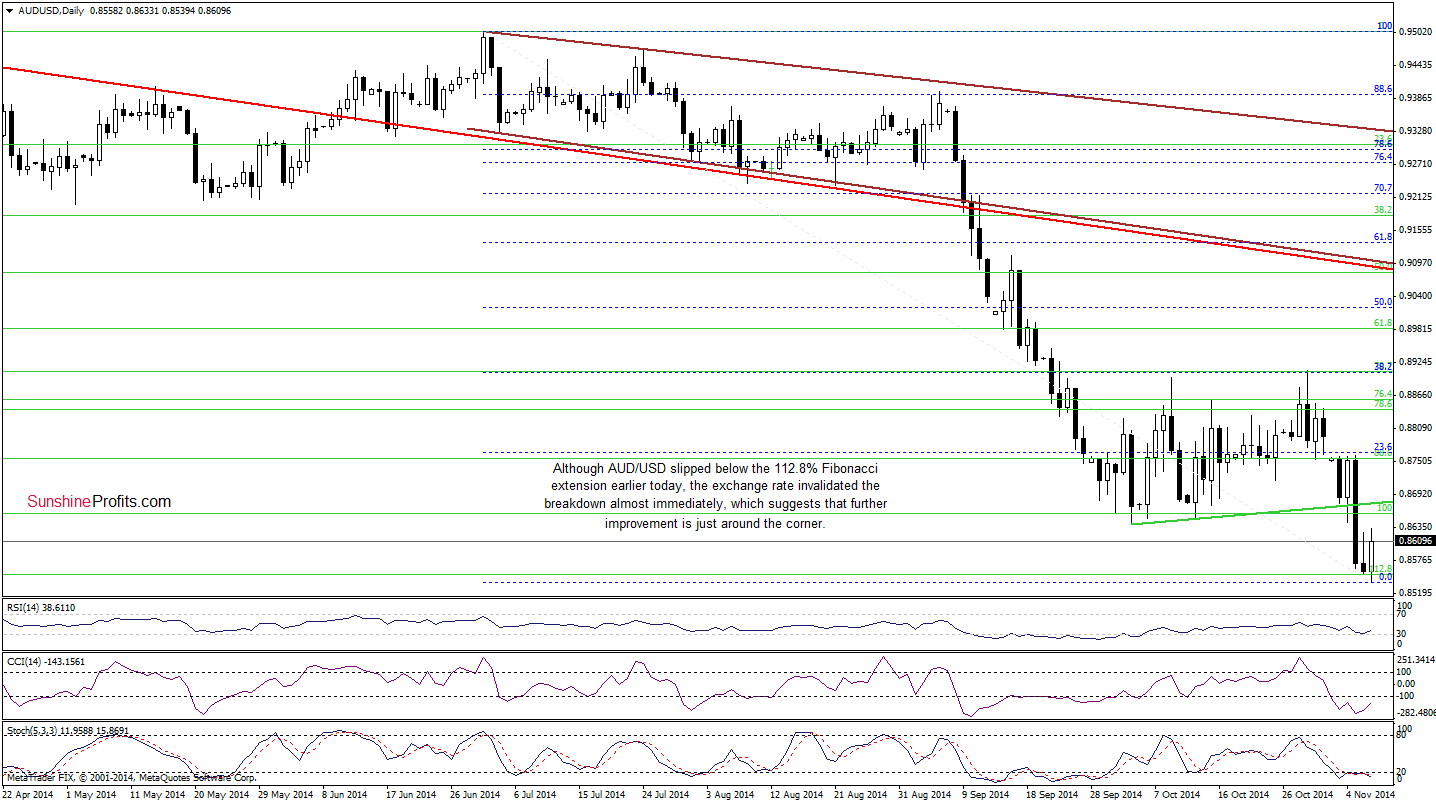
As you see on the above charts, although AUD/USD moved little lower earlier today, breaking below the recent low and the 112.8% Fibonacci extension, the exchange rate rebounded sharply and invalidated this breakdown almost immedately. This is a bullish signal (especially when we factor in a strong support level created by the 50% Fibonacci retracement based on the entire 2008-2011 rally), which could trigger a bigger corrective move in the coming week. If this is the case, the initial upside target would be around 0.8641-0.8650, where the previous lows are. Why this area is a key resistance at the moment? Because as long as there is no comeback above these levels, all upswings will be nothing more than a verification of the breakdown and another pullback can’t be ruled out.
Very short-term outlook: mixed
Short-term outlook: mixed
MT outlook: mixed
LT outlook: bearish
Trading position (short-term): In our opinion, no positions are justified from the risk/reward perspective at the moment. We will keep you informed should anything change, or should we see a confirmation/invalidation of the above.
Thank you.
Nadia Simmons
Forex & Oil Trading Strategist
Przemyslaw Radomski, CFA
Founder, Editor-in-chief
Gold & Silver Trading Alerts
Forex Trading Alerts
Oil Investment Updates
Oil Trading Alerts

