
Earlier today, the U.S. Department of Labor reported that consumer prices increased 0.1% in September, which supported the U.S. dollar and pushed the EUR/USD pair below the short-term support. What’s next?
In our opinion the following forex trading positions are justified - summary:
- EUR/USD: none
- GBP/USD: none
- USD/JPY: none
- USD/CAD: none
- USD/CHF: none
- AUD/USD: long (stop-loss order: 0.8587; initial price target: 0.8943)
EUR/USD
The situation in the medium term hasn’t changed much as EUR/USD is trading around the green support/resistance zone. Today, we’ll take a closer look at the very short-term changes.
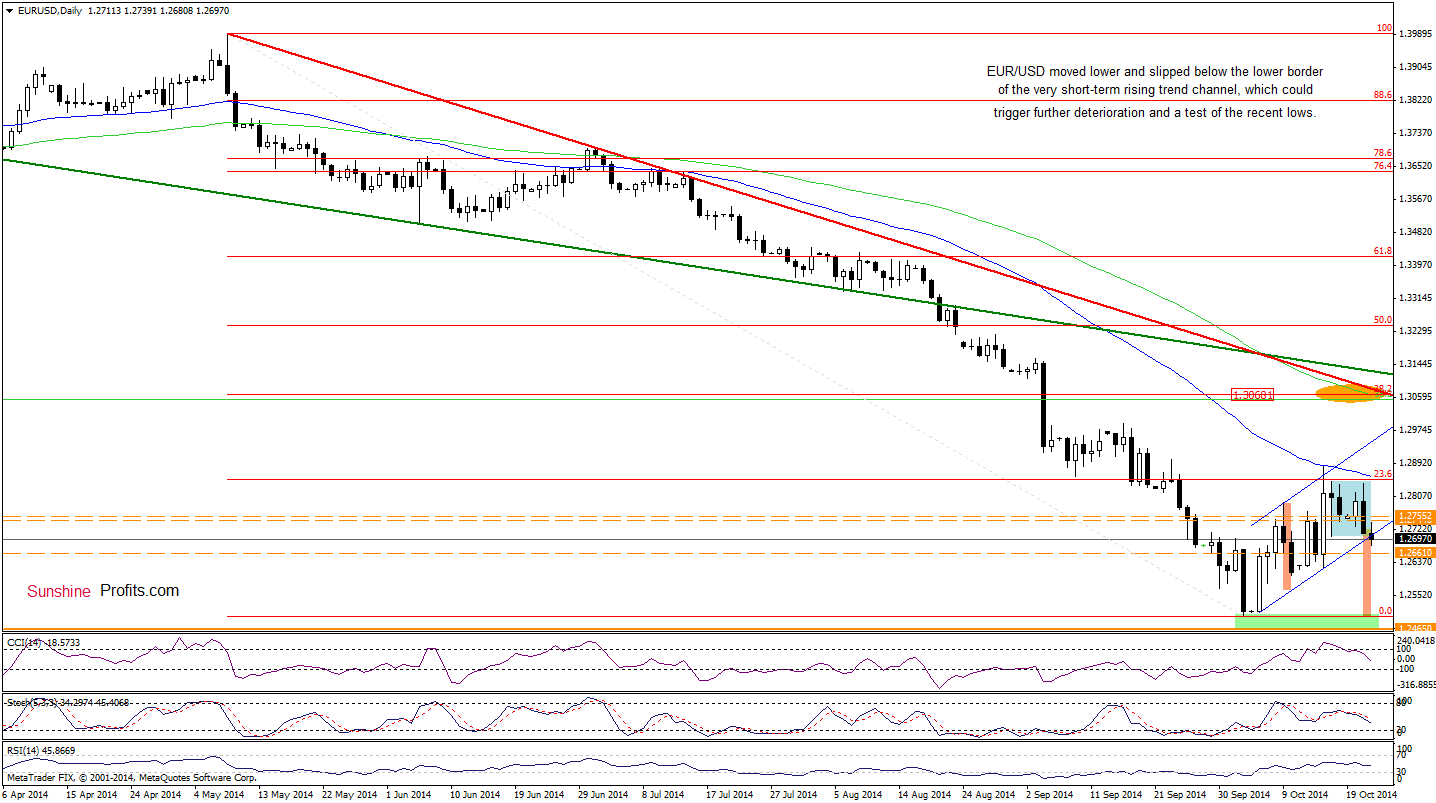
Looking at the daily chart, we see that the situation in the very short term has deteriorated as EUR/USD dropped below the lower line of the rising trend channel and the lower border of the consolidation (marked with blue). This is a bearish signal, which suggests further declines. Therefore, what we wrote yesterday is up-to-date:
(…) taking into account sell signals generated by the CCI and Stochastic Oscillator, we should also consider a bearish scenario. In this case, a potential breakdown could trigger a test of the strength of the recent lows.
Please note that in this area the size of the downward move will correspond to the height of the trend channel.
Very short-term outlook: bearish
Short-term outlook: mixed with bearish bias
MT outlook: mixed
LT outlook: bearish
Trading position (short-term): In our opinion, no positions are justified from the risk/reward perspective at the moment. We will consider re-enter long positions at lower levels . We will keep you informed should anything change, or should we see a confirmation/invalidation of the above.
GBP/USD
In our last commentary on this currency pair, we wrote:
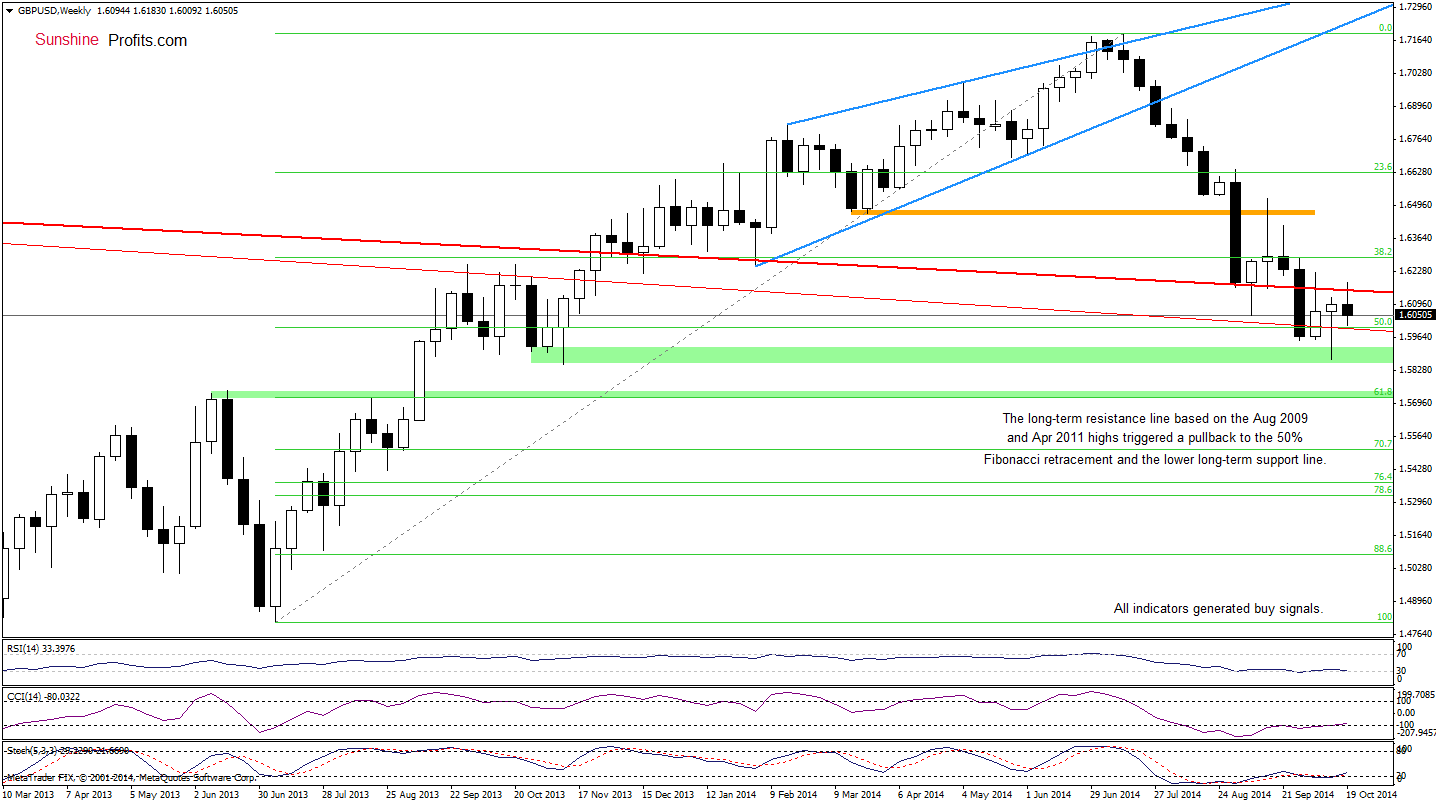
(…) the exchange rate invalidated the breakdown under the long-term support red line (based on the Apr 2011 and Dec 2012 highs), which resulted in further rally and an increase to the upper long-term resistance red line (based on the Aug 2009 and Apr 2011 highs) (…) slightly above this line is also the medium-term declining resistance line seen on the daily chart, which together create a strong resistance area. Therefore, we think that even if the pair moves little higher in the very short-term, the above-mentioned resistance zone will trigger a pullback in the coming days. In our opinion, this scenario will be even more likely, if the CCI and Stochastic Oscillator generate sell signals.
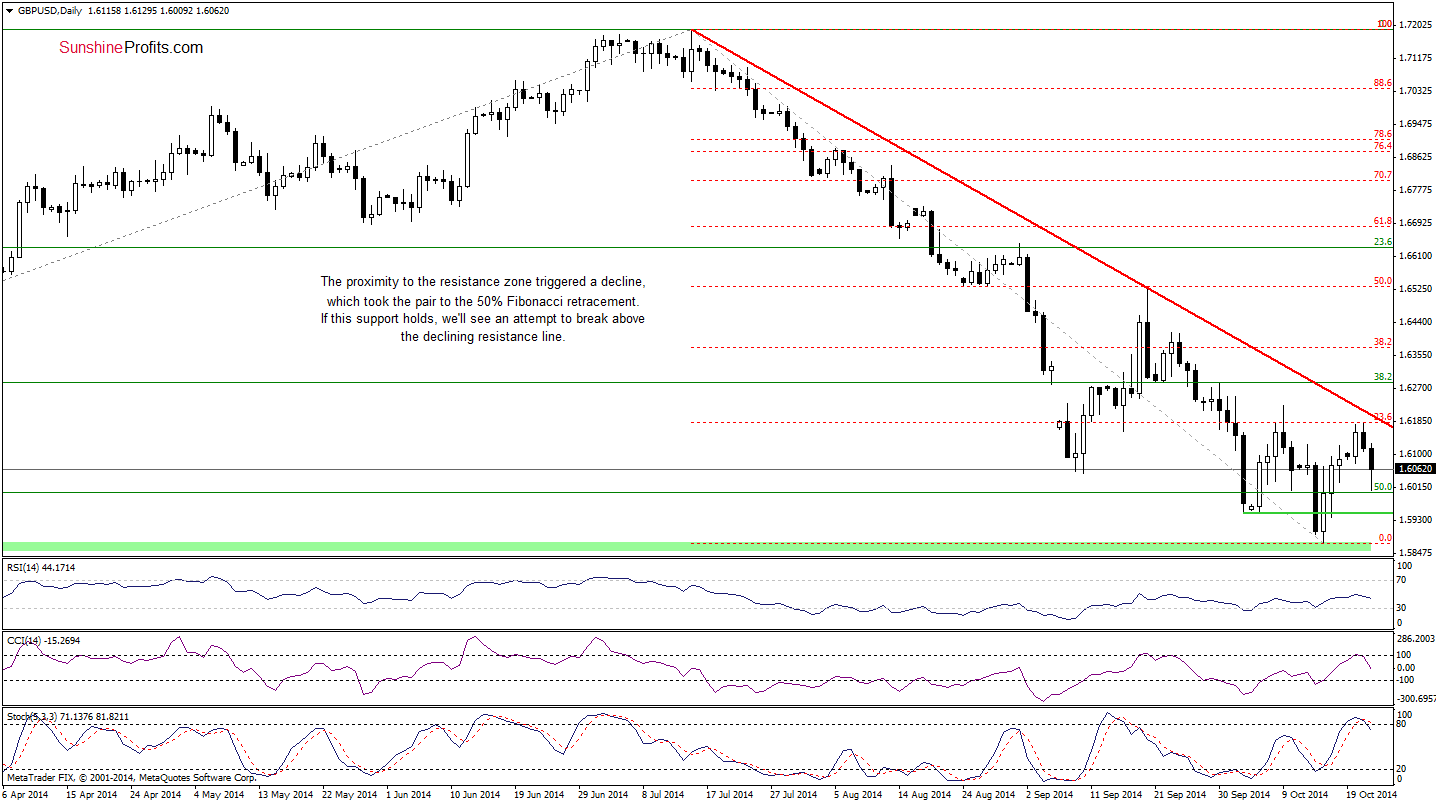
From today’s point of view, we see that the above-mentioned resistance zone encouraged currency bears to push the pair lower as we expected. With this downswing, GBP/USD dropped to the 50% Fibonacci retracement and the long-term support red line (based on the Apr 2011 and Dec 2012 highs). If this support area holds, we’ll see an attempt to break above the declining resistance line marked on the daily chart. However, taking into account the medium-term resistance line and sell signals generated by the daily indicators, it seems that the exchange rate will move lower. If this is the case, the initial downside target would be around 1.5953, where the Oct 3, Oct 6 and Oct 16 lows are.
Very short-term outlook: bearish
Short-term outlook: mixed with bearish bias
MT outlook: mixed
LT outlook: mixed
Trading position (short-term): In our opinion, no positions are justified from the risk/reward perspective. We will keep you informed should anything change, or should we see a confirmation/invalidation of the above.
AUD/USD
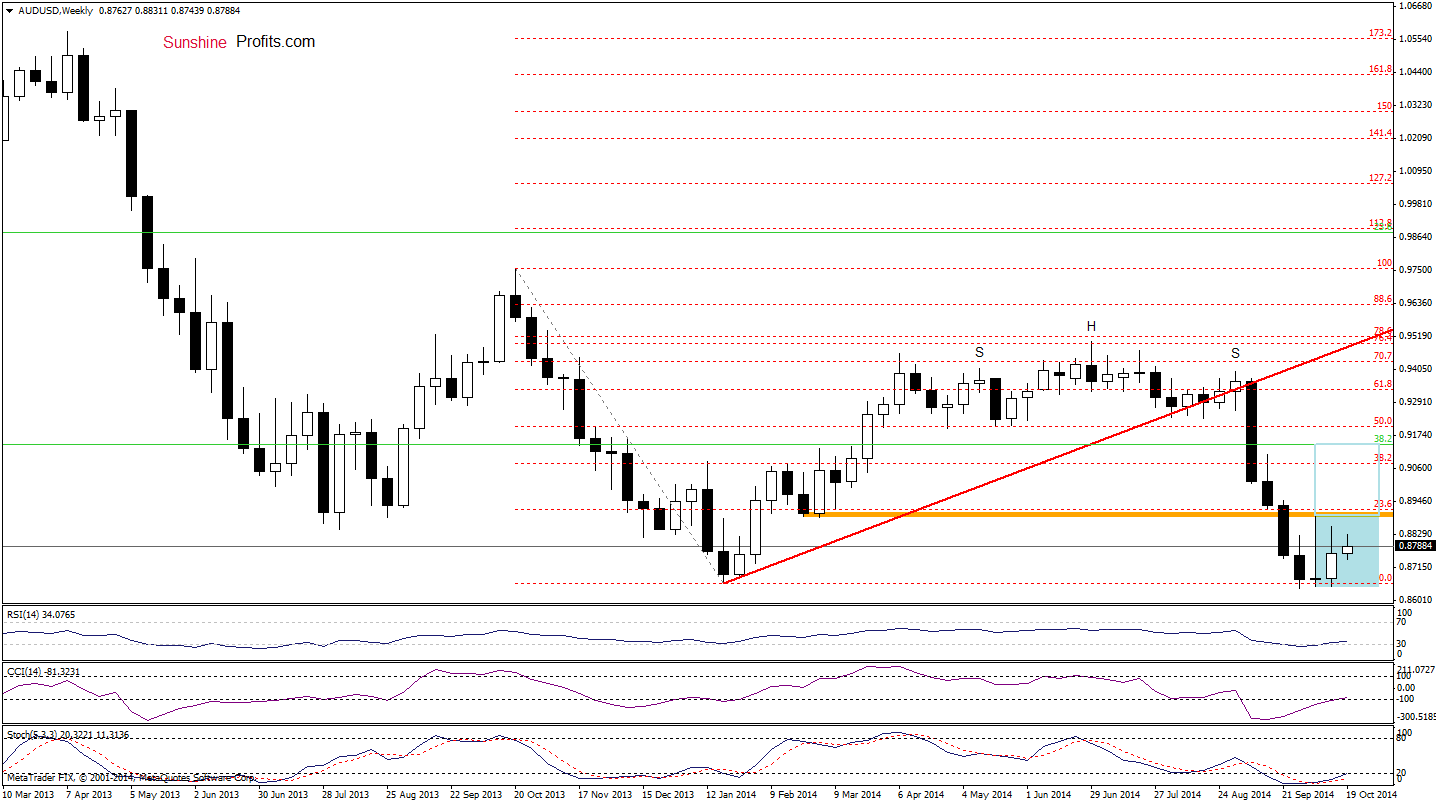
Looking at the weekly chart, we see that the situation hasn’t changed much as AUD/USD is still trading in a narrow range between the resistance level based on the March low (marked with orange) and the recent lows. Will the daily chart give us more clues about future moves? Let’s check.
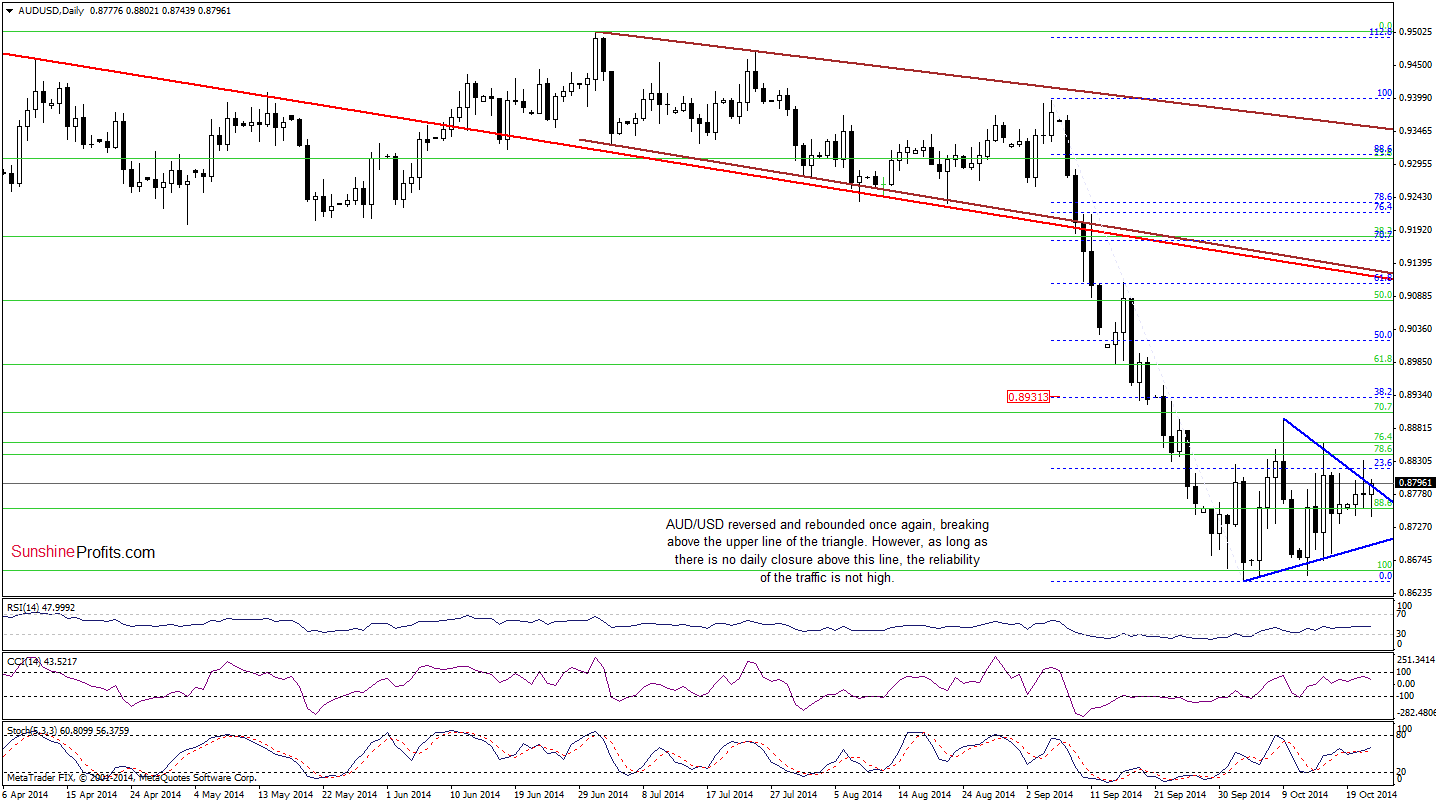
The first thing that catches the eye on the above chart is a breakout above the upper line of the blue triangle. Although this is a bullish signal, we should keep in mind that we saw similar price action yesterday. Therefore, in our opinion this positive event will be much more reliable if the exchange rate closes the day above this support/resistance line. If this is the case, and we’ll see such price action, the initial upside target for currency bulls will be the Oct 9 high of 0.8896 and then the 38.2% Fibonacci retracement based on the Sep-Oct decline around 0.8931.
Very short-term outlook: mixed with bullish bias
Short-term outlook: bullish
MT outlook: mixed
LT outlook: bearish
Trading position (short-term; our opinion): Long positions with a stop-loss order at 0.8587 are still justified from the risk/reward perspective at the moment. We will keep you informed should anything change, or should we see a confirmation/invalidation of the above.
Thank you.
Nadia Simmons
Forex & Oil Trading Strategist
Przemyslaw Radomski, CFA
Founder, Editor-in-chief
Gold & Silver Trading Alerts
Forex Trading Alerts
Oil Investment Updates
Oil Trading Alerts

