
Earlier today, Statistics Canada reported that the number of employed people rose by 74,1000 in September, beating expectations for an increase of 20,000. Additionally, Canada's unemployment rate fell to 6.8% last month from 7.0% in August. Thanks to these better-than-expected numbers the U.S. dollar erased gains against its Canadian counterpart. What happened with other major currency pairs? Did weaker greenback change their short-term outlooks?
In our opinion, the following forex trading positions are justified - summary:
- EUR/USD: long (stop-loss order: 1.2560; initial price target: 1.3072)
- GBP/USD: none
- USD/JPY: short (stop-loss order: 110.73; initial price target: 105.20)
- USD/CAD: short (stop-loss order: 1.1360; initial price target: 1.1021)
- USD/CHF: short (stop-loss order: 0.9711; initial price target: 0.9332)
- AUD/USD: long (stop-loss order: 0.8587; initial price target: 0.8943)
EUR/USD
Yesterday, we wrote the following:
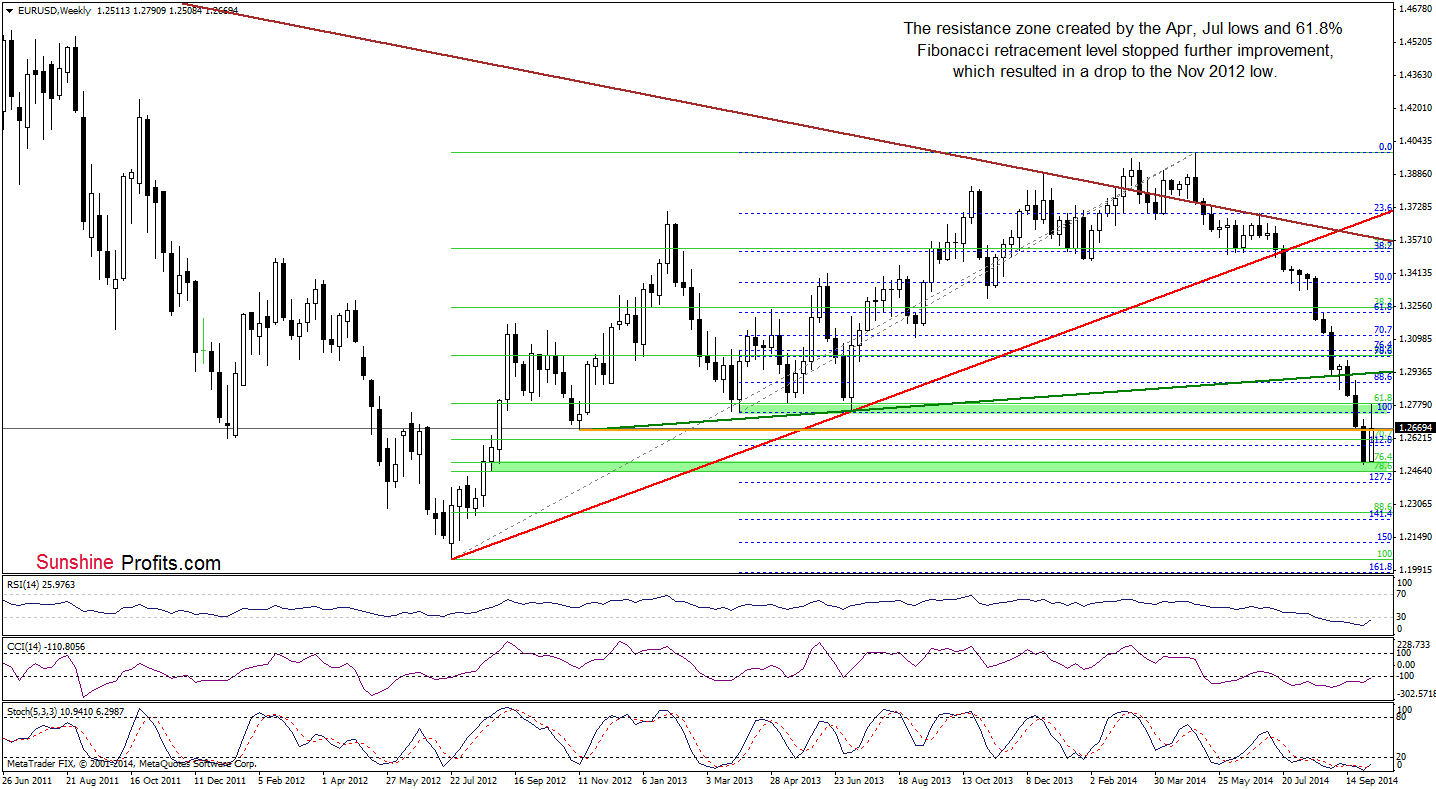
(…) the exchange rate reached the resistance zone (created by the Apr, Jul 2013 lows and the previously-broken 61.8% Fibonacci retracement ), which could pause further improvement.
As you see on the weekly chart, the situation developed in line with the above-mentioned scenario and EUR/USD gave up some gains, slipping to the Nov 2012 low. What’s next? Let’s examine the daily chart and look for more clues about future moves.
Quoting our last forex Trading Alert:
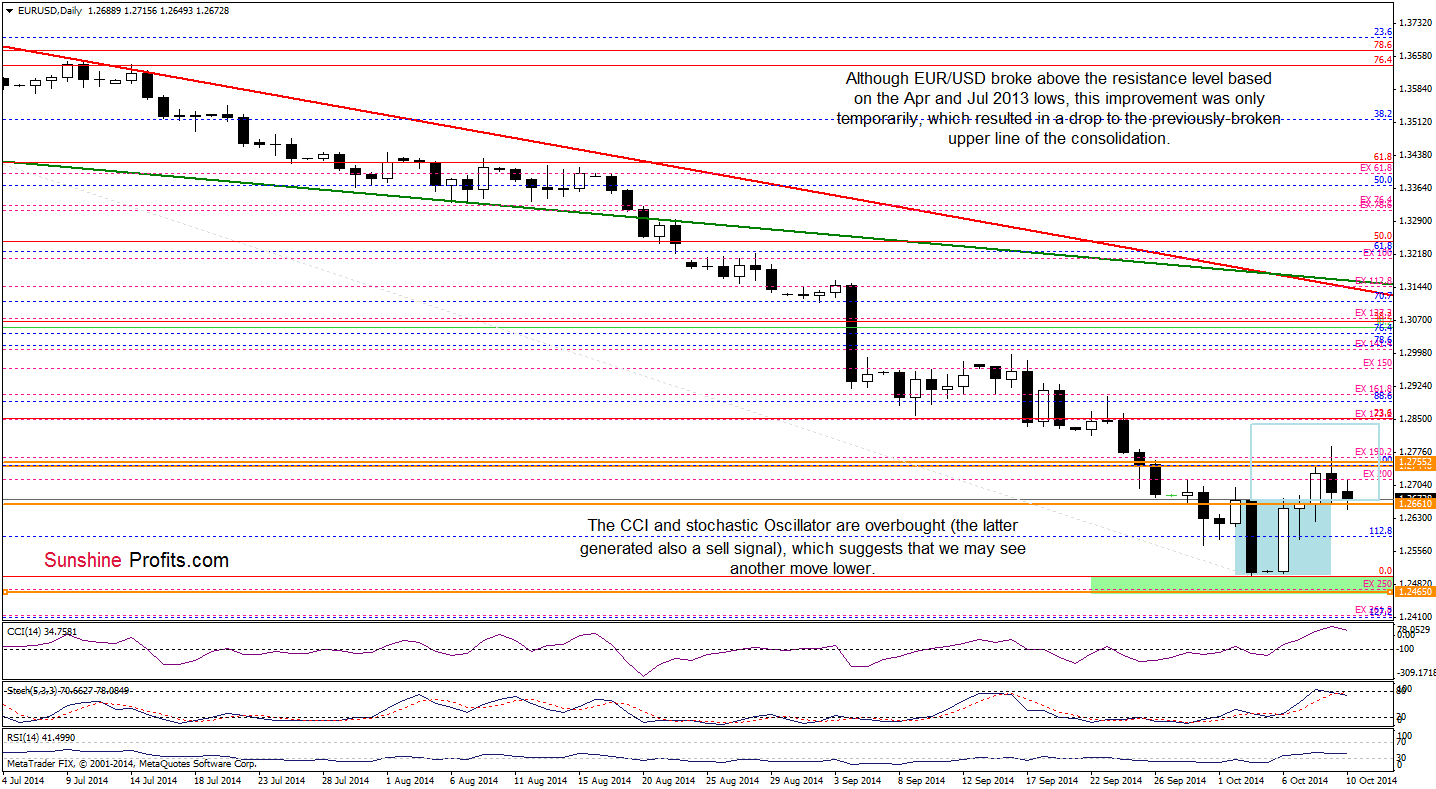
(…) we think that further rally will be more likely if we see a daily closure above 1.2755. Otherwise, a pullback from here to the previously-broken upper border of the consolidation should not surprise us.
From this perspective, we see that currency bears realized this scenario earlier today as we expected. If the pair moves lower and invalidates the breakout above the upper line of the consolidation, we’ll see further deterioration and a drop to around 1.2586, where the 61.8% Fibonacci retracement based on the recent rally and the Oct 7 low are.
Very short-term outlook: bullish
Short-term outlook:mixed with bullish bias
MT outlook: mixed
LT outlook: bearish
Trading position (short-term; in our opinion): Long positions with a stop-loss order at 1.2560 are justified from the risk/reward perspective at the moment. We will keep you informed should anything change, or should we see a confirmation/invalidation of the above.
GBP/USD
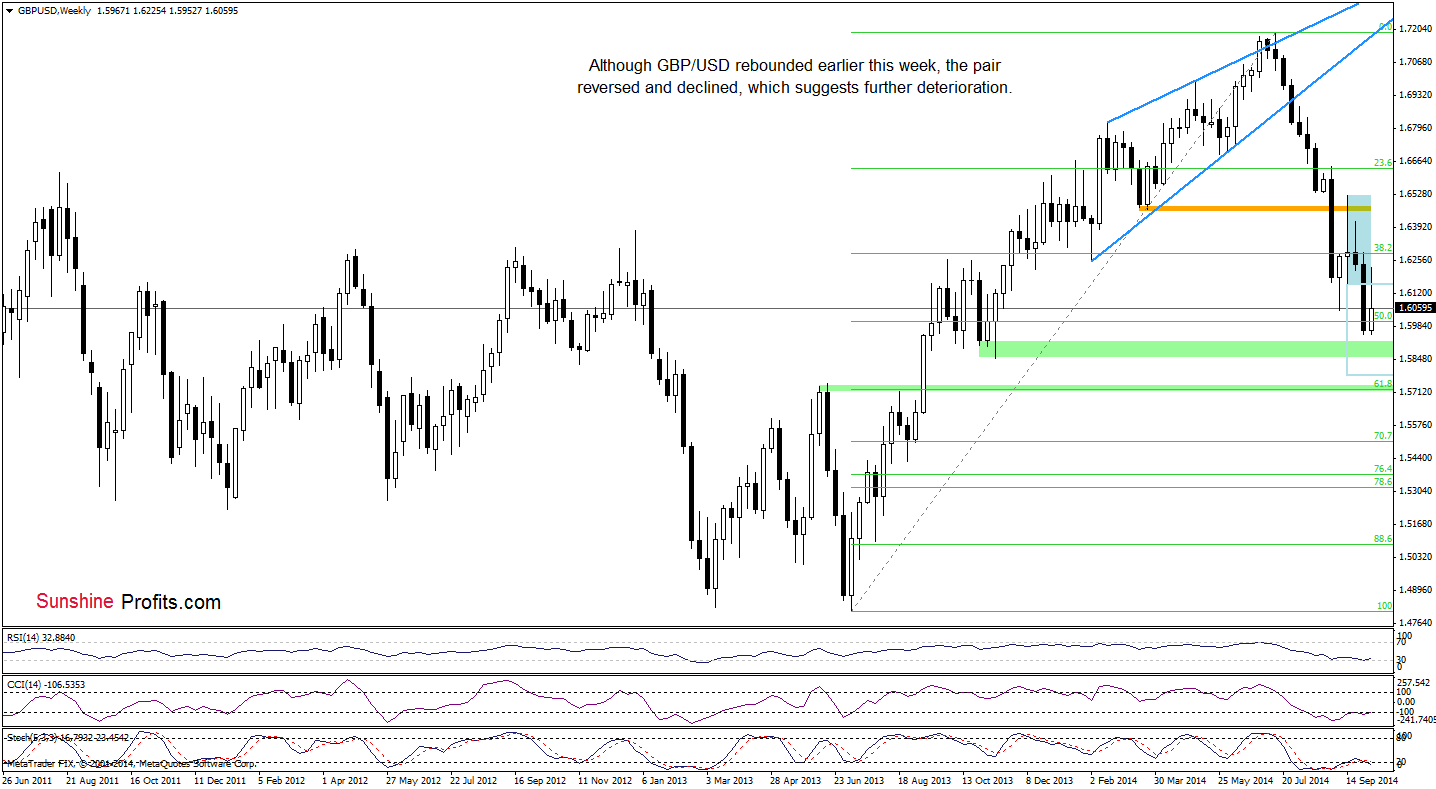
The situation in the medium term hasn’t changed much as GBP/USD is trading between the last week’s high and low. Nevertheless, we should keep in mind that the pair erased most of this week rally and approached the 50% Fibonacci retracement, which is a negative sign. Will we see further deterioration? Let’s check what can we infer from the daily chart.
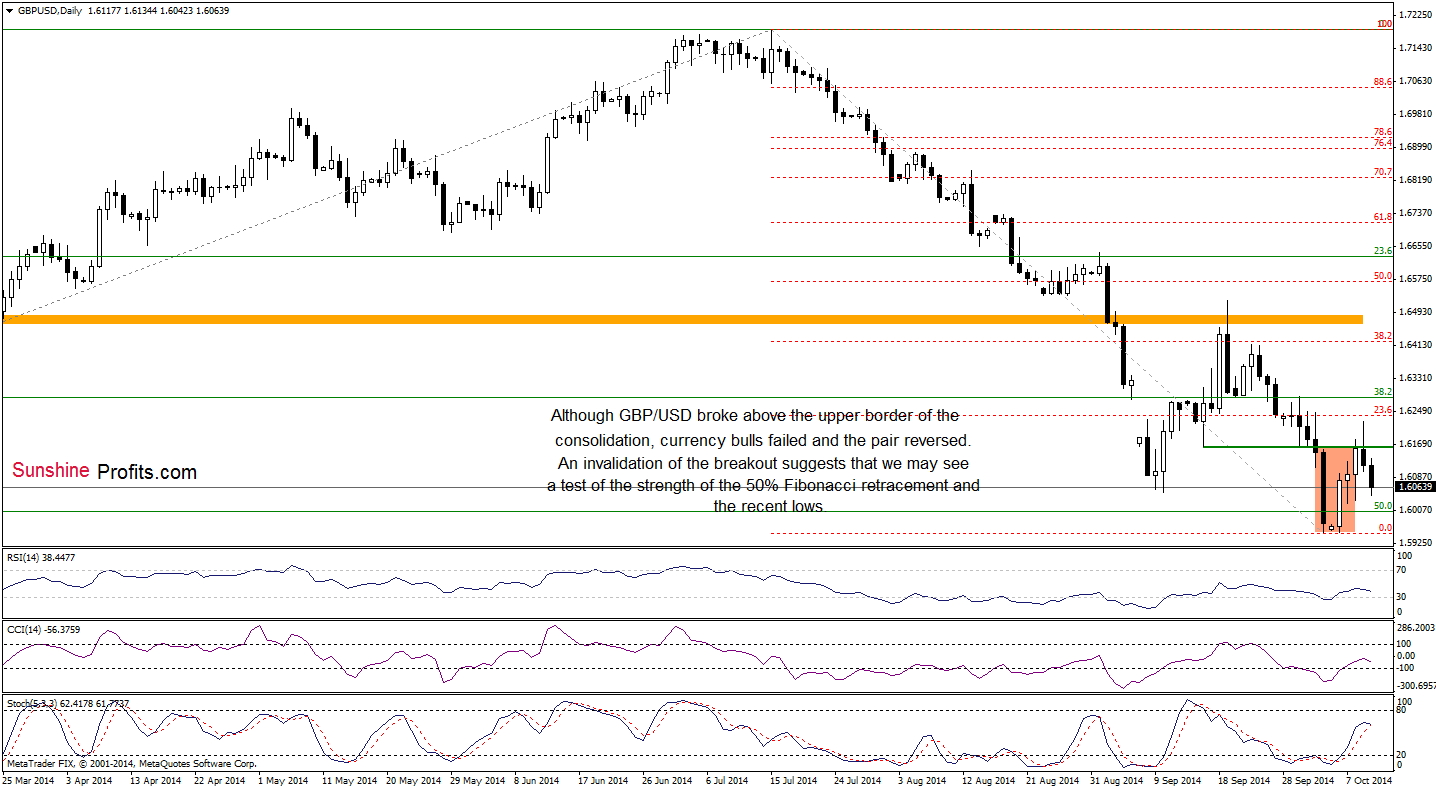
On the daily chart, we see that although GBP/USD broke above the upper line of the consolidation, this improvement was only temporarily and the exchange rate reversed, invalidating earlier breakout. As you see, this bearish signal triggered a pullback in the recent days and it seems that the next target for currency bears will be the 50% Fibonacci retracement at 1.6005 or the Oct 3 low. Please note that even if the pair drops below it, the space for further declines seems limited by the green support zone seen on the weekly chart (around 1.5853-1.5907).
Very short-term outlook: bearish
Short-term outlook: mixed
MT outlook: mixed
LT outlook: mixed
Trading position (short-term): In our opinion, no positions are justified from the risk/reward perspective. We will keep you informed should anything change, or should we see a confirmation/invalidation of the above.
USD/JPY
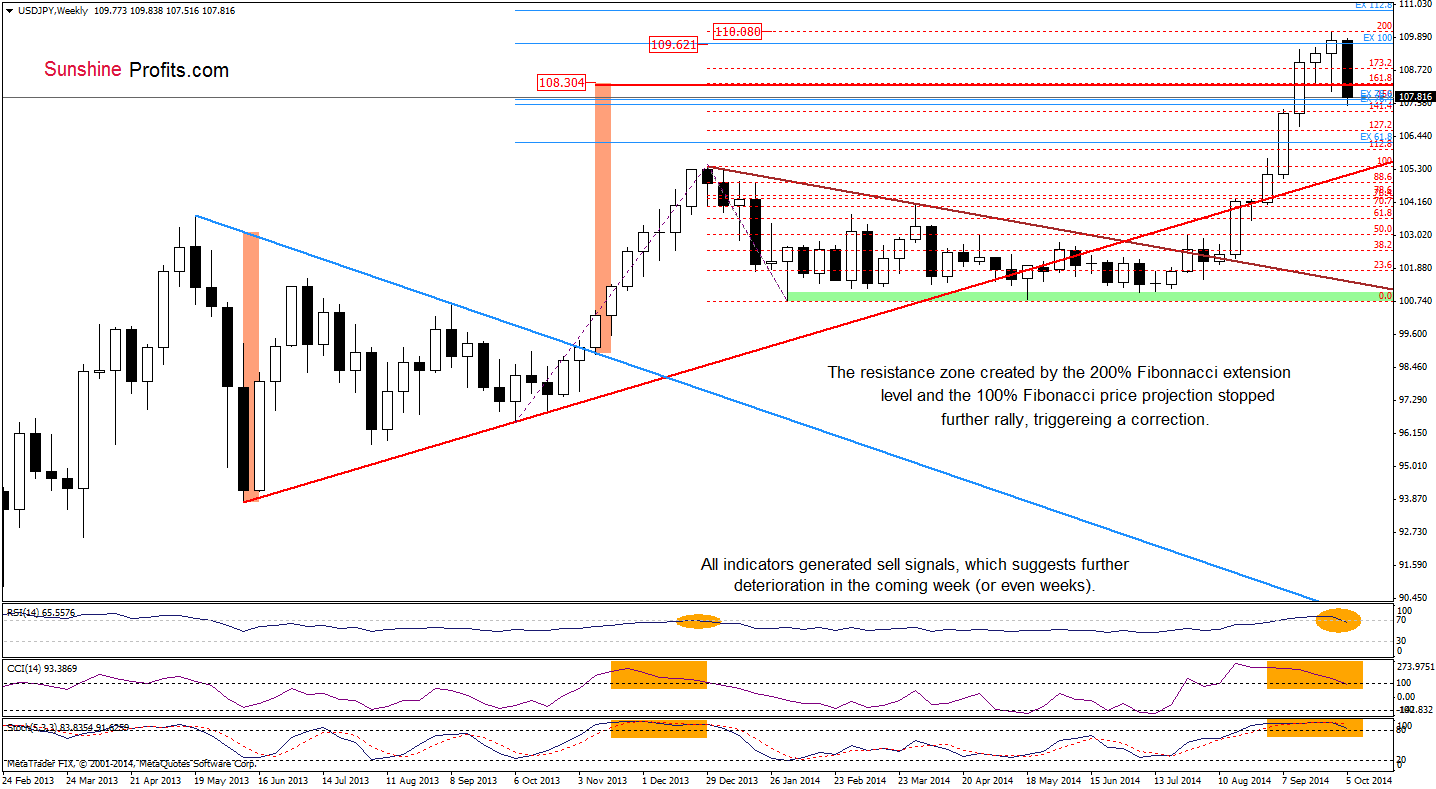
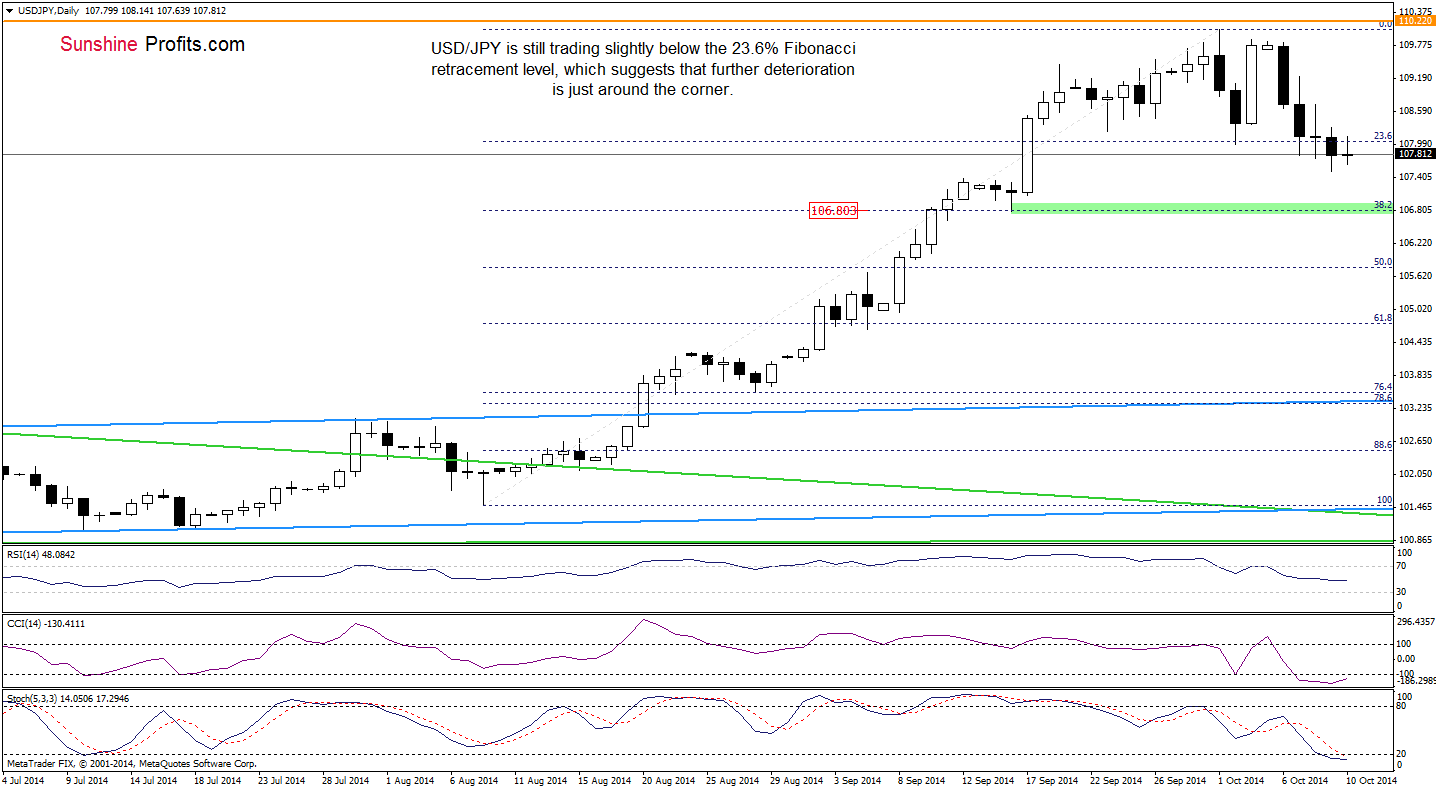
The medium- and short-term picture hasn’t changed much as USD/JPY is still trading around the 23.6% Fibonacci retracement based on the Aug-Sep rally. Therefore, what we wrote in our last commentary on this currency pair is up-to-date:
(…) the pair is still trading under the resistance zone created by the recent high and the 200% Fibonacci extension and 100% Fibonacci price projection. Therefore, we maintain our assumption from the previous commentary that the next bigger move will be to the downside. Please note that this scenario is currently reiforced by sell signals generated by the daily RSI and CCI (a correction will accelerate, if the weekly indicators also generate sell signals). In our opinion, the initial downside target will be the support area created by the Thursday’s low and the 23.6% Fibonacci retracement. If it is broken, the next target for currency bears will be around 106.80, where the 38.2% Fibonacci retracement and the bottom of the correction that we saw in mid-Sep is.
We would like to point out that the indicators have flashed sell signals. When the same happened after the previous signfican rally (marked on the above chart with orange rectangles), a decline followed.
Very short-term outlook: bearish
Short-term outlook: mixed with bearish bias
MT outlook: mixed
LT outlook: bearish
Trading position (short-term; our opinion): Short positions with a stop-loss order at 110.23 are justified from the risk/reward perspective at the moment. We will keep you informed should anything change, or should we see a confirmation/invalidation of the above.
USD/CAD
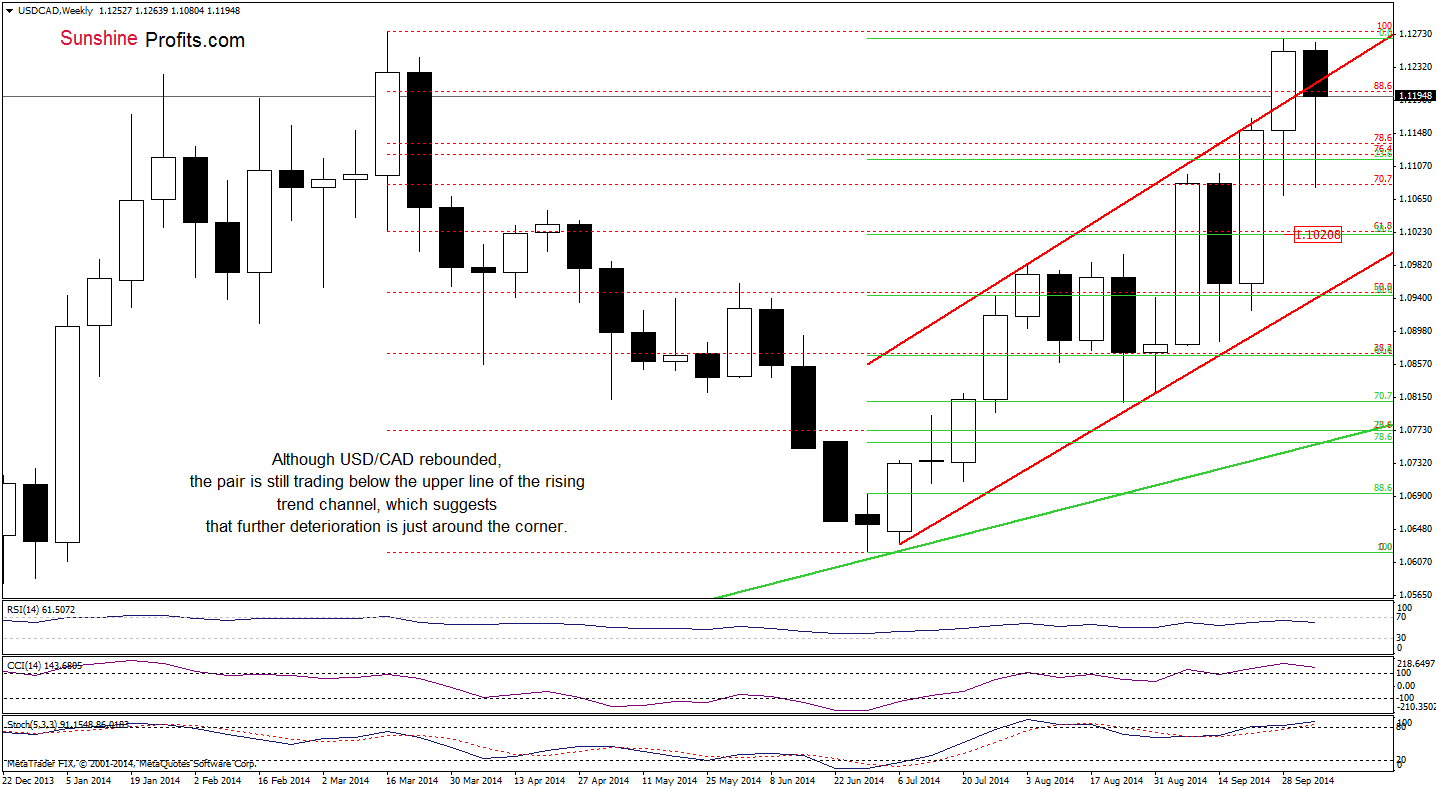
From this perspective, we see that although USD/CAD rebounded, the exchange rate is still trading under the upper border of the rising trend channel, which together with the March high keeps gains in check. Where will the pair head next? Let’s examine the daily chart.
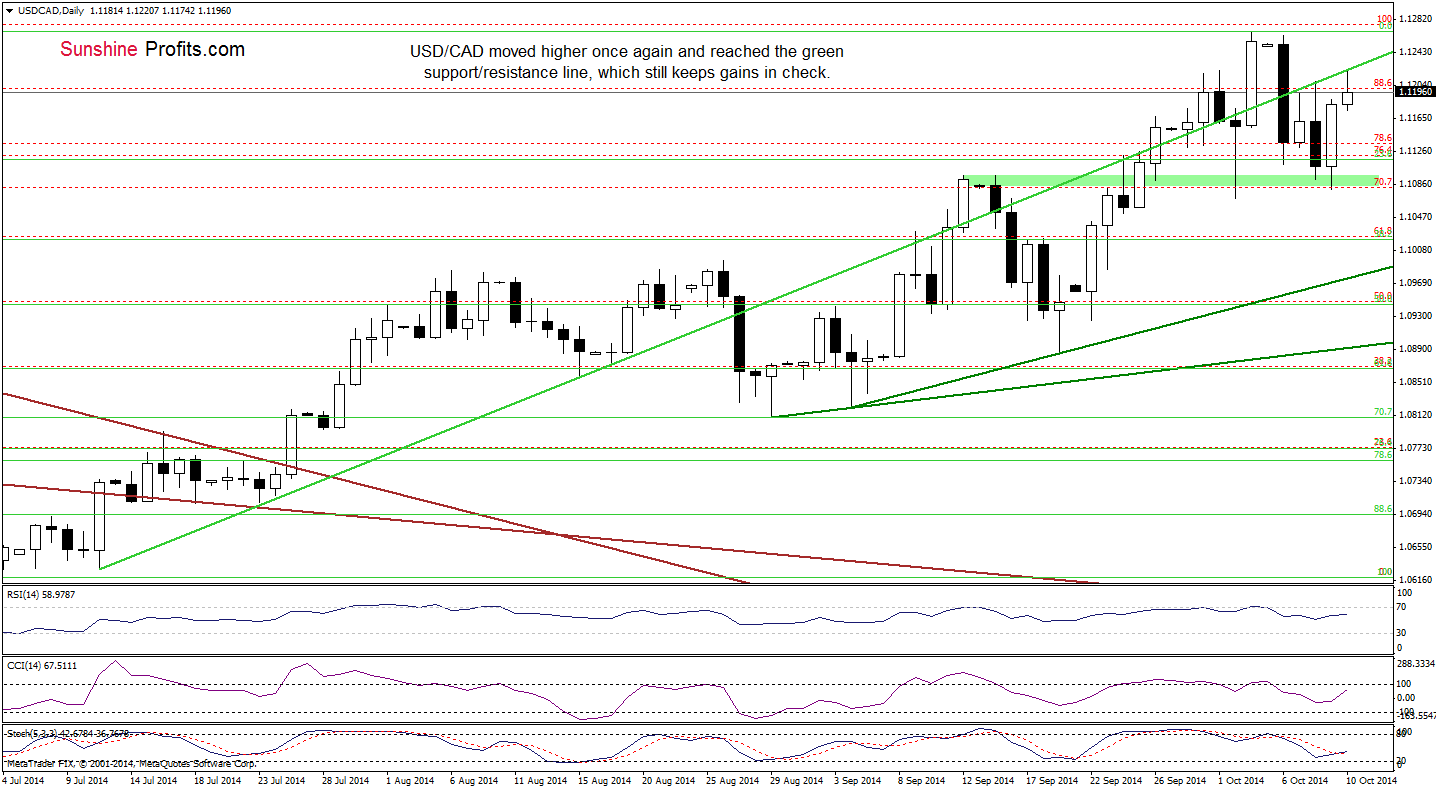
Looking at the daily chart, we see that the exchange rate bounced off the support area created by the mid-Sep highs and reached the key support/resistance line once again. Although we saw a similar situation on Tuesday and Wednesday, currency bulls didn’t manage to push the pair above it. Taking this fact into account, and combining it with the medium-term picture, we think that the history will repeat itself once again and USD/CAD will decline from here in the coming day or days. Therefore, what we wrote in our last commentary on this currency pair is up-to-date:
(…) we think that the next sizable move will be to the downside. In our opinion, the correcion will accelerate, if the pair drops under the support area created by the mid-Sep highs and the Oct 2 low. If this is the case, we’ll see further corrction and the downside target would be around 1.1021, where the 38.2% Fibonacci retracement (based on the Jul-Oct rally) is.
Very short-term outlook: bearish
Short-term outlook: bearish
MT outlook: mixed with bearish bias
LT outlook: bearish
Trading position (short-term; our opinion): Short positions with a stop-loss order at 1.1360 are justified from the risk/reward perspective at the moment. We will keep you informed should anything change, or should we see a confirmation/invalidation of the above.
USD/CHF
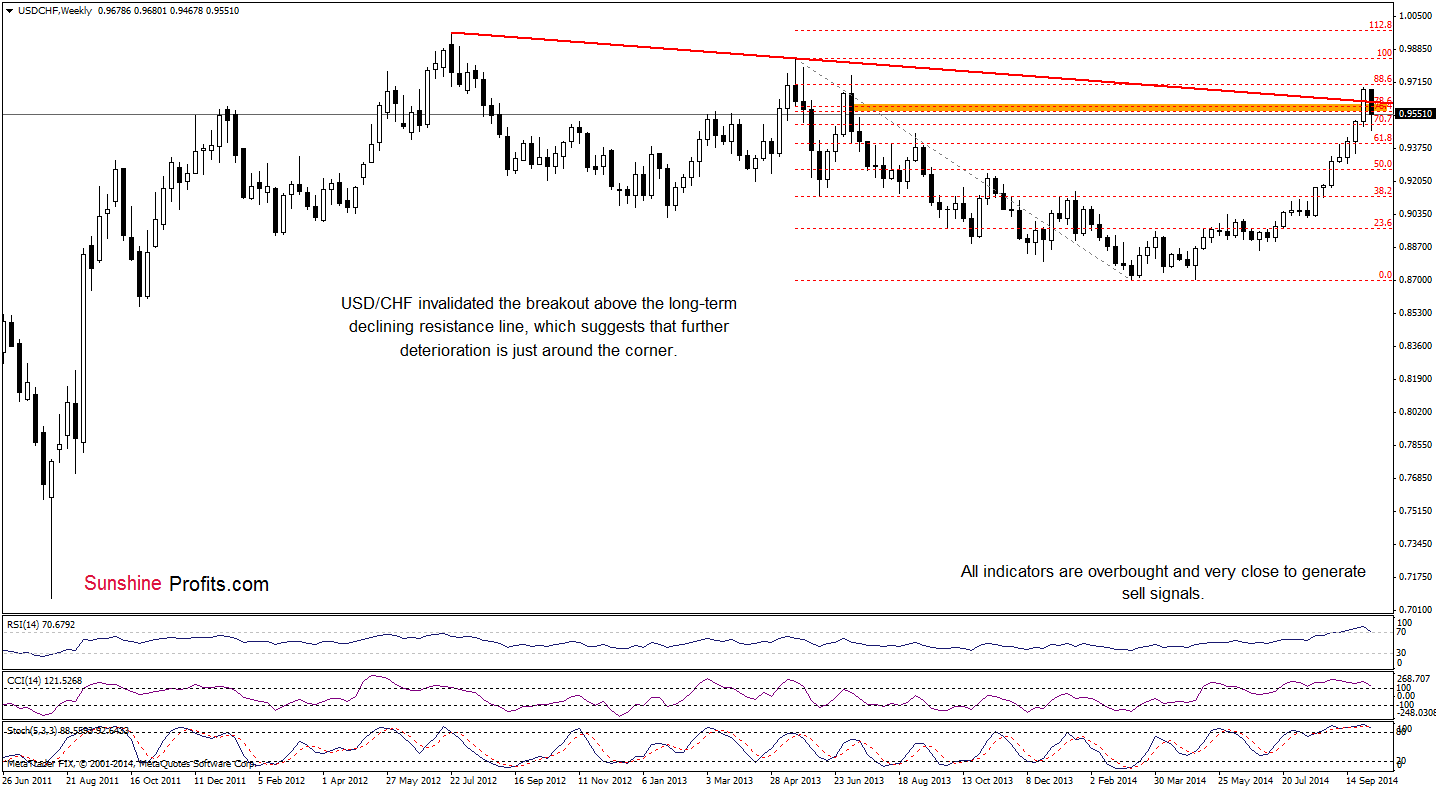
The situation in the medium-term hasn’t changed much since our last commentary on this currency pair was posted. Therefore, what we wrote back then is up-to-date:
The most important thing that we would like to emphasize on the above chart is the invalidation of the breakout above the combination of resistance levels. The USD/CHF pair is now back below the declining support/resistance line, which is a bearish sign.
(…) When we take a closer look, we see that the proximity to this line was enough to trigger a correction in Jul 2013. What’s interesting, back then, all reading of the indicators were lower than now. All the above, provides us with bearish implications and suggests that a bigger correction is just around the corner.
Once we know the above, let’s focus on the very short-term changes.
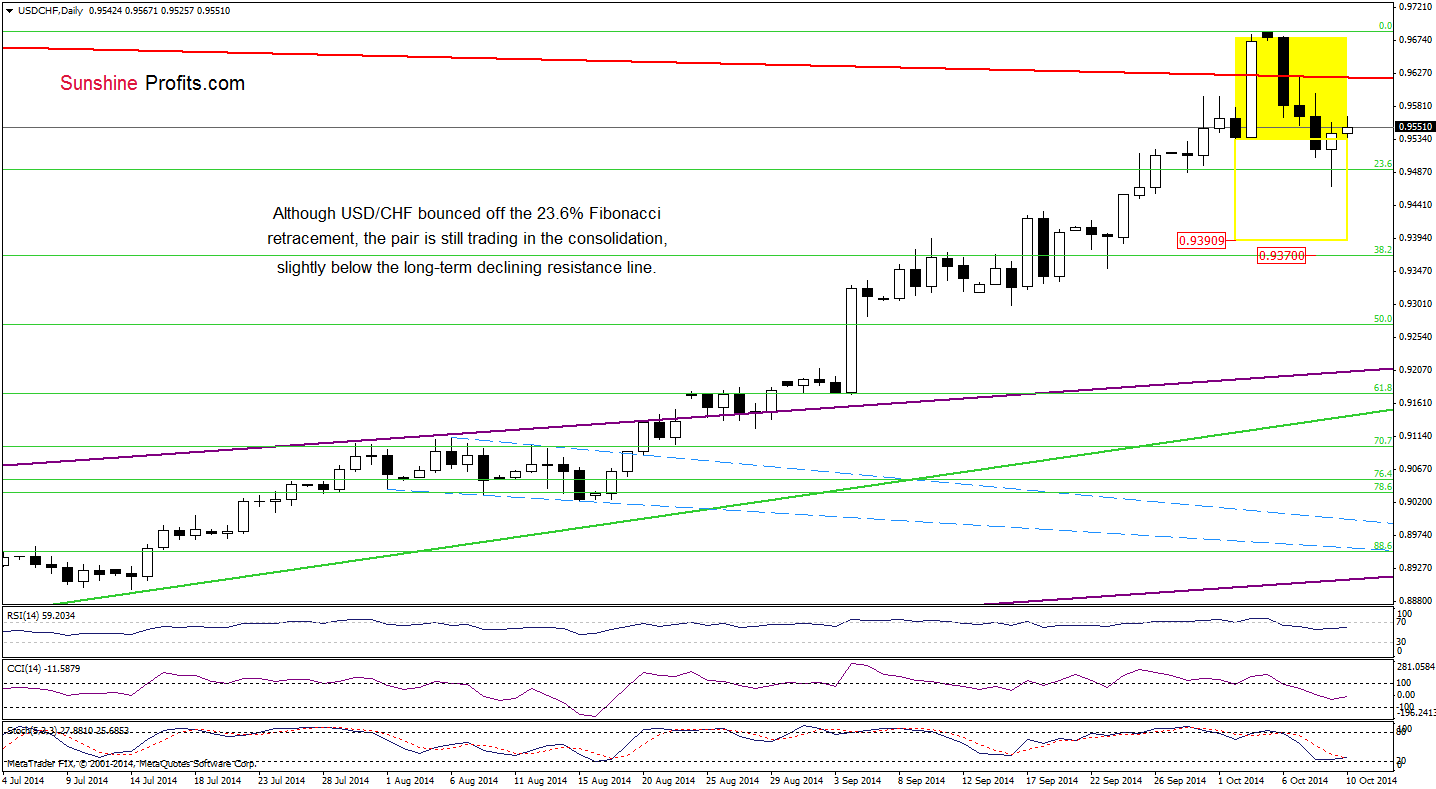
Looking at the daily chart, we see that the situation in the very short-term also hasn’t changed much as USD/CHF is still trading in a consolidation slightly below the long-term resistance line. Although the pair could go both north or south from here, we think that the resistance area marked on the weekly chart will be strong enough to stop further improvement. If this is the case, and the exchange rate drops under the 23.6% Fibonacci retracement, we’ll see a correction to at least 0.9391, where the size of the downward move will correspond to the height of the formation.
Very short-term outlook: mixed with bearish bias
Short-term outlook: mixed with bearish bias
MT outlook: bearish
LT outlook: bearish
Trading position (short-term; our opinion): Short positions with a stop-loss order at 0.9711are justified from the risk/reward perspective at the moment. We will keep you informed should anything change, or should we see a confirmation/invalidation of the above.
AUD/USD
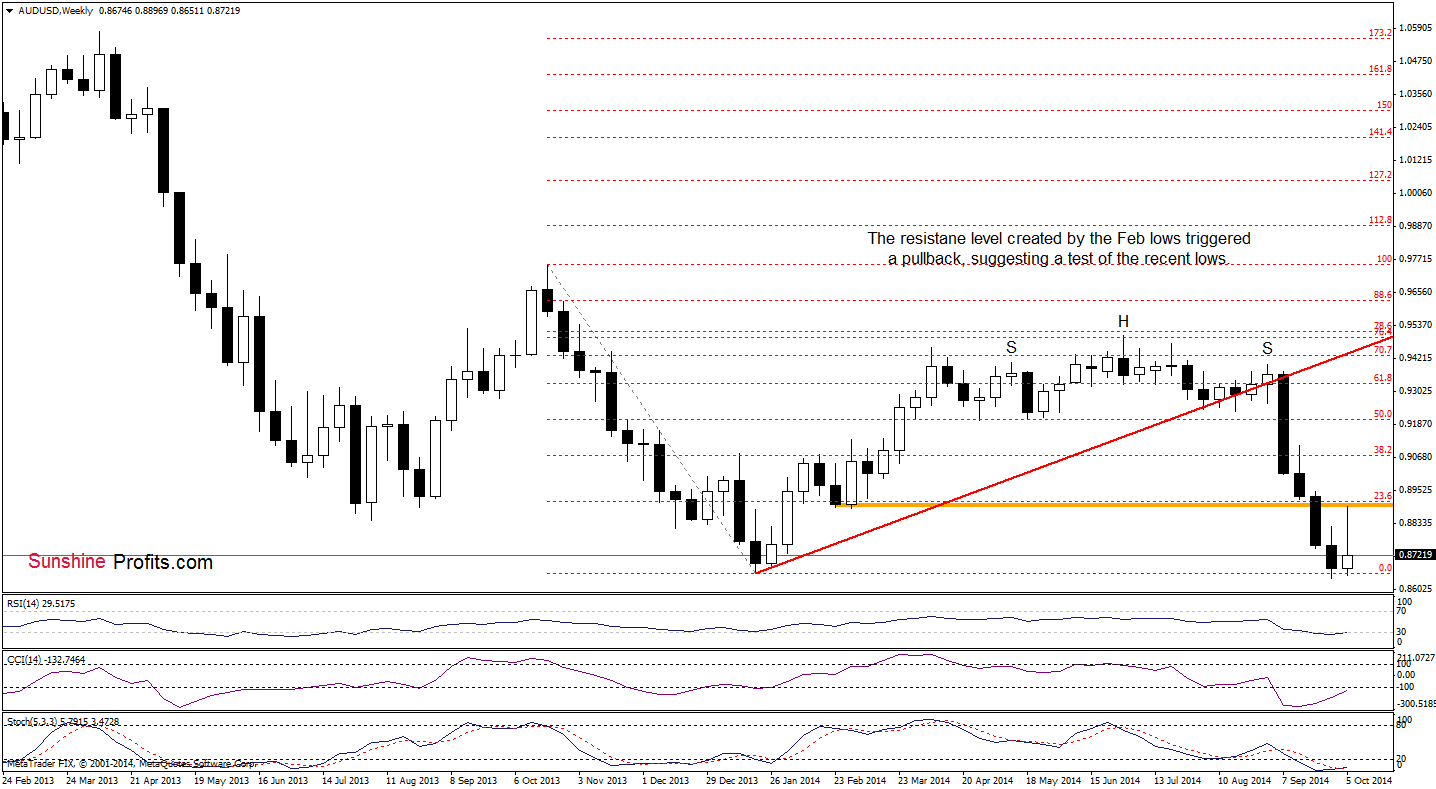
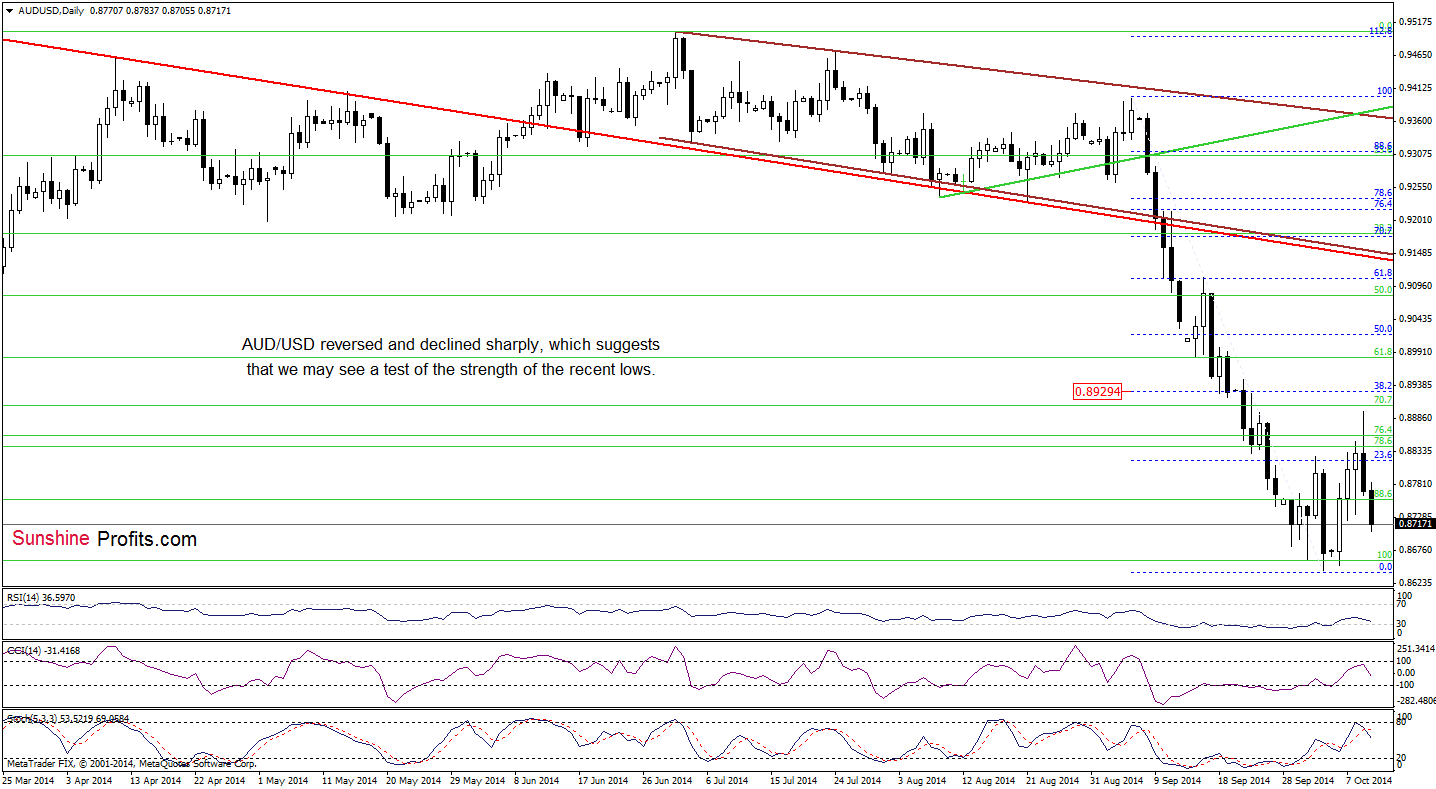
The overall situation has deteriorated slightly as the resistance level based on the Feb lows triggered a pullback. As a result, AUD/USD reversed and declined, which suggests that we may see a test of the strength of the recent lows in the coming day (or days). Although this scenario is currently reinforced by the position of the daily CCI and Stochastic Oscillator (which generated a sell signal), it seems to us that we won’t see another sizable downward move as weekly indicators are oversold and very close to generate buy signals.
Very short-term outlook: mixed with bullish bias
Short-term outlook: mixed
MT outlook: mixed
LT outlook: bearish
Trading position (short-term; our opinion): Long positions with a stop-loss order at 0.8587 are justified from the risk/reward perspective at the moment. We will keep you informed should anything change, or should we see a confirmation/invalidation of the above.
Thank you.
Nadia Simmons
Forex & Oil Trading Strategist
Przemyslaw Radomski, CFA
Founder, Editor-in-chief
Gold & Silver Trading Alerts
Forex Trading Alerts
Oil Investment Updates
Oil Trading Alerts

