
Earlier today, official data showed that industrial output in Germany dropped by 4.0% in August, missing forecast for a 1.5% decline. This largest decline since early 2009 pushed EUR/USD lower, but did this move change anything?
In our opinion, the following forex trading positions are justified - summary:
- EUR/USD: none
- GBP/USD: none
- USD/JPY: short (stop-loss order: 110.73; initial price target: 105.20)
- USD/CAD: short (stop-loss order: 1.1360; initial price target: 1.1021)
- USD/CHF: short (stop-loss order: 0.9711; initial price target: 0.9332)
- AUD/USD: long (stop-loss order: 0.8587; initial price target: 0.8943)
EUR/USD
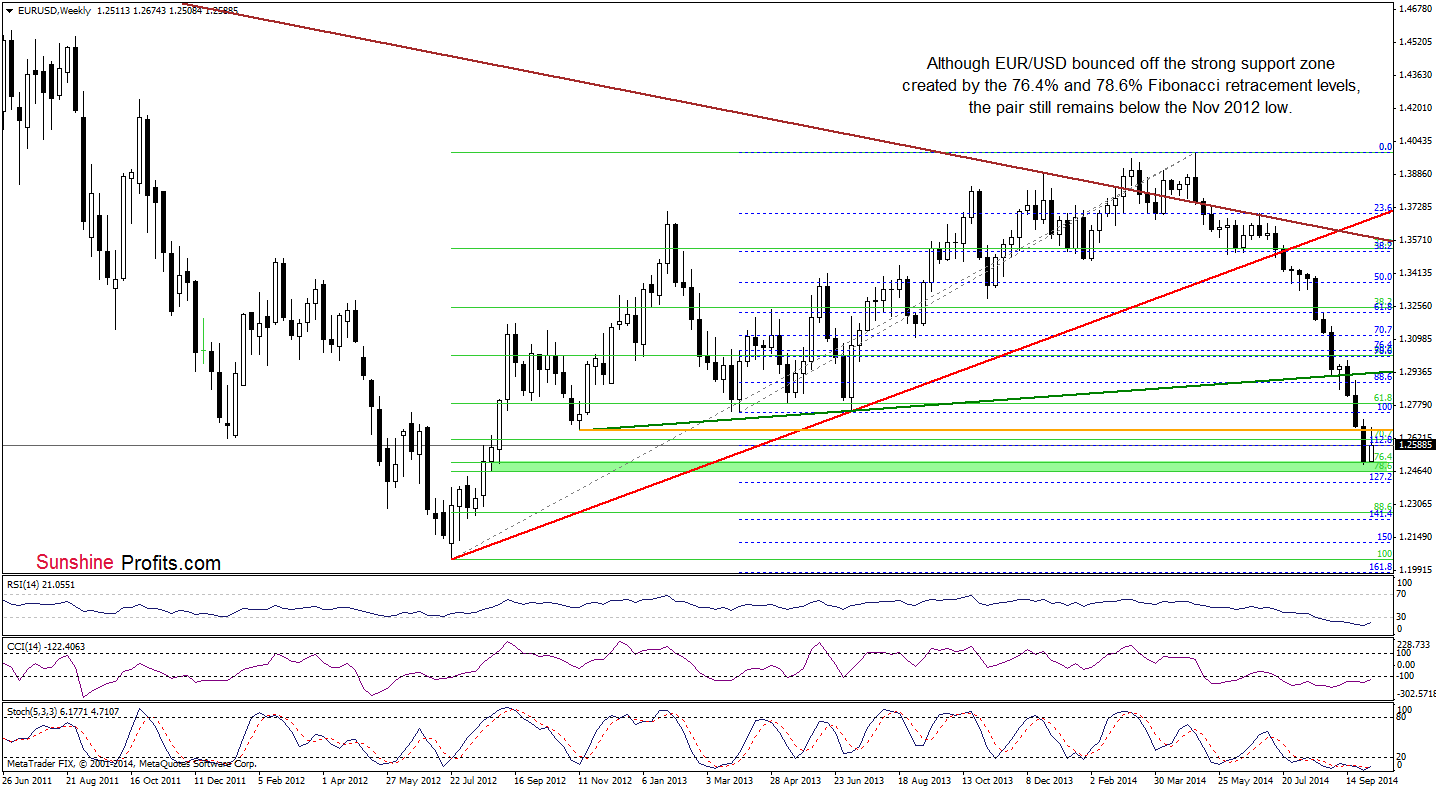
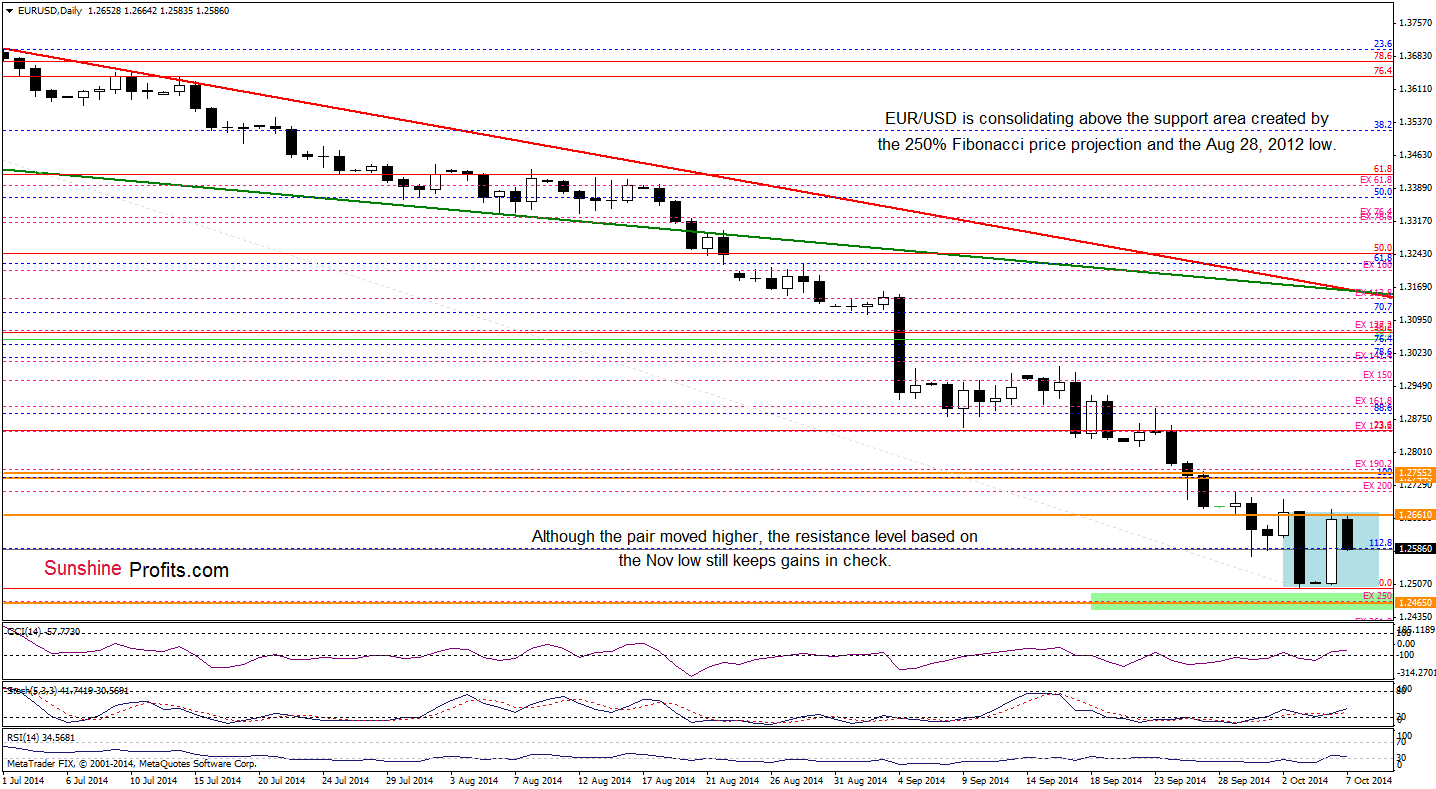
Looking at the above charts, we see that EUR/USD bounced off the solid green support zone, the resistance level based on the Nov 2012 low successfully stopped further improvement and triggered a pullback earlier today. Despite this small deterioration, the exchange rate is still trading in the consolidation between the above-mentioned support and resistance areas. Therefore, we believe that a breakout/breakdown will indicate the direction of future move. Although the pair could go both north or south from here, we think that even if the exchange rate moves little lower, the next bigger move will be to the upside as the combination of the 76.4% and 78.6% Fibonacci retracement levels and buy signals generated by all 3 daily indicators supports the bullish case at the moment.
Very short-term outlook: bullish
Short-term outlook:mixed with bullish bias
MT outlook: mixed
LT outlook: bearish
Trading position (short-term): In our opinion no positions are justified from the risk/reward perspective at the moment. We will keep you informed should anything change, or should we see a confirmation/invalidation of the above.
GBP/USD
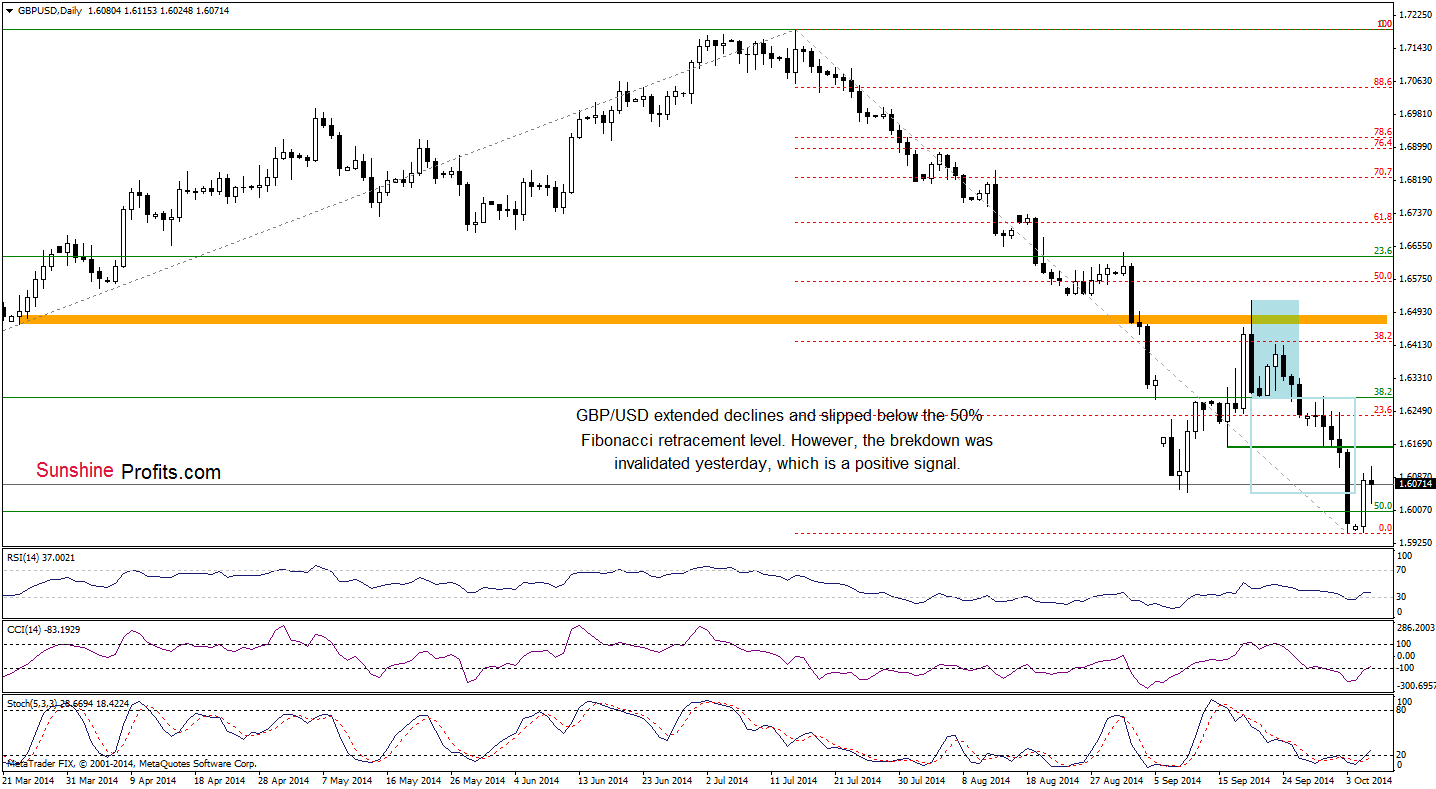
Quoting our last commentary on this currency pair:
(…) GBP/USD declined not only below the support level (created by the Sep 16 low), but also under the lower border of the consolidation (marked with blue on the weekly chart). (…) What’s next? (…) we’ll see (…) a test of the Sep low of 1.6051. (…) if this support level doesn’t withstand the selling pressure (which is quite possible as there is no buy signals supporting the bullish case), we’ll see a drop to the 50% Fibonacci retracement level or even a test of the barrier of 1.6000.
As you see on the daily chart, currency bears not only realized the above-mentioned scenario (as we expected), but also managed to push the pair below the barrier of 1.6000 on Friday. Despite this negative signal, the breakdown below these levels was invalidated, which triggered a rally above the Sep 10 low. Although GBP/USD gave up some gains earlier today, it seems to us that the next bigger move will be to the upside as all 3 indicators generated buy signals. If this is the case, the initial upside target would be around 1.6414-1.6424, where the Sep 23 and the 38.2% Fibonacci retracement are.
Very short-term outlook: bullish
Short-term outlook: mixed with bullish bias
MT outlook: mixed
LT outlook: mixed
Trading position (short-term): In our opinion, no positions are justified from the risk/reward perspective. We will keep you informed should anything change, or should we see a confirmation/invalidation of the above.
USD/CAD
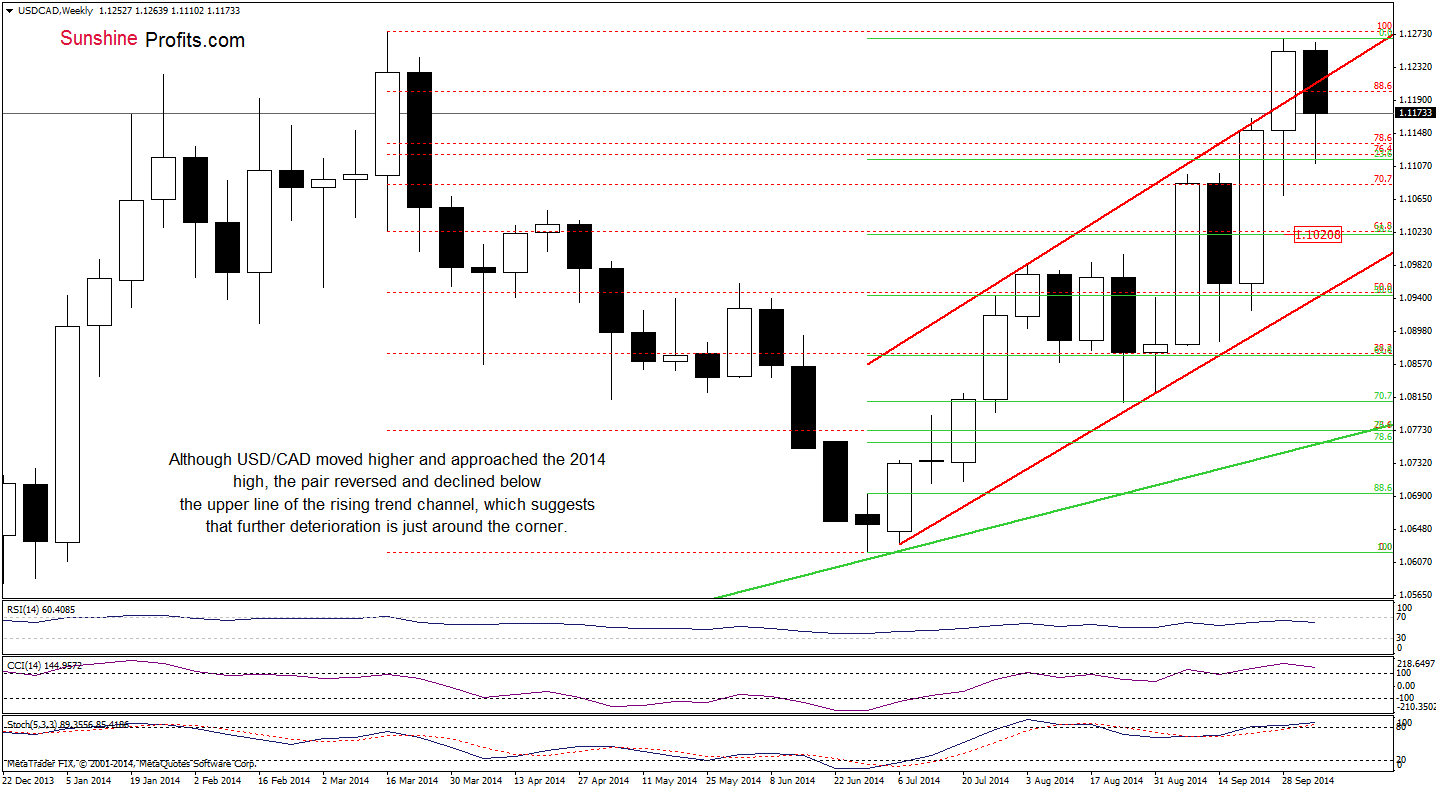
The first thing that catches the eye on the above chart is an invalidation of the breakout above the upper border of the rising trend channel. As you see, although USD/CAD broke above this line in the previous week, the proximity to the March high encouraged currency bears to act and resulted in a correction to the 23.6% Fibonacci retracement. Will we see further deterioration? Let’s examine the daily chart and look for more clues about future moves.
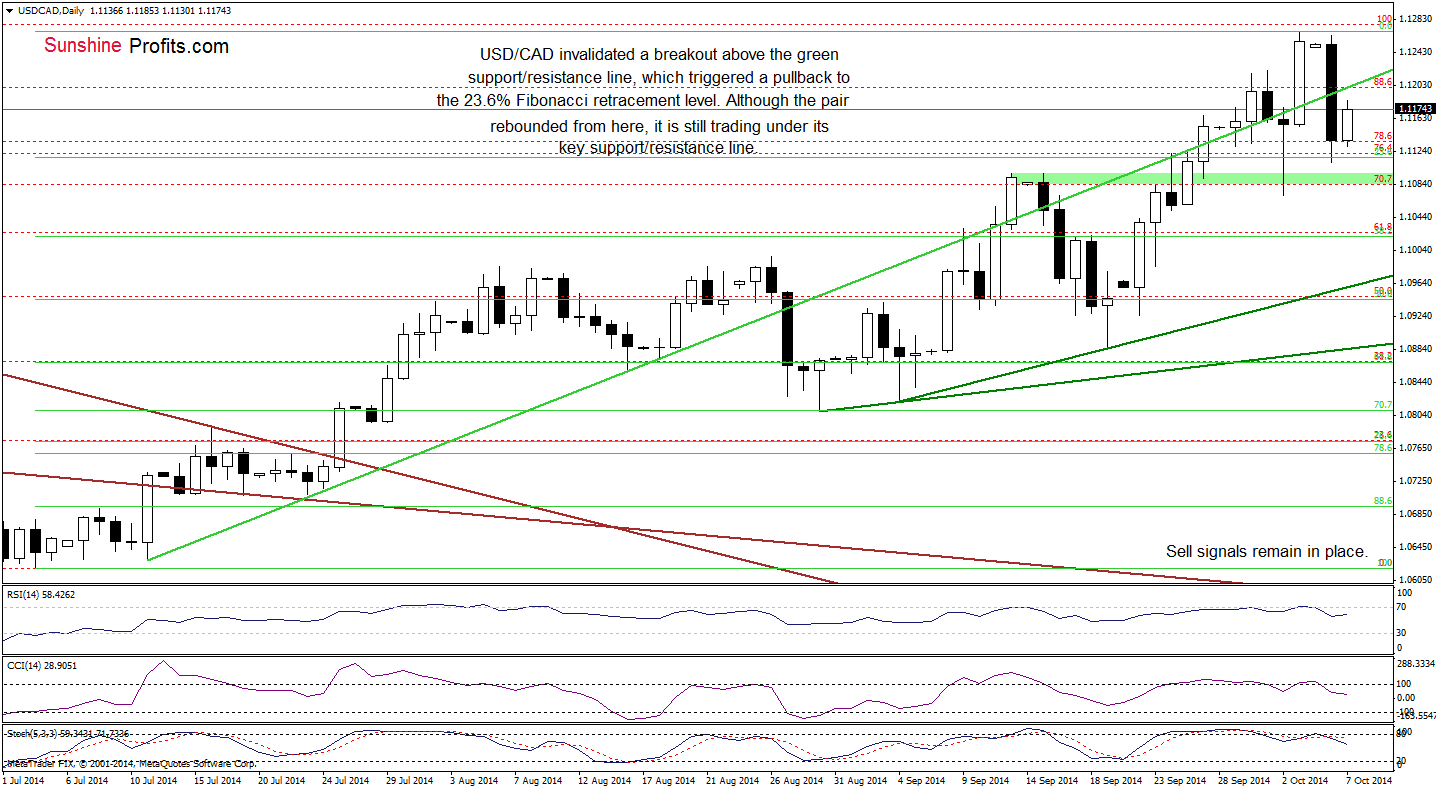
From this sperspective, we see that the most important event of yesterday’s session was an invalidation of the breakout above the key support/resistance green line. Taking this negative sign into account and combining it with the medium-term picture and the current position of the daily indicators (they all generated sell signals), we think that the next sizable move will be to the downside. In our opinion, the correcion will accelerate, if the pair drops under the support area created by the mid-Sep highs and the Oct 2 low. If this is the case, we’ll see further corrction and the initial downsid target would be around 1.1021, where the 38.2% Fibonacci retracement (based on the Jul-Oct rally) is.
Very short-term outlook: bearish
Short-term outlook: bearish
MT outlook: mixed with bearish bias
LT outlook: bearish
Trading position (short-term): In our opinion no positions are justified from the risk/reward perspective at the moment. We will keep you informed should anything change, or should we see a confirmation/invalidation of the above.
Thank you.
Nadia Simmons
Forex & Oil Trading Strategist
Przemyslaw Radomski, CFA
Founder, Editor-in-chief
Gold & Silver Trading Alerts
Forex Trading Alerts
Oil Investment Updates
Oil Trading Alerts

