
Yesterday’s better-than-expected U.S. new home sales data brought further support to the greenback earlier today, which resulted in a fresh annual high in the USD Index. Additionally, later in the day, the U.S. Department of Labor reported that the initial jobless claims in the week ending September 19 increased by 12,000, while analysts expected a 19,000 rise. In response, the U.S. dollar moved higher against other currencies once again. Taking this fact into account, we decided not to wait until Friday, but today take a closer look at the major currency pairs and find out what impact did this U.S. dollar’s rally have on their outlooks.
In our opinion the following forex trading positions are justified - summary:
- EUR/USD: long (stop-loss order: 1.2568; initial price target: 1.3188)
- GBP/USD: none
- USD/JPY: short (stop-loss order: 110.23; initial price target: 105.20)
- USD/CAD: none
- USD/CHF: none
- AUD/USD: none
EUR/USD
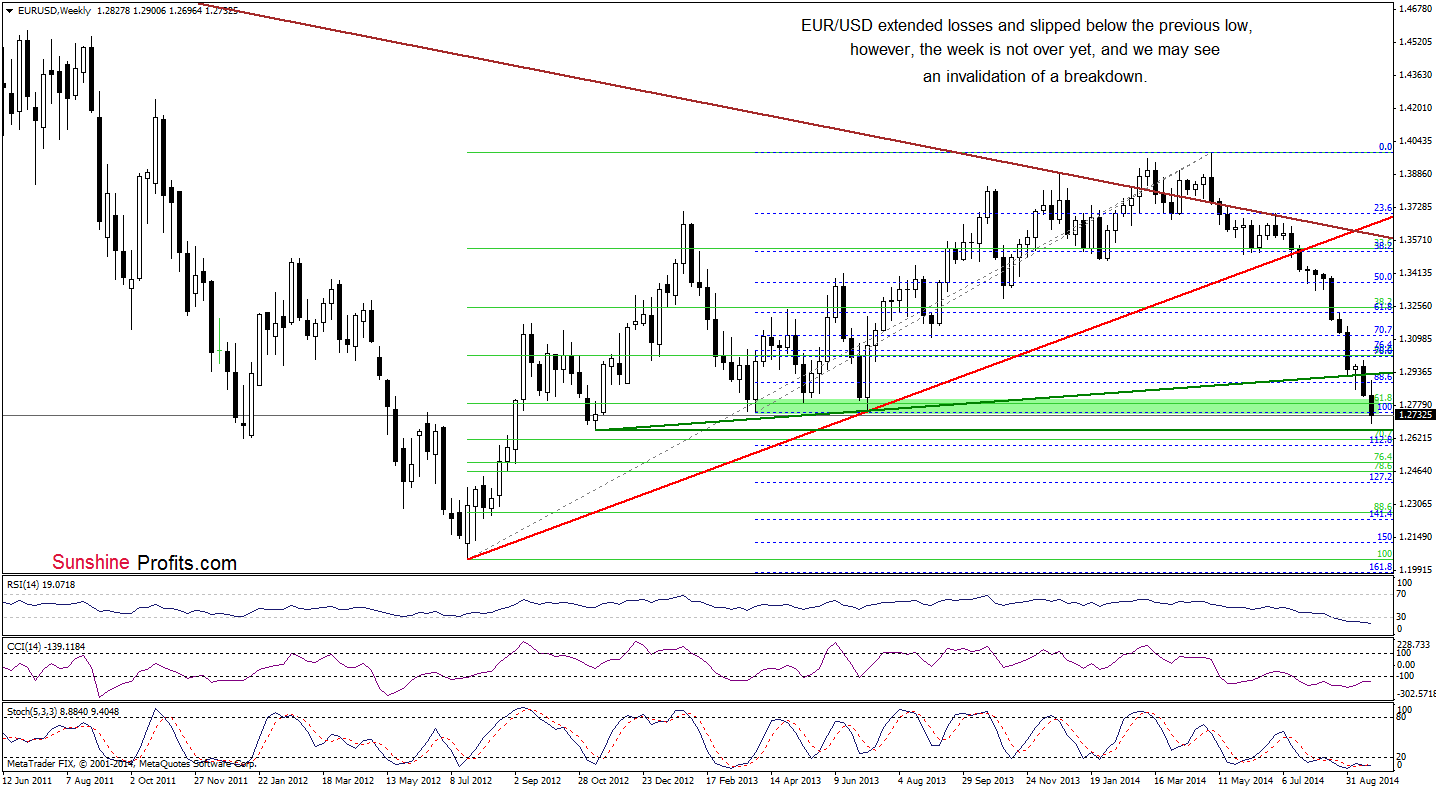
On Tuesday, we wrote the following:
(…) although EUR/USD moved higher, the pair is still trading well below the previously-broken lower border of the rising trend channel. Therefore, we think that as long as there is no invalidation of a breakdown below this key line, another attempt to move lower can’t be ruled out. If this is the case, the initial downside target would be the recent low of 1.2816. If it’s broken, we could see a drop to the green support zone (around 1.2745-1.2755) created by the Apr and Jul 2013 lows and the 61.8% Fibonacci retracement.
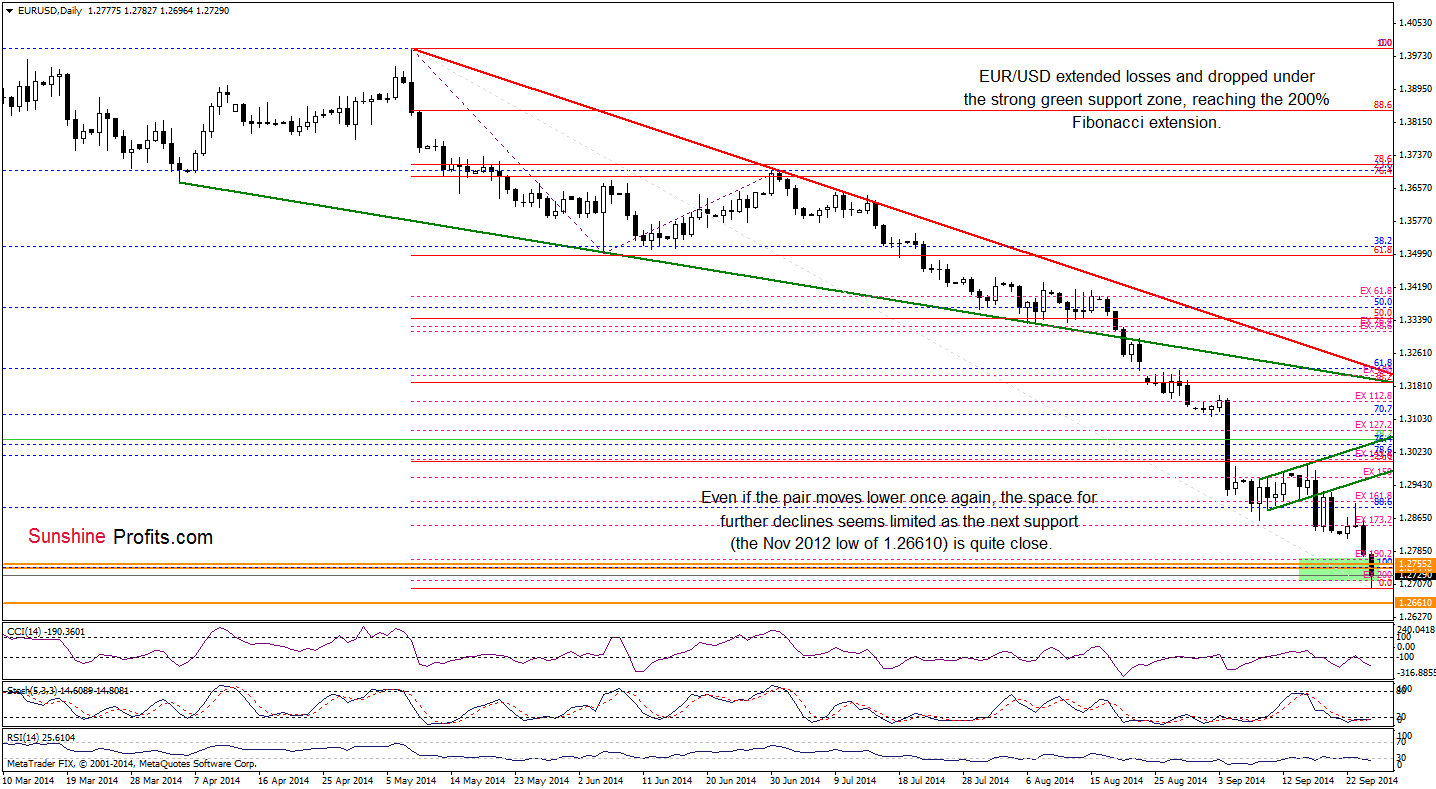
As you see, the situation developed in line with the above bearish scenario and EUR/USD not only reached our downside target, but currency bears managed to push the pair even lower earlier today. With this downswing, the exchange rate broke below the green support zone, slipping to the 200% Fibonacci extension. Although this is a strong bearish signal, the breakdown is not confirmed at the moment and the space for further declines seems limited as the next support level (created by the Nov 2012 low of 1.2661) is quite close. Additionally, all indicators are oversold and there are positive divergences between them and the exchange rate. Taking all the above into account, it seems to us that a bigger upward move is just around the corner.
Very short-term outlook: bullish
Short-term outlook:mixed with bullish bias
MT outlook: mixed
LT outlook: bearish
Trading position (short-term; our opinion): Long positions with a stop-loss order at 1.2568 are justified from the risk/reward perspective at the moment. We will keep you informed should anything change, or should we see a confirmation/invalidation of the above.
GBP/USD
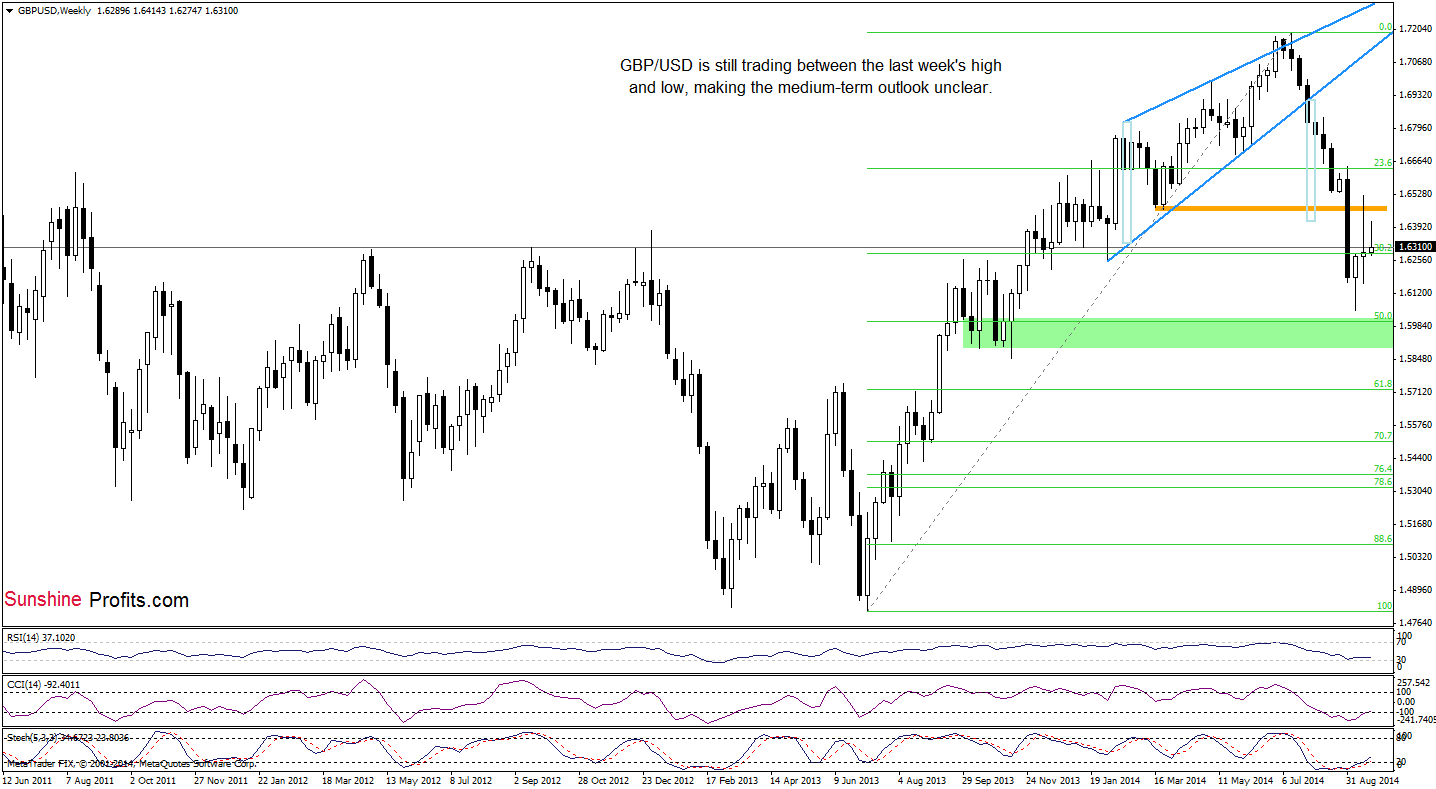
The medium-term picture hasn’t changed much as GBP/USD is trading between the last week’s high and low. Let’s examine the daily chart and look for some clues about future moves.
Quoting our last commentary on this currency pair:
(…) the exchange rate has been trading in a consolidation (marked with blue) between the last week’s low and the key resistance level created by the 38.2% Fibonacci retracement. What’s next? The current position of the CCI and Stochastic Oscillator suggests that GBP/USD will likely test the strength of the lower border of the formation. If it’s broken, we’ll see a drop to 1.6161 (the Sep 16 low) or even a test of the Sep low of 1.6051.
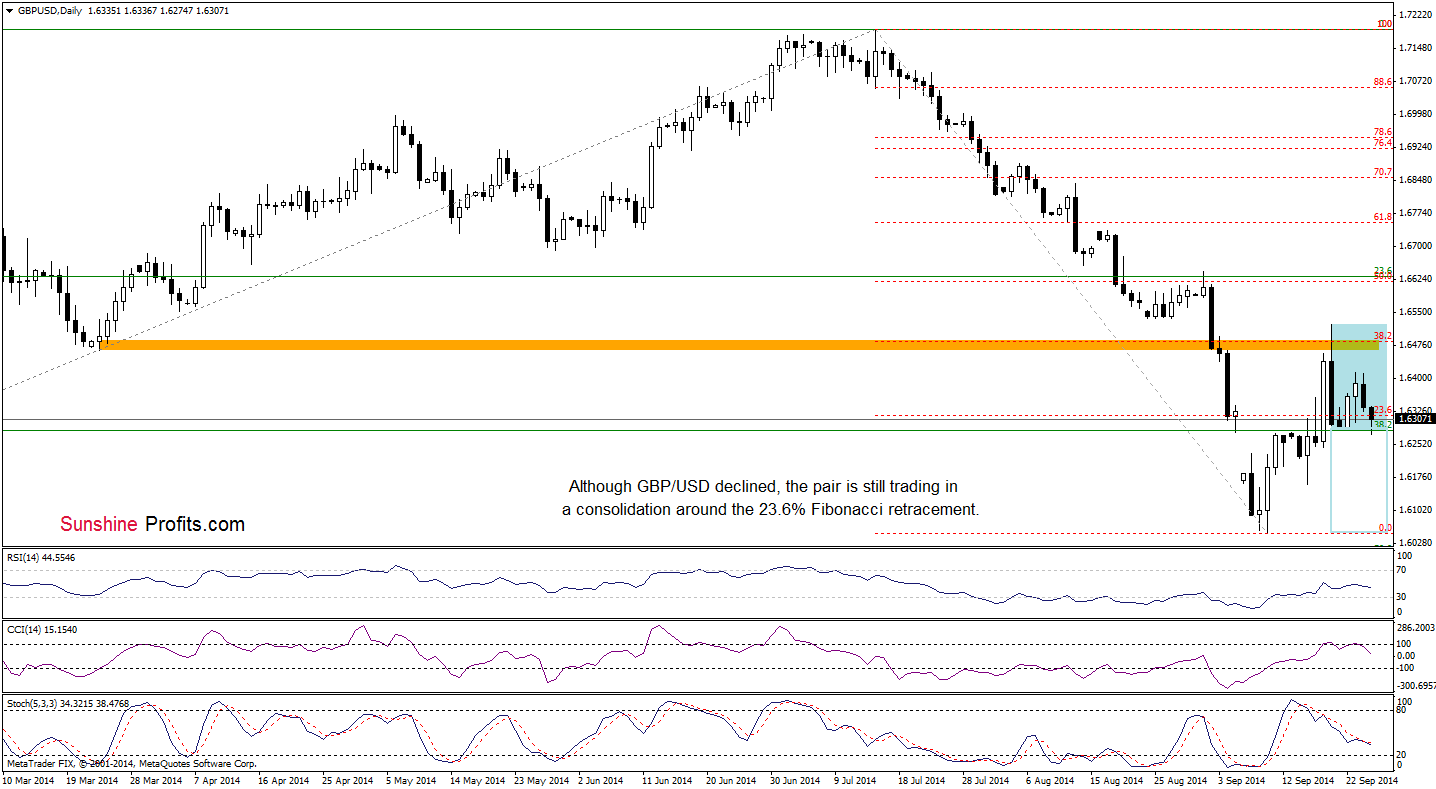
Looking at the above chart, we see that currency bears realized partly the above-mentioned scenario (as we expected) and the pair reached the lower line of the consolidation. Taking this fact into account and combining with the current position of the indicators, we think that the above-mentioned scenario is still up-to-date and the next move will be to the downside.
Very short-term outlook: mixed with bearish bias
Short-term outlook: mixed
MT outlook: mixed
LT outlook: mixed
Trading position (short-term): In our opinion, no positions are justified from the risk/reward perspective. We will keep you informed should anything change, or should we see a confirmation/invalidation of the above.
USD/JPY
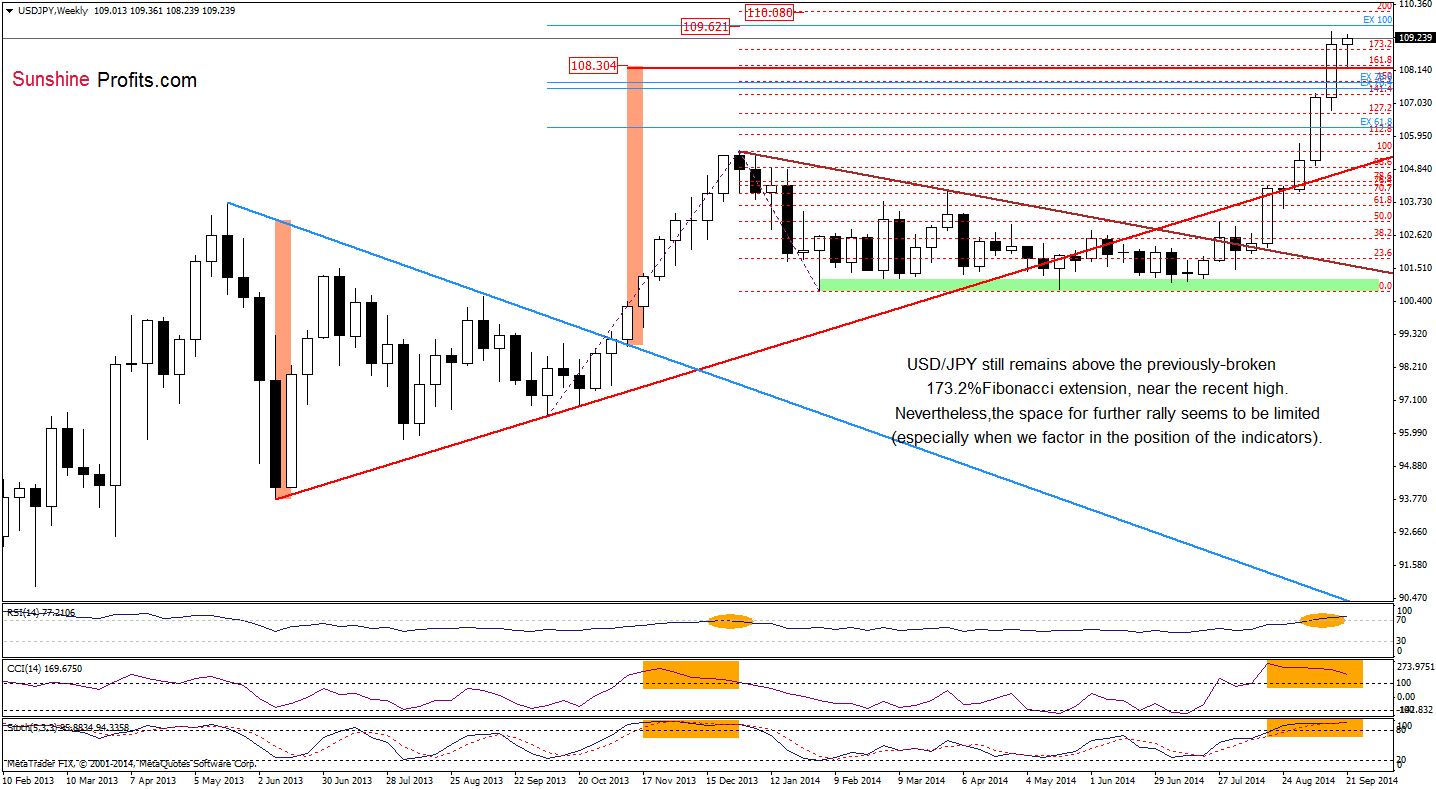
The medium-term picture hasn’t changed much as USD/JPY is still trading slightly below the last week’s high and quite close to the 100% Fibonacci price projection (based on the Oct and Feb lows and Dec high) at 109.62, which serves as the next strong resistance. At this point, it’s worth noting that although the USD Index hit a fresh multi-month high earlier today, USD/JPY didn’t climb above the last week’s high, which is a negative signal.
Having say that, let’s focus on the very short-term changes.
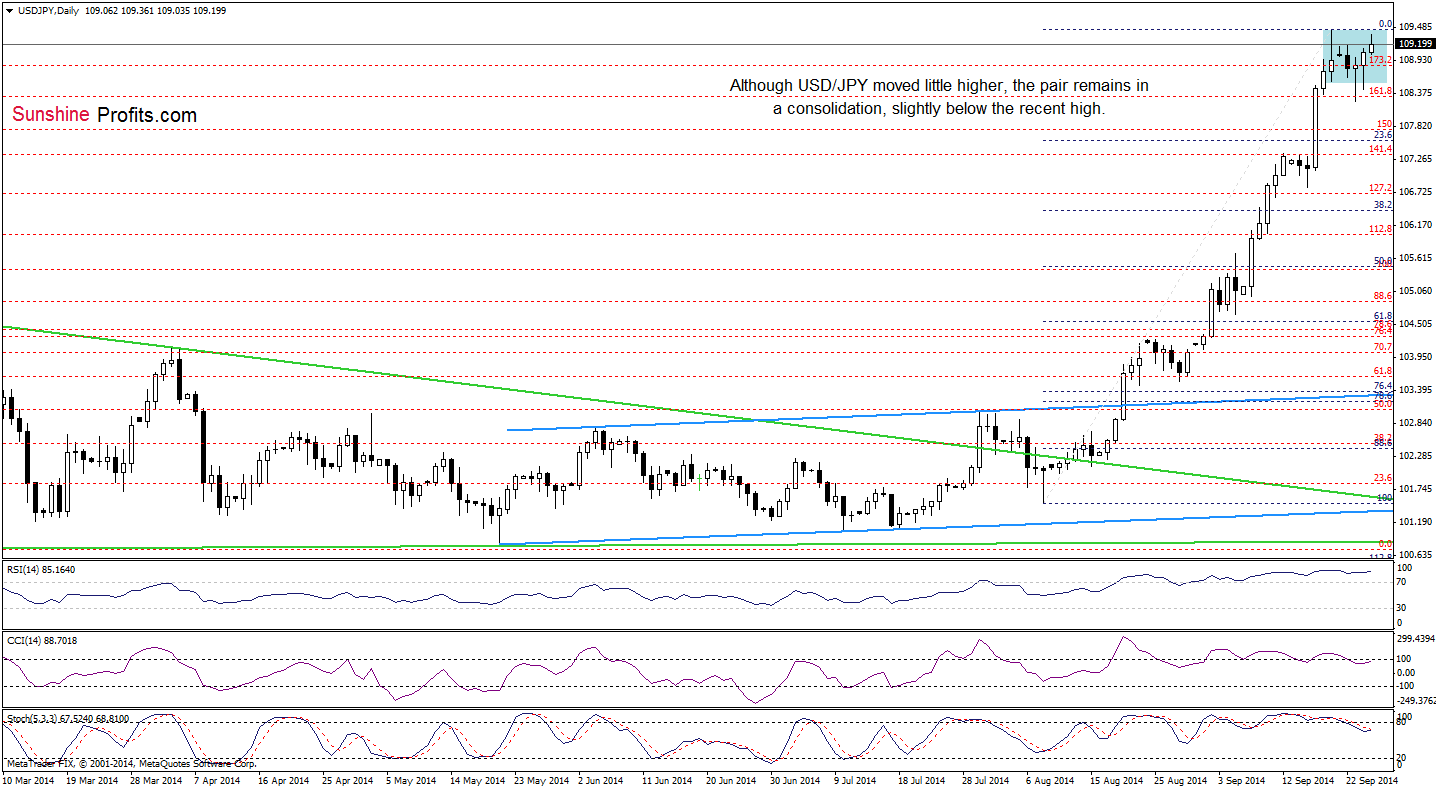
On the daily chart, we see that although USD/JPY moved higher in the recent days, the overall situation hasn’t changed much as the exchange rate is trading in a consolidation slightly below the recent high. What’s next? Taking into account the current position of the indicators (there are negative divergences between the CCI, Stochastic Oscillator and the exchange rate and they generated sell signals), it seems to us that the next move will be to the downside – especially if the pair breaks below 108.23, where the Tuesday’s low is. If this is the case, initial downside target would be around 107.55, where the 23.6% Fibonacci retracement based on the Aug-Sep rally is.
Nevertheless, we should keep in mind that if we don’t see a bigger or at least similar correction to the one that we saw at the beginning of August, another move higher can’t be ruled out. In this case, the next upside target would be around 109.62, where the 100% Fibonacci price projection (based on the Oct and Feb lows and Dec high) is.
Very short-term outlook: bearish
Short-term outlook: mixed with bearish bias
MT outlook: mixed
LT outlook: bearish
Trading position (short-term; our opinion): Short positions with a stop-loss order at 110.23 are justified from the risk/reward perspective at the moment. We will keep you informed should anything change, or should we see a confirmation/invalidation of the above.
USD/CAD
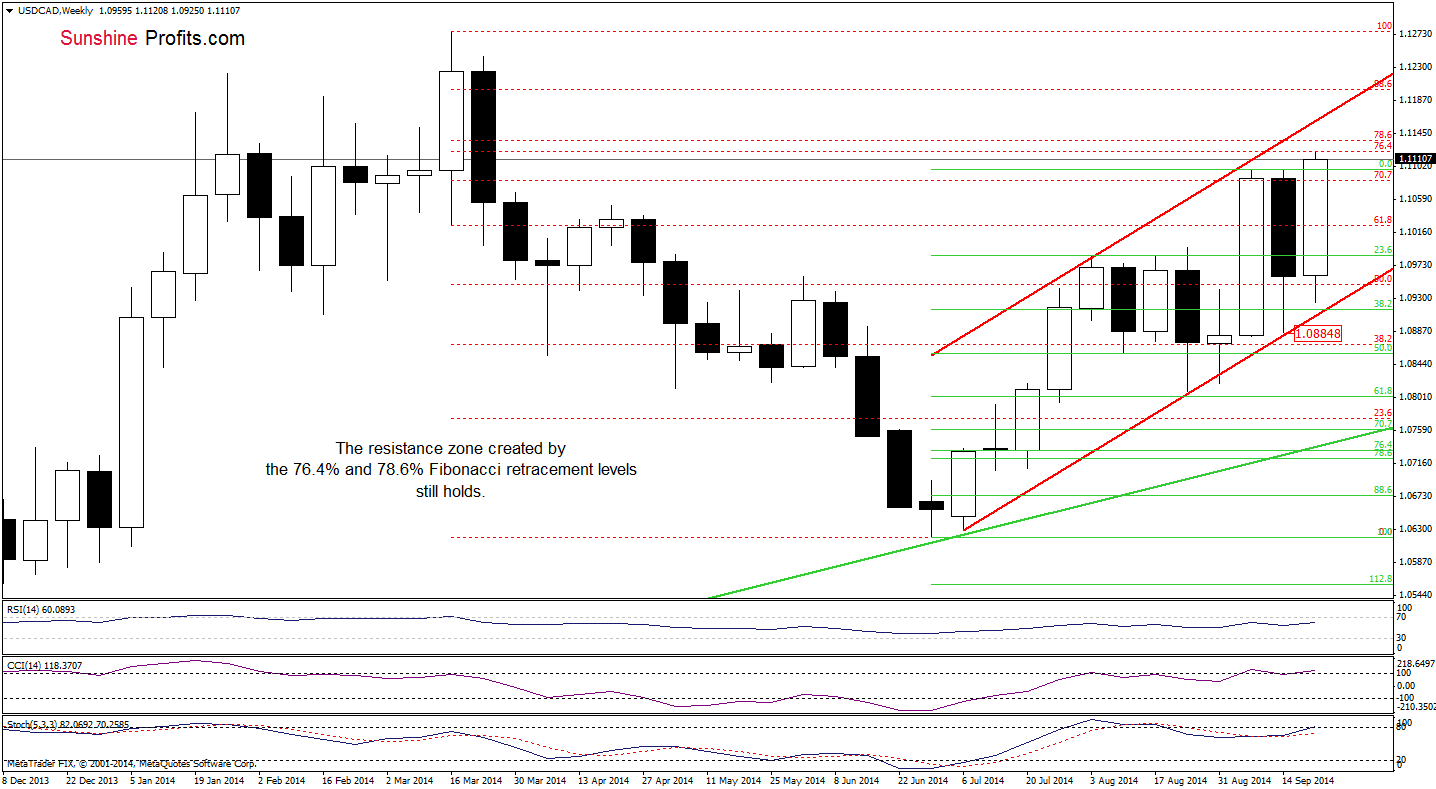
Looking at the above chart, we see that the medium-term situation hasn’t changed much as USD/CAD still remains below the strong resistance zone created by the 76.4% and 78.6% Fibonacci retrecement levels. Therefore, what we wrote yesterday is still valid:
(…) USD/CAD also approached a strong resistance zone created by the 76.4% and 78.6% Fibonacci retrecement levels, which will likely pause (or even stop) further improvement. If this is the case, and the pair invalidates a breakout, it will be a strong bearish signal, which will likely trigger another downward move to the lower border of the rising trend channel (curently around 1.0907).
Once we know the above, let’s take a closer look at the daily chart.
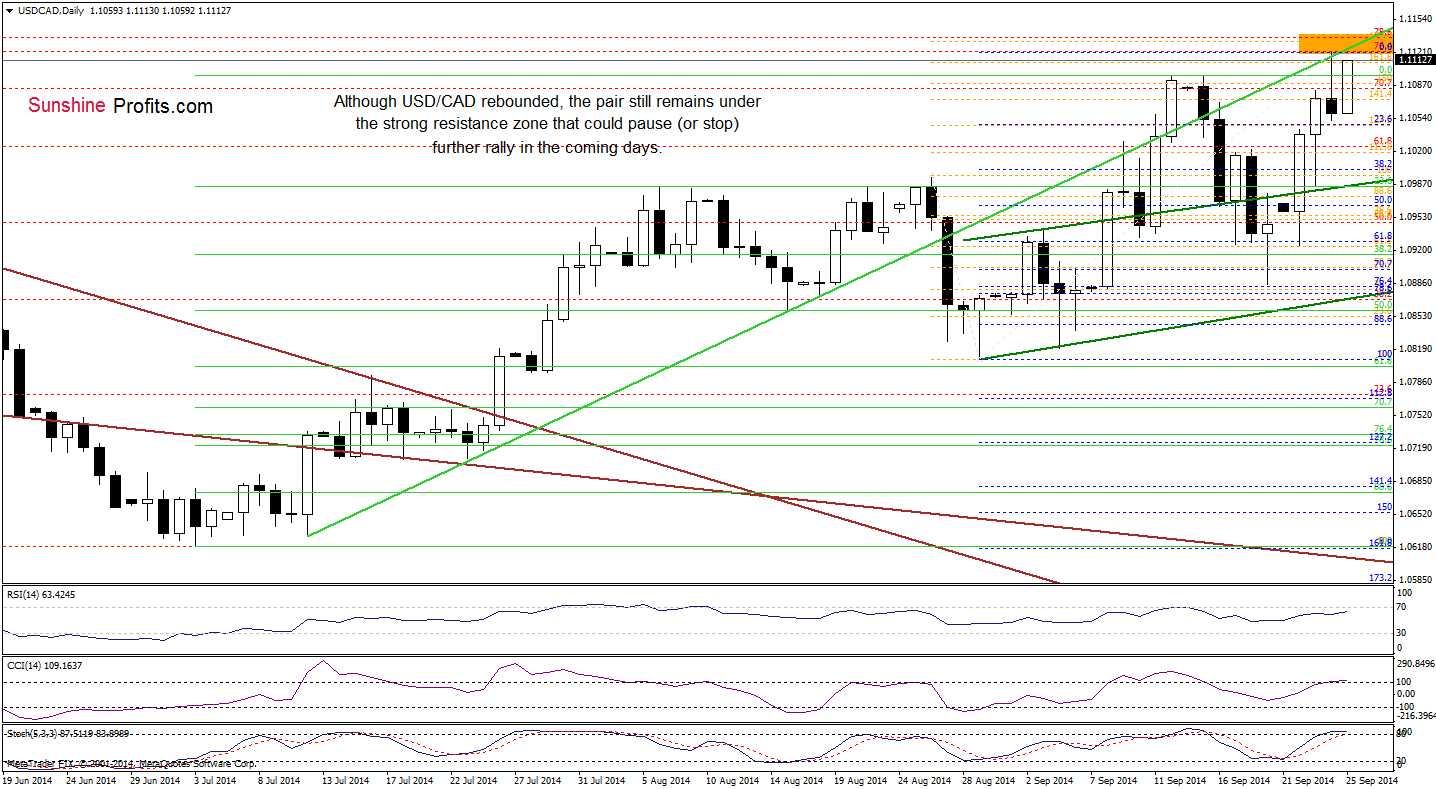
From this perspective, we see that although USD/CAD moved higher, the pair still remains under the strong resistance zone (created by the 76.4% and 78.6% Fibonacci retracement levels, the 161.8% Fibonacci extension and the key resistance green line). Taking this fact into account, and combining it with the position of the indicators, we think that the next move will be to the downside. In this case, the initial downside target will be around 1.0985, where the 38.2% Fibonacci retracement based on the Aug-Sep rally and the upper line of the rising trend channel are.
Very short-term outlook: bearish
Short-term outlook: bearish
MT outlook: mixed with bearish bias
LT outlook: bearish
Trading position (short-term): In our opinion no positions are justified from the risk/reward perspective at the moment. We will keep you informed should anything change, or should we see a confirmation/invalidation of the above.
USD/CHF
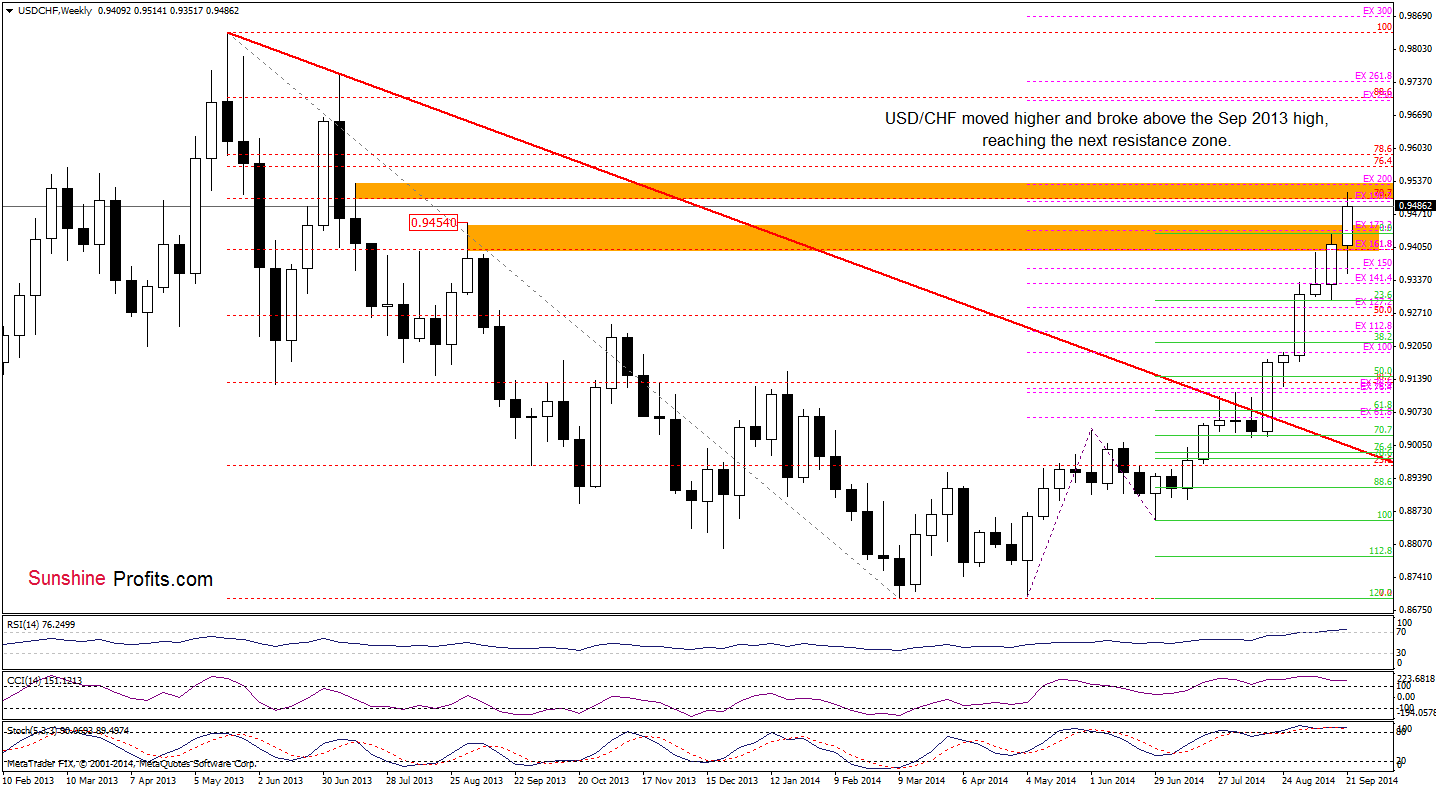
Quoting our yesterday’s Forex Trading Alert:
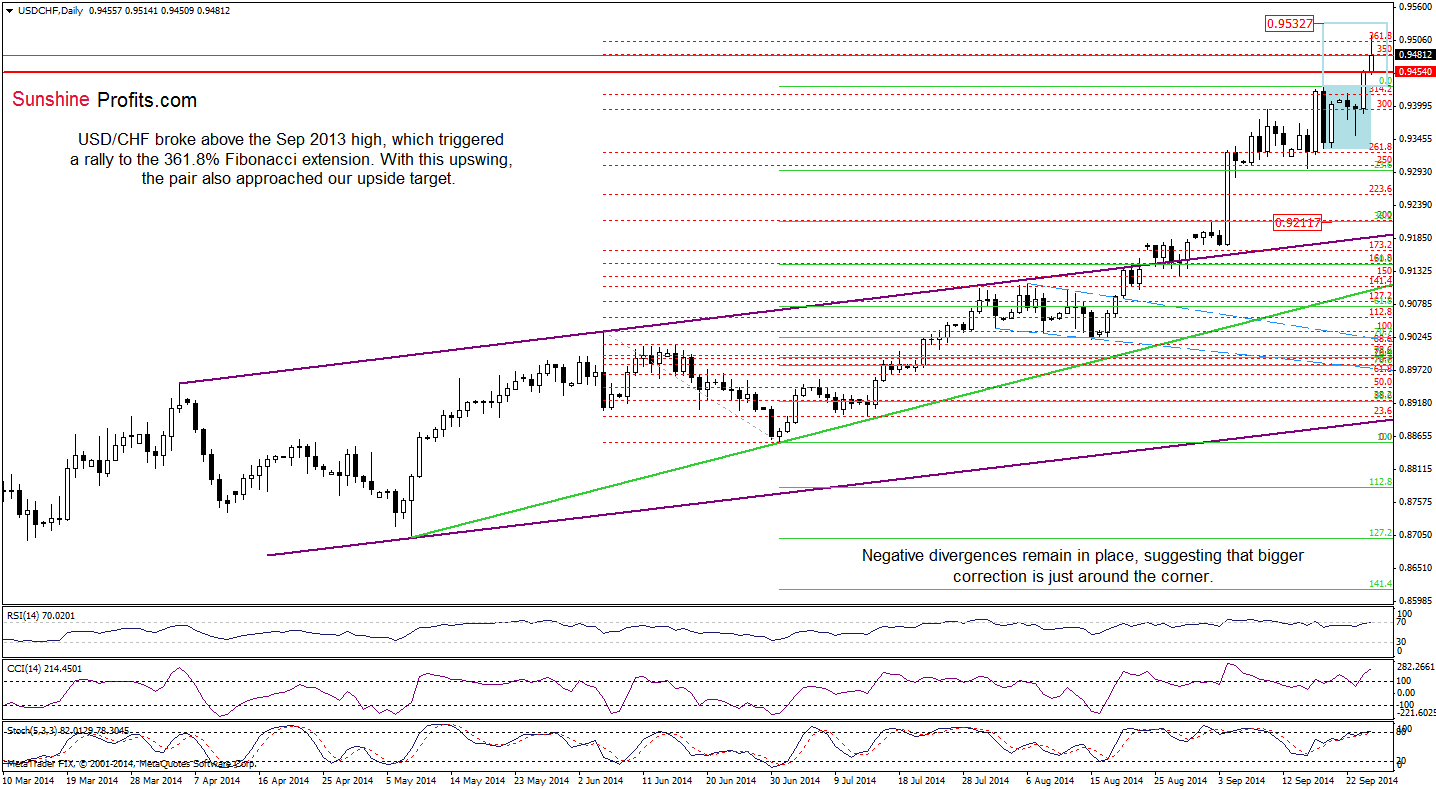
(...) The first thing that catches the eye on these charts is a breakout above the recent high and the upper line of the consolidation. This bullish signal suggests further improvement and an increase to auround 0.9532, where the size of the upswing will correspond to the height of the formation (in this area is also the next resistance zone marked on the weekly chart). (...) the pair reached a resistance level created by the Sep 2013 high (...) If USD/CHF breaks above it, it will be a strong positive signal, which will support further rally.
Looking at the above charts, we see that currency bulls managed to push the pair above the Sep 2013 high, which resulted in further improvement earlier today. With this upswing, the exchange rate reached the 361.8% Fibonacci extension and approached our upside target. Despite this improvement, USD/CHF reversed and invalidated a breakout above this level, which is a negative signal that could trigger a pullback from here – especially when we factor in the orange resistance zone marked on the weekly chart. Please note that negative divergences between all indicators and the exchange rate remain in place, prescribing caution before making investment decisions.
Very short-term outlook: mixed with bearish bias
Short-term outlook: mixed with bearish bias
MT outlook: mixed
LT outlook: bearish
Trading position (short-term): In our opinion no positions are justified from the risk/reward perspective. We will keep you informed should anything change, or should we see a confirmation/invalidation of the above.
AUD/USD
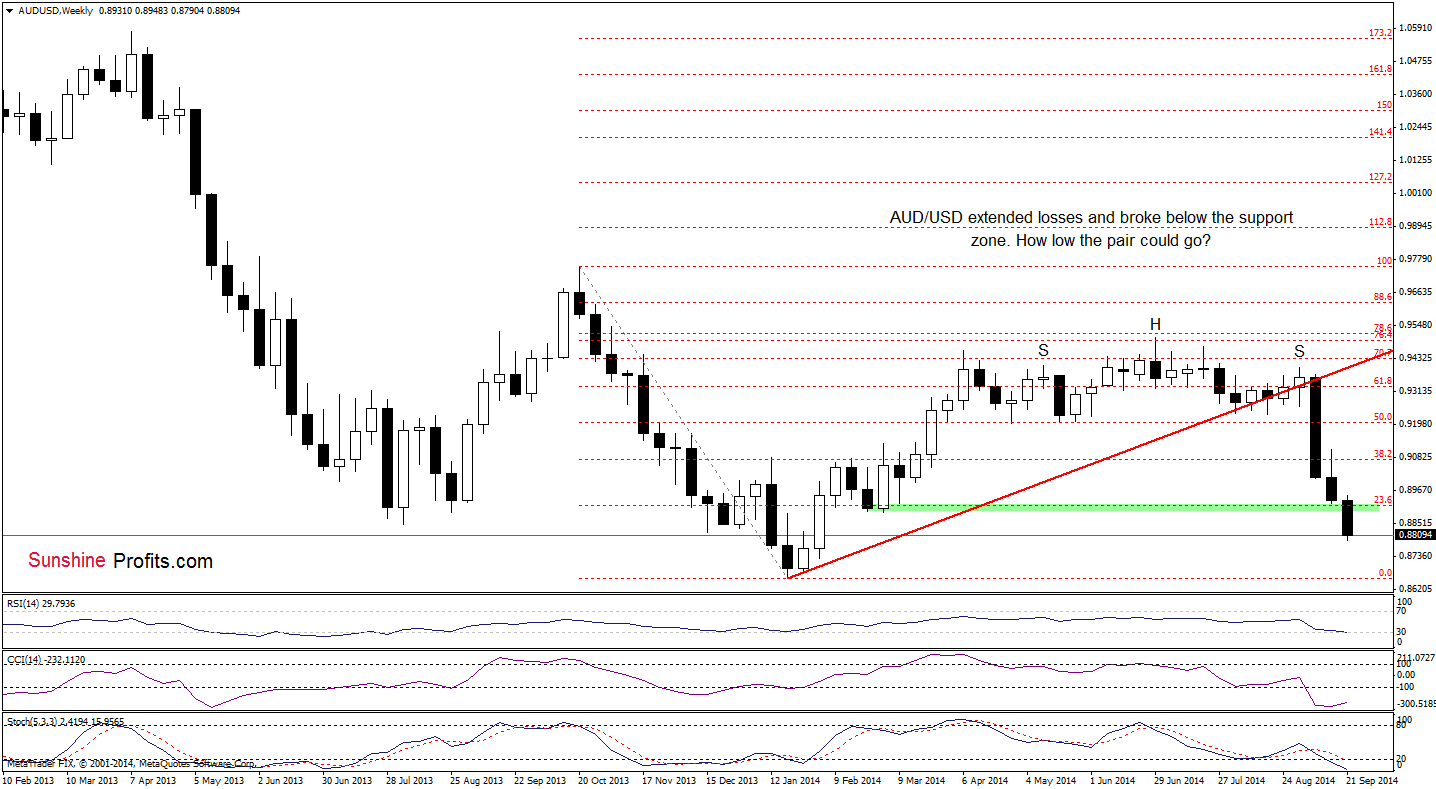
The situation in the medium term has deteriorated as AUD/USD broke below the green support zone based on the Feb and March lows. Thanks to this bearish signal, the exchange rate hit a fresh multi-month low. How low could the pair drop? Let’s take a closer look at the daily chart and look for the answer to this question.
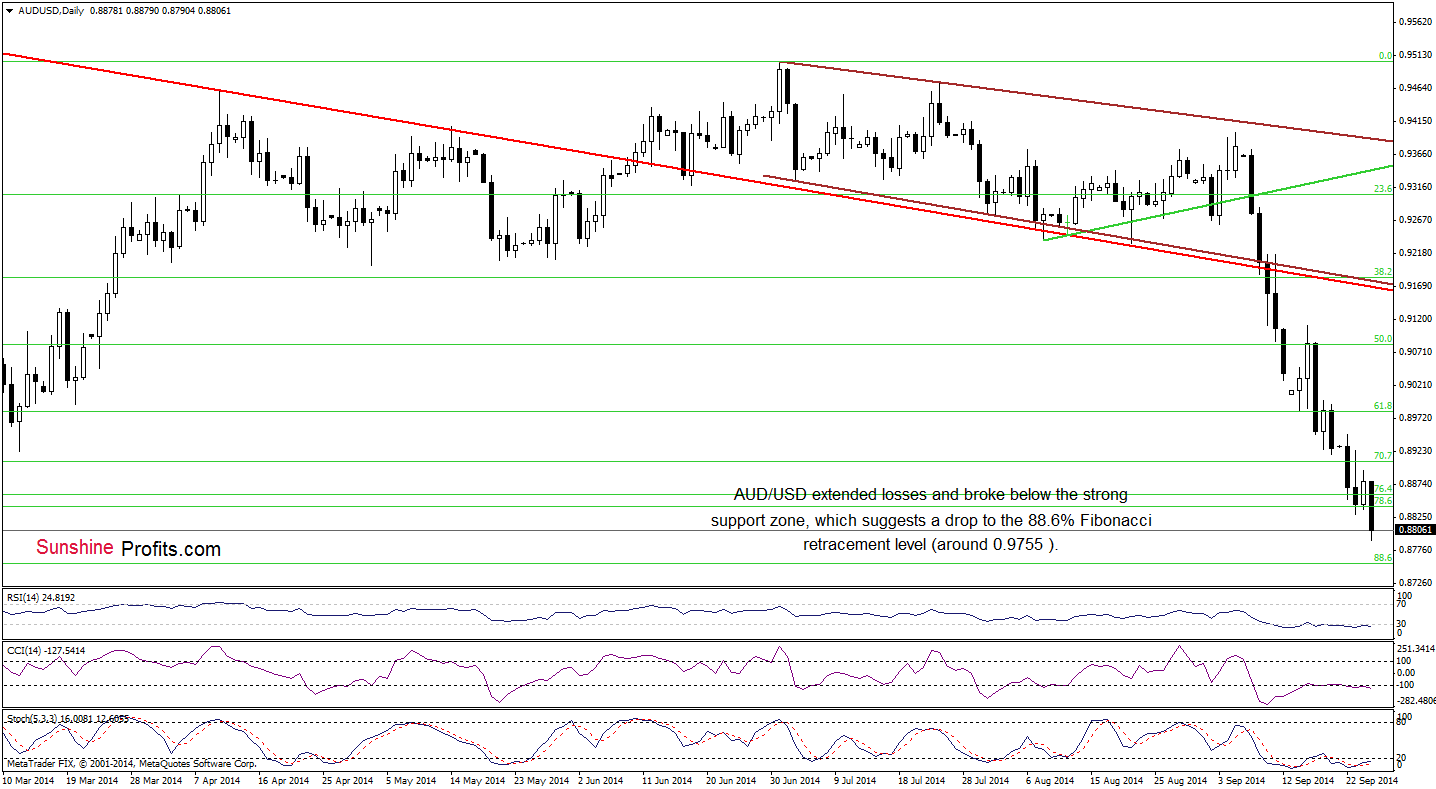
From this perspective, we see that the situation has deteriorated as AUD/USD extended losses and dropped below the support zone created by the 76.4% and 78.6% Fibonacci retracement levels. Taking this fact into account, we believe that our last commentary on this currency pair is up-to-date:
(…) if currency bears show their claws and manage to push the pair lower, it would be a strong negative signal, which could trigger a drop even to around 0.8756, where the next Fibonacci retracement is. At this point, it’s worth noting that slightly below this level (at 0.8729) is the Feb 4 low, which together create a next support area.
Very short-term outlook: bearish
Short-term outlook: mixed with bearish bias
MT outlook: mixed
LT outlook: bearish
Trading position (short-term): In our opinion no positions are justified from the risk/reward perspective. We will keep you informed should anything change, or should we see a confirmation/invalidation of the above.
Thank you.
Nadia Simmons
Forex & Oil Trading Strategist
Przemyslaw Radomski, CFA
Founder, Editor-in-chief
Gold & Silver Trading Alerts
Forex Trading Alerts
Oil Investment Updates
Oil Trading Alerts

