
On Monday, the Federal Reserve Bank of San Francisco published a report, which indicated that central bank is growing closer to raise interest rates - earlier than markets expect. As a result, the US Dollar Index, which tracks the performance of the greenback against a basket of six other major currencies, climbed to a 14-month high. Taking this very important fact into account, we decided not to wait until Friday, but today take a closer look at the major currency pairs and find out what impact did this U.S. dollar’s rally have on their outlooks.
In our opinion the following forex trading positions are justified - summary:
- EUR/USD: long (stop-loss order: 1.2846; initial price target: 1.3200)
- GBP/USD: none
- USD/JPY: none
- USD/CAD: short (stop-loss order at 1.1068; initial price target: 1.0812)
- USD/CHF: none
- AUD/USD: none
EUR/USD
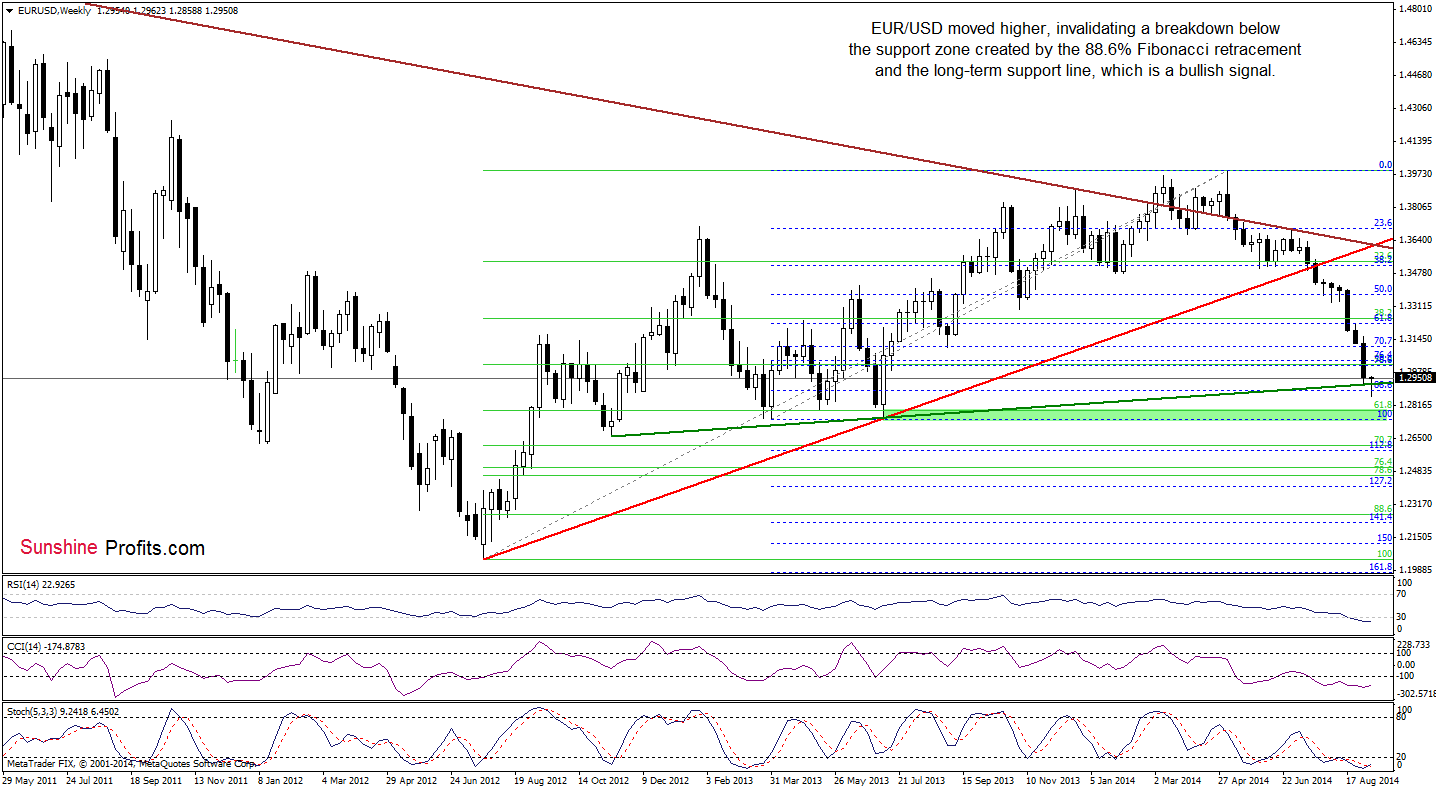
The medium-term picture hasn’t changed much and EUR/USD still remains above the support zone created by the 88.6% Fibonacci retracement and the long-term green support line based on the Nov 2012 and Jul 2013 lows. Thanks to these circumstances, an invalidation of the breakout that occurred yesterday is still in effect, which is a good news for currency bulls. Therefore, in our opinion, a corrective upswing from here in the coming week is more likely than not.
Can we find more clues about future moves on the daily chart? Let’s find out.
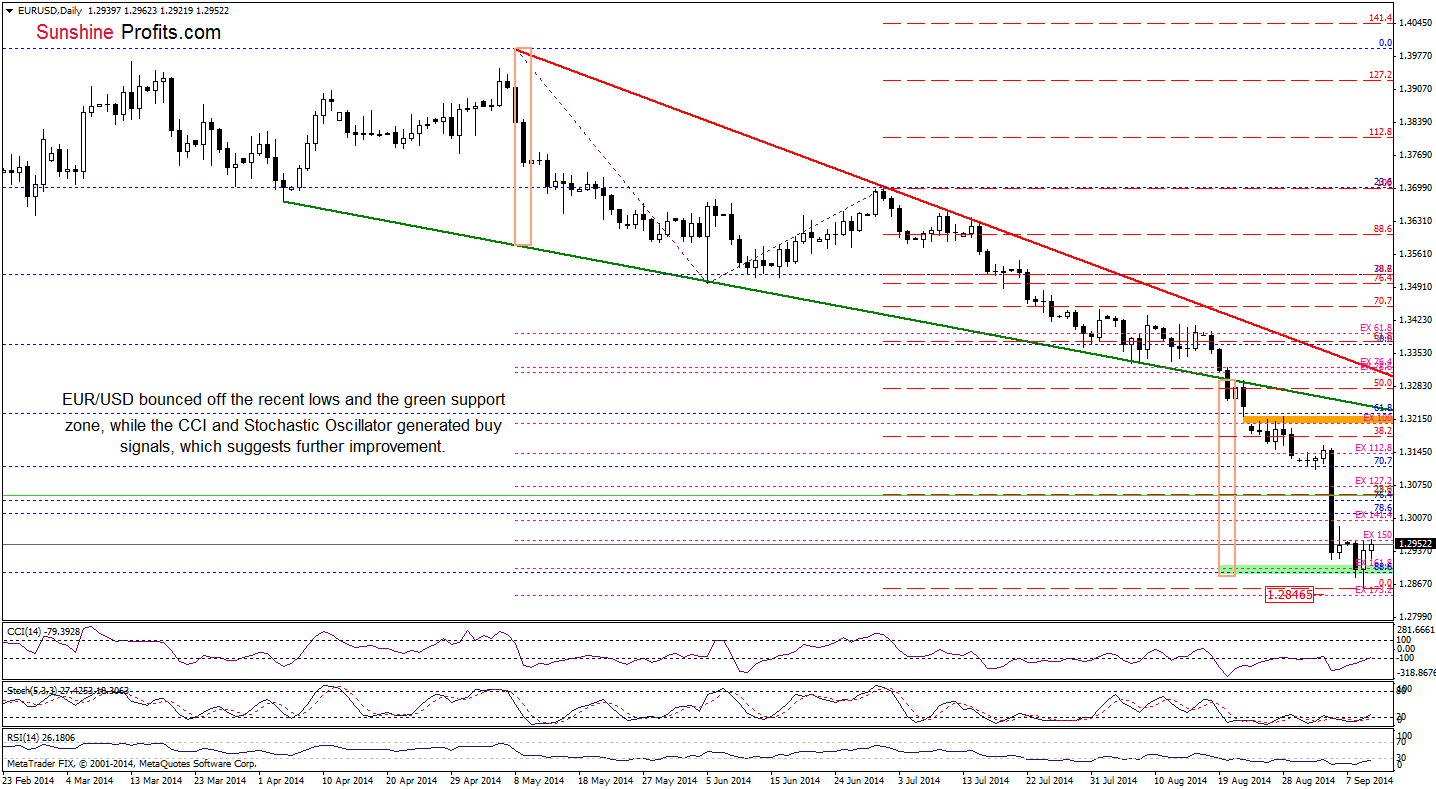
Looking at the above chart, we see that the pair extended gains and reached its highest level since Friday. Additionally, the CCI ad Stochastic Oscillator generated buy signals (while the RSI is very close to doing it), which means that our last commentary on this currency pair is up-to-date:
(…) the pair reversed and rebounded as the size of the downswing corresponded to the height of the declining wedge, which reduced the selling pressure. Taking this fact into account and combining it with an invalidation of the breakdown (seen on the weekly chart), it seems to us that the next move will be to the upside. If this is the case, we’ll see further improvement and an increase to the last week’s highs (around 1.3153).
Very short-term outlook: bullish
Short-term outlook: mixed with bullish bias
MT outlook: mixed
LT outlook: bearish
Trading position (short-term; our opinion): Long with a stop-loss order at 1.2846. We will keep you informed should anything change, or should we see a confirmation/invalidation of the above.
GBP/USD
On Monday, we wrote the following:
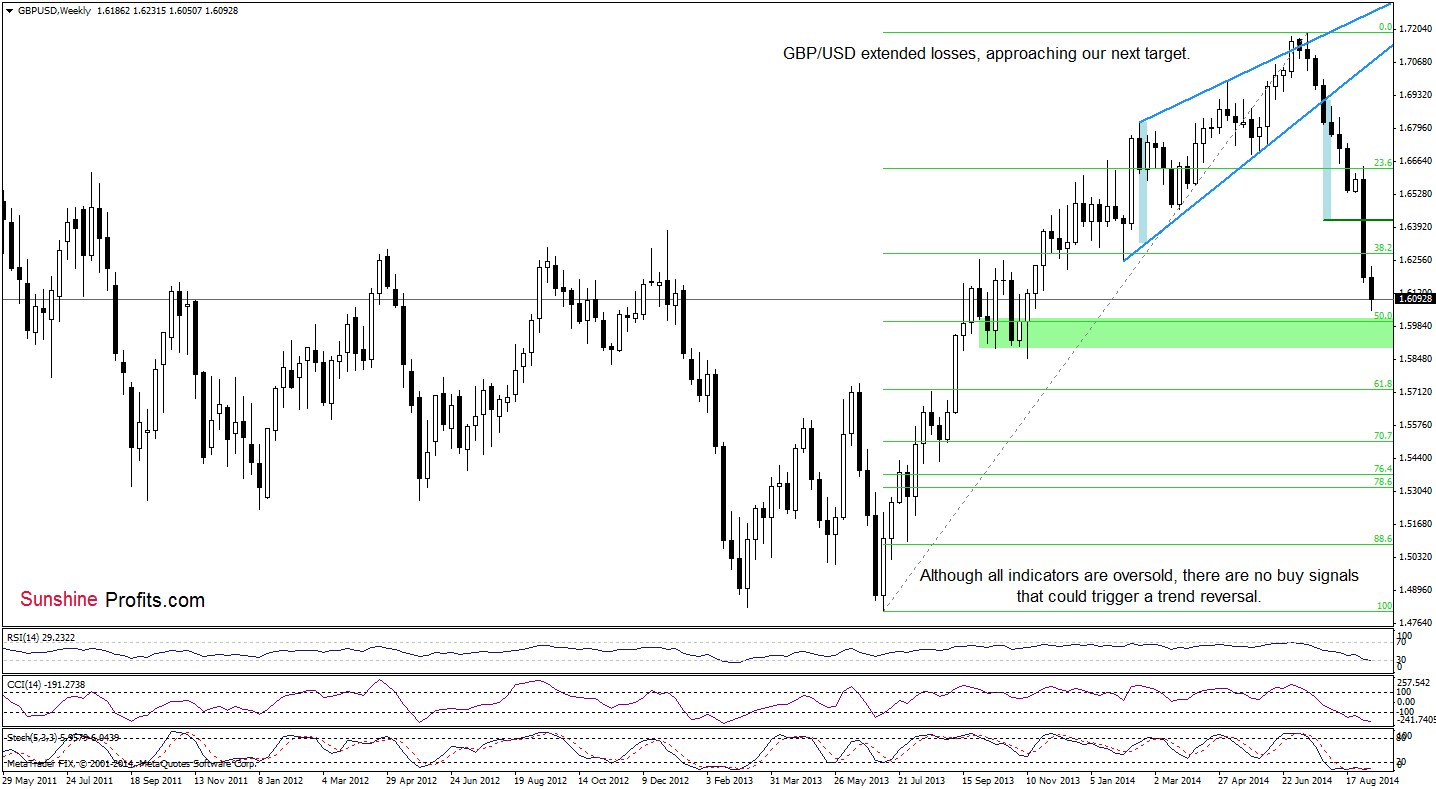
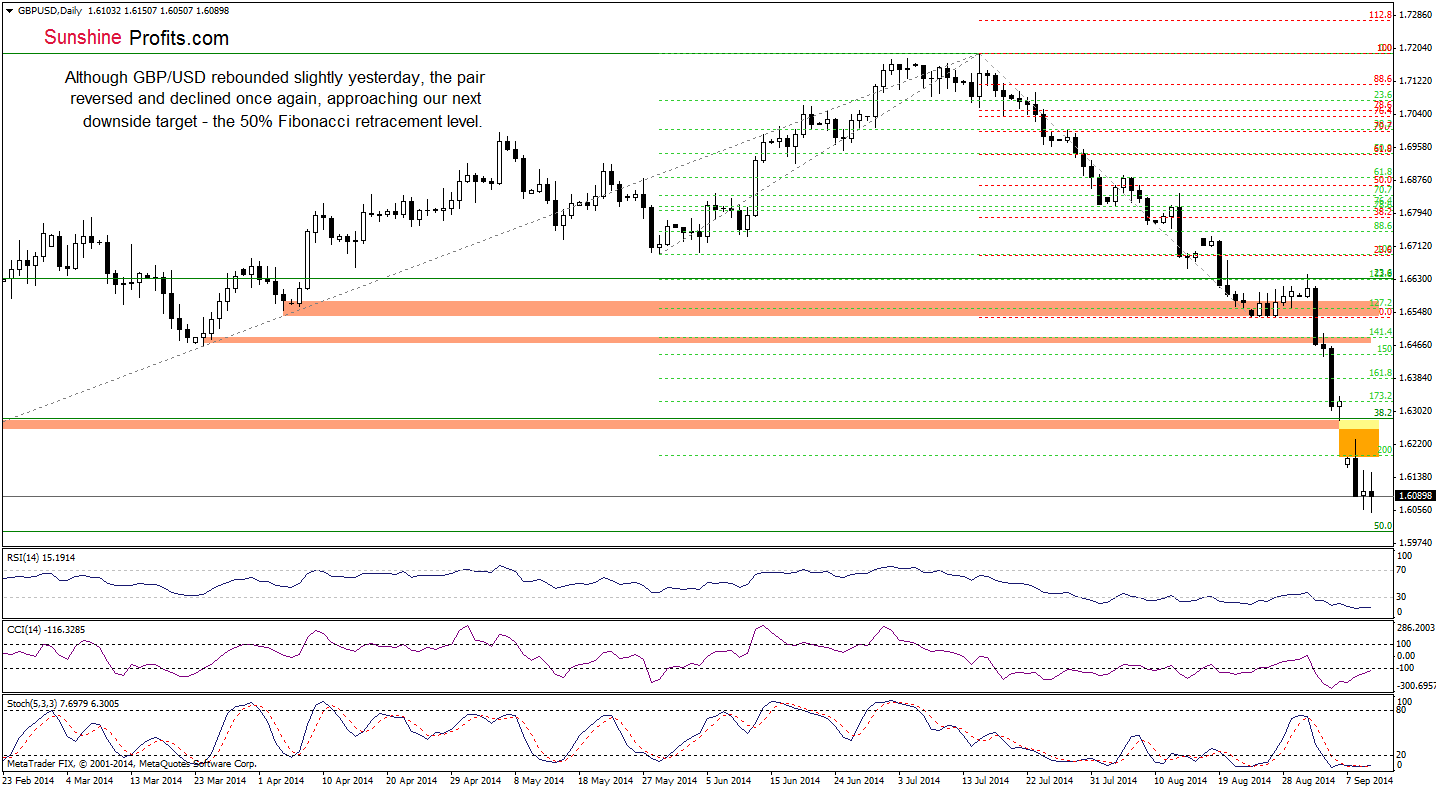
(…) the exchange rate started this week well below the Friday low, creating an orange gap, which serves as the nearest resistance at the moment. Please note that similar gap successfully stopped further improvement in the case of EUR/USD (at the end of the previous month). Taking this fact into account and combining with a breakdown below the green support zone, it seems to us that the next move will be to the downside and currency bears will try to reach the 50% Fibonacci retracement (around the psychological barrier of 1.6000).
Looking at the above charts, we see that although the exchange rate didn’t reach our downside target yet, currency bears managed to hit almost a ten-month low earlier today. What’s next? If the proximity to the 50% Fibonacci retracement encourages forex traders to push the buy button, GBP/USD will rebound and try to close the orange gap. However, taking into account the current position of the indicators, we still think that currency bears will try to reach the psychological barrier of 1.6000.
Very short-term outlook: bearish
Short-term outlook: mixed with bearish bias
MT outlook: bearish
LT outlook: mixed
Trading position (short-term): In our opinion, no positions are justified from the risk/reward perspective. We will keep you informed should anything change, or should we see a confirmation/invalidation of the above.
USD/JPY
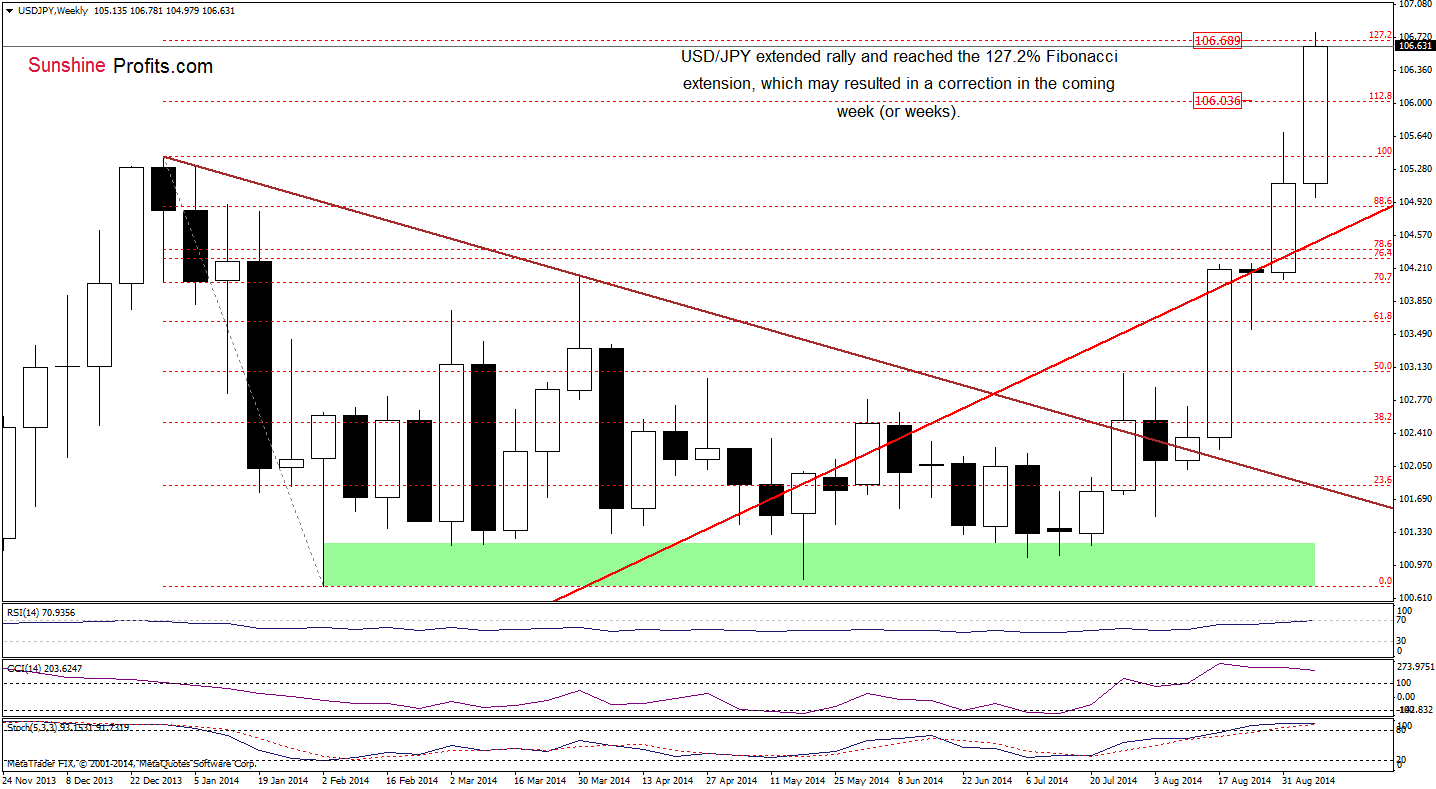
On the above chart, we see that USD/JPY extended rally in the recent days and reached a strong resistance level created by the 127.2% Fibonacci extension. Will we see further improvement in the coming days? Let’s examine the daily chart and look for more clues about future moves.
In our last commentary on this currency pair, we wrote the following:
(…) the pair is trading in a consolidation between Friday’s high and low. What does it mean for the exchange rate? In our opinion, as long as there is no breakout above the upper line of the formation (or breakdown below the lower border) another bigger move is not likely to be seen. Please note that the current position of the indicators favors currency bears, but we saw similar situation at the end of the previous month. Back then, such price action resulted only in a shallow correction, therefore, it seems to us that we may see another attempt to move higher in the coming days. If this is the case, the initial upside target will be around 106, where the 112.8% Fibonacci extension is. If this resistance is broken, the next target for currency bulls will be near 106.62, where the size of the upward move will correspond to the medium-term green triangle (we discussed it here) and the 127.2% Fibonacci extension is.
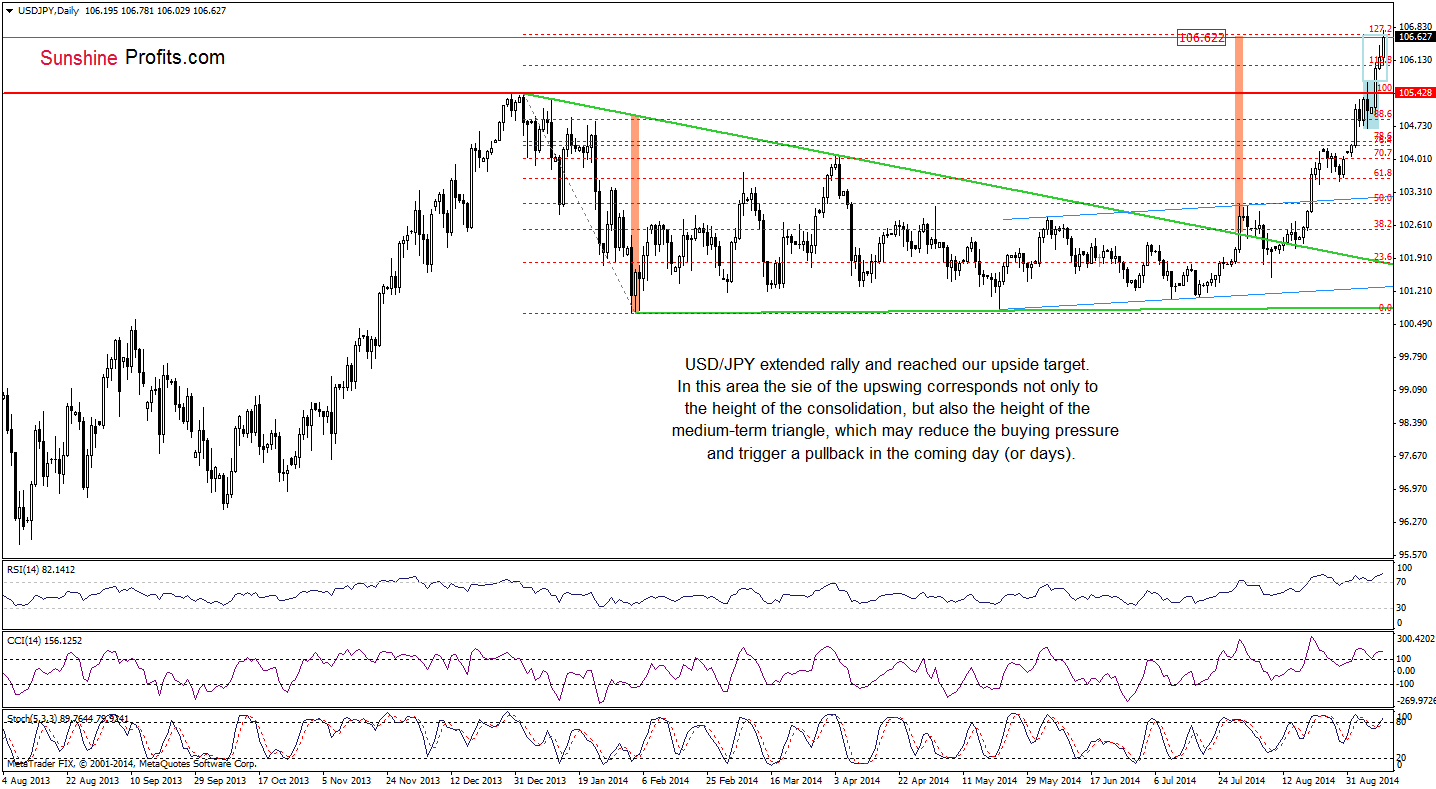
From today’s point of view, we see that the situation developed in line with the above-mentioned bullish scenario and the exchange rate reached our upside target. At this point, it’s also worth noting that the size of the recent upswing also corresponds to the height of the consolidation (marked with blue). Taking all the above into account, it seems to us that the buying pressure might be reduced in the coming day (or days), which would translate to a correction. If this is the case, the initial downside target will be around 105.53-105.69, where the 23.6% Fibonacci retracement (based on the Aug-Sep rally) and the previously-broken upper line of the consolidation are. Please note that this scenario is currently reinforced by the position of the indictors: the RSI climbed above the level of 80 (we didn’t see such high reading since the beginning of the previous year), while the CCI and Stochastic Oscillator are overbought (additionally, there are negative divergences between them and the exchange rate).
Very short-term outlook: mixed with bearish bias
Short-term outlook: mixed
MT outlook: mixed
LT outlook: bearish
Trading position (short-term): In our opinion no positions are justified from the risk/reward perspective at the moment. We will keep you informed should anything change, or should we see a confirmation/invalidation of the above.
USD/CAD
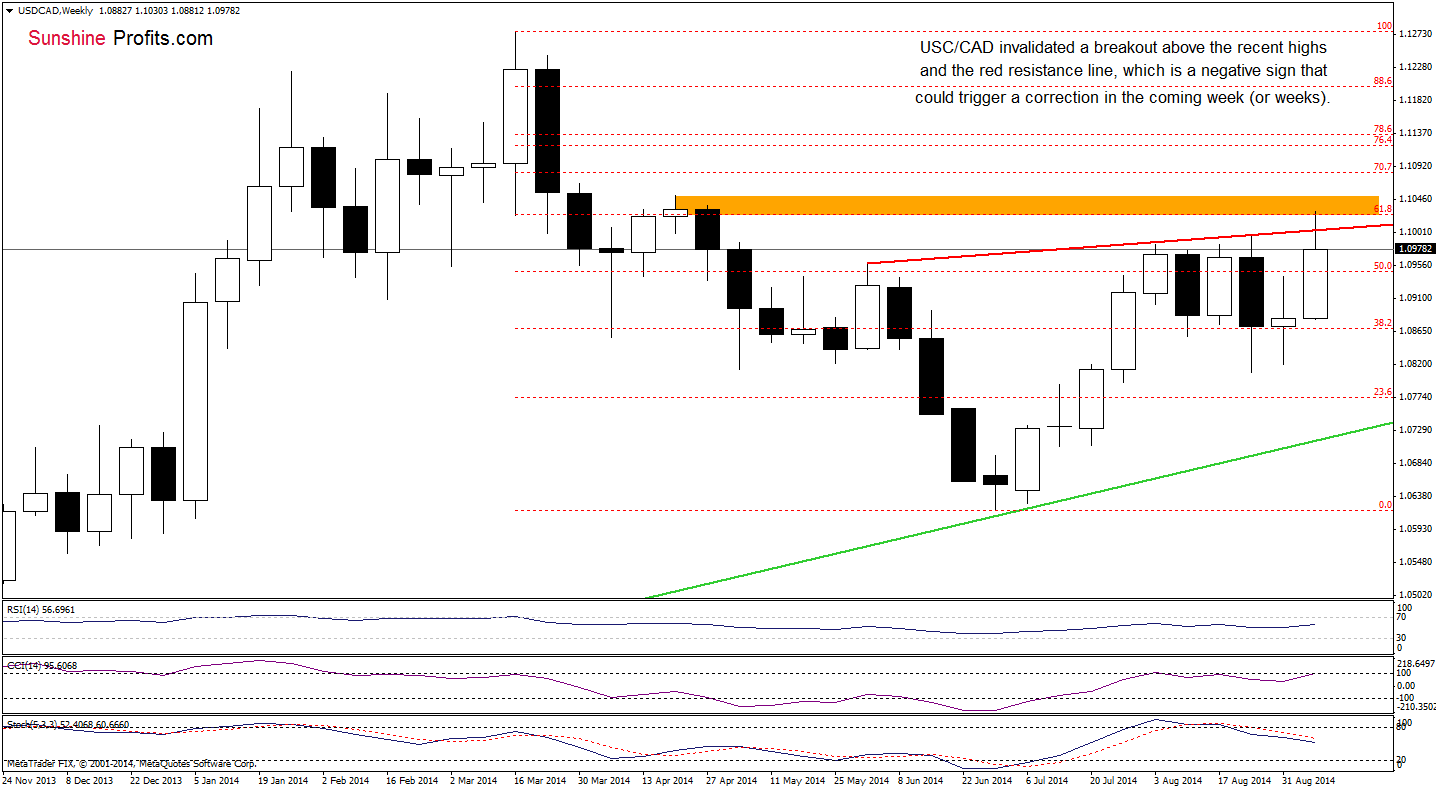
Quoting our yesterday’s Forex Trading Alert:
(..) USD/CAD moved higher and broke above the recent highs, invalidating a bearish engulfing candlesticks pattern (…) This positive signal encouraged currency bulls to act and resulted in a rally to the 61.8% Fibonacci retracement (based on the entire March-June decline). (…) this resistance level is reinforced by the April highs, which may pause or even stop further improvement and translate to lower values of USD/CAD in the coming week.
On the weekly chart, we see that the medium-term outlook has deteriorated as the exchange rate invalidated a breakout above the recent highs and the red resistance line. This is a bearish signal, which suggests that if USD/CAD doesn’t climbe above the resistance area, we’ll see further deterioration and a drop to (at least) 1.0881, where this week’s low is.
Having say that, let’s examine the daily chart.
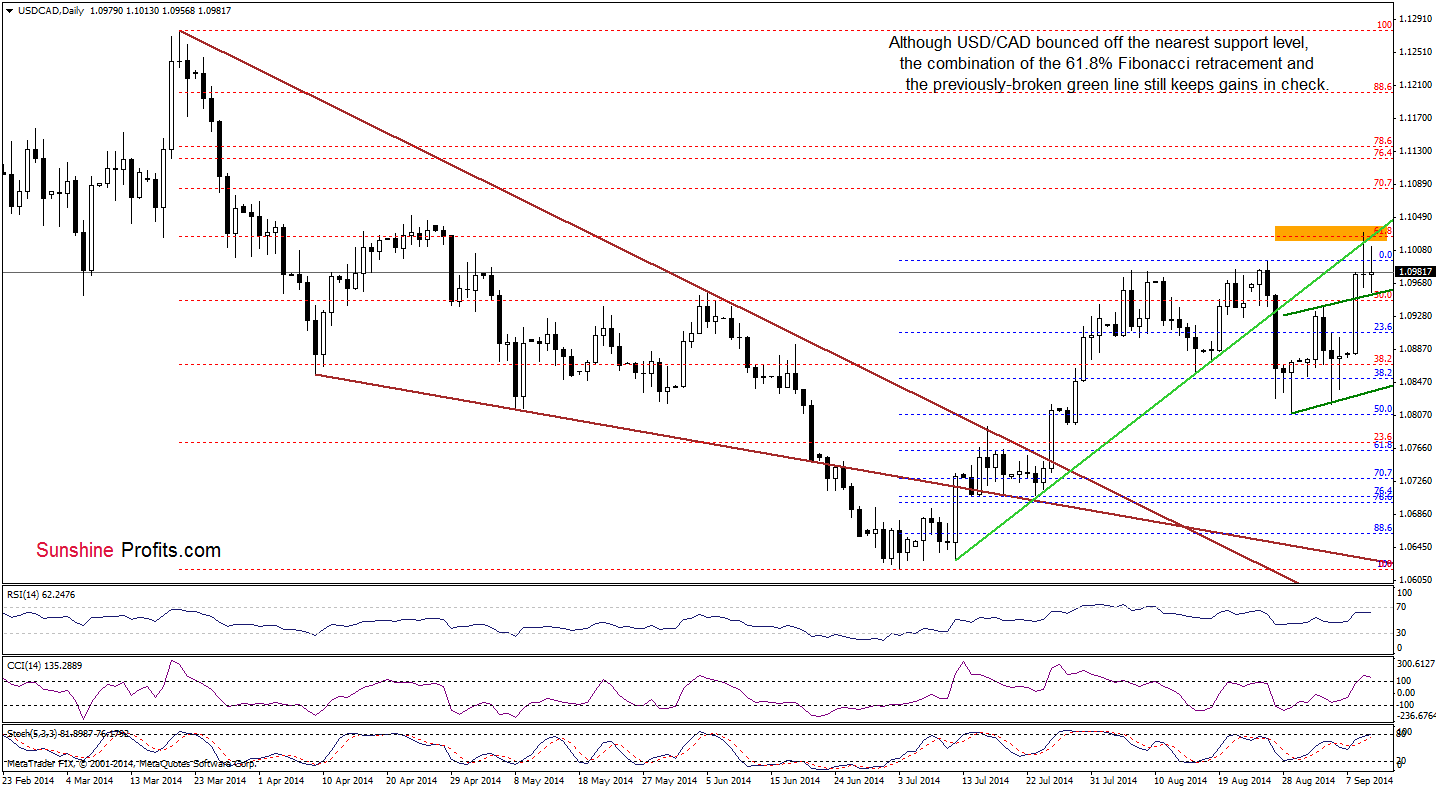
Yesterday, we wrote the following:
(…) currency bulls didn’t manage to break above the green support/resistance line, which is currently reinforced by the 61.8% Fibonacci retracement. At this point, it’s worth noting that we saw to unsuccessful attempts to break above this line in the previous week. Back then, they preceded a correction, which suggests that we may see similar price action in the coming days (…) If this is the case, we’ll likely see a comeback to the previously-broken upper line of the small rising trend channel (currently around 1.0948).
From this perspective, we see that currency bears realized this scenario (as we expected) and USD/CAD slipped to our initial downside target earlier today. Although the pair rebounded slightly, it still remains below the green support/resistance line and the 61.8% Fibonacci retracement, which together create a strong resistance zone. Therefore, in our opinion, as long as there is no breakout above this area, another attempt to move lower is more likely than not - especially if the indicators generate sell signals.
Very short-term outlook: mixed with bearish bias
Short-term outlook: mixed
MT outlook: mixed
LT outlook: bearish
Trading position (short-term): In our opinion opening short positions with a stop-loss order at 1.1068 is justified from the risk/reward perspective. We will keep you informed should anything change, or should we see a confirmation/invalidation of the above.
USD/CHF
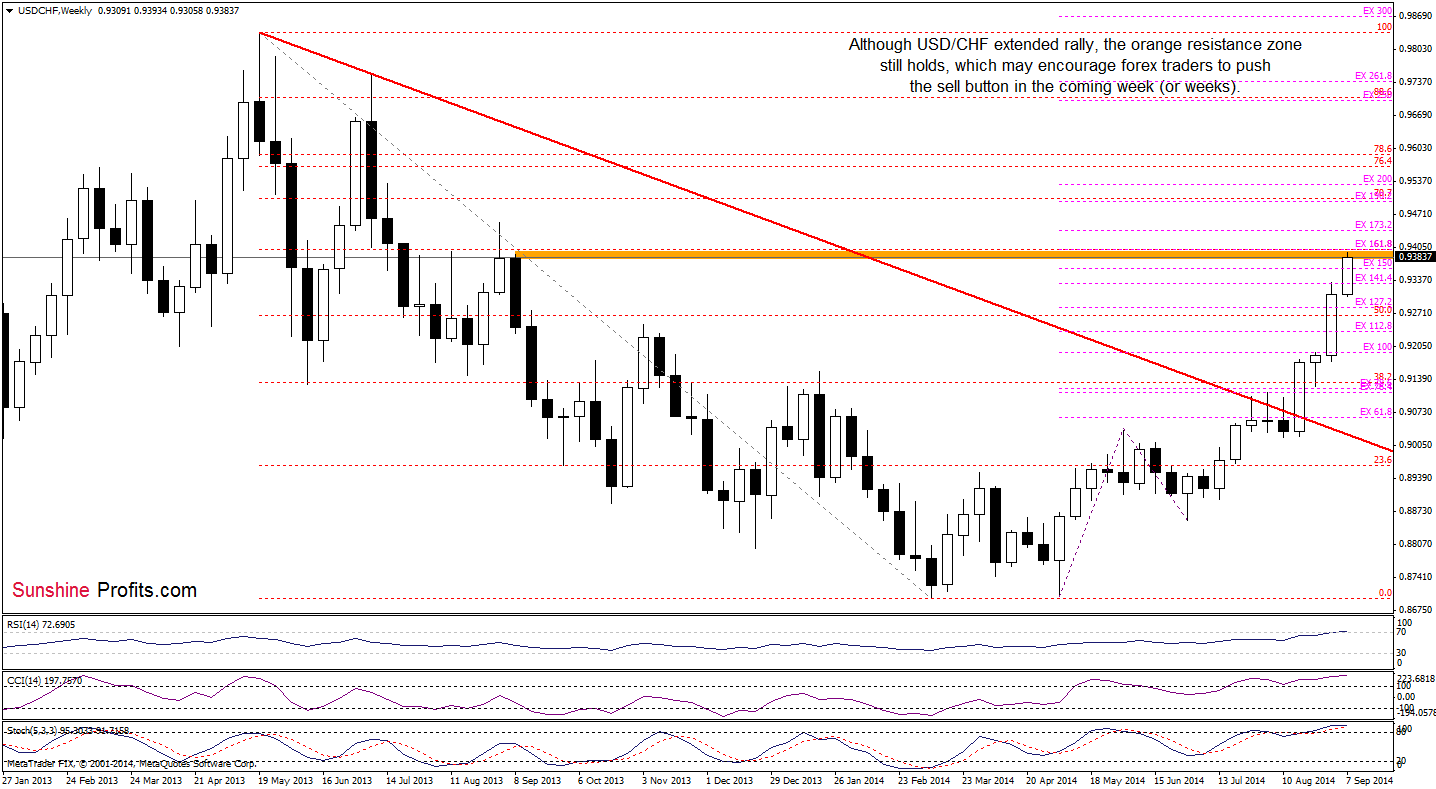
The medium-term outlook has improved once again as USD/CHF broke above the last week’s high and climbed to the strong orange resistance zone created by the 161.8% Fibonacci price projection and the 61.8% Fibonacci retracement. Will this area be strong enough to stop the rally in the near future? Let’s take a closer look at the daily chart and find out.
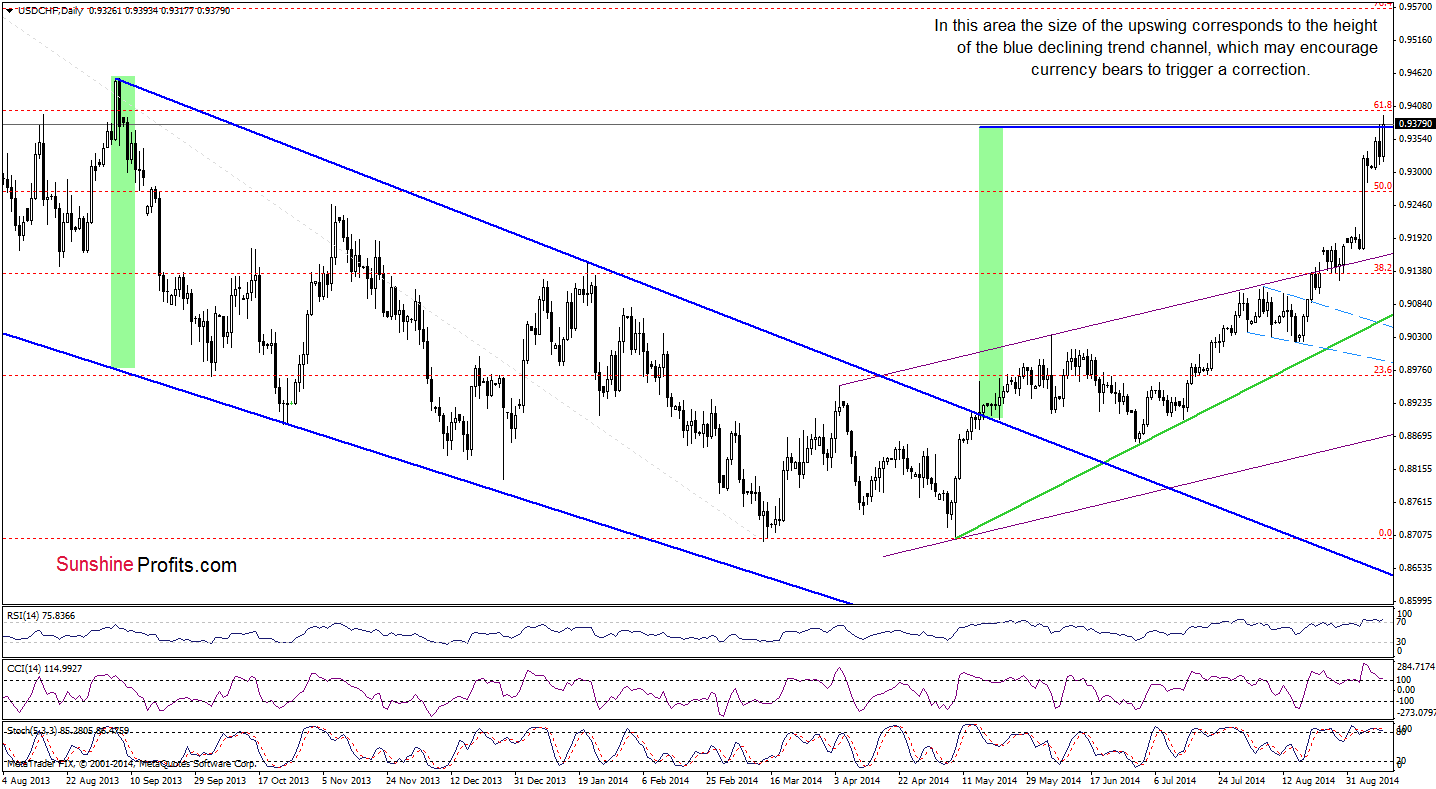
From this perspective, we see that currency bulls didn’t rest on their laurels and pushed the exchange rate higher in the recent days. With this upswing, the pair climbed above 0.9373, where the size of the upward move corresponds to the height of the long-term declining trend channel (marked with blue). Taking this fact into account and combining it with the current position of the indicators (they all are overbought and there are negative divergences between the CCI, Sochastic Oscillator and the exchange rate) and the strong orange resistance zone seen on the weekly chart, it seems to us that the next move will be to the downside.If this is the case, the initial downside target will be around 0.9284, where the bottom of the previous pullback is.
Very short-term outlook: mixed with bearish bias
Short-term outlook: mixed with bearish bias
MT outlook: mixed with bullish bias
LT outlook: bearish
Trading position (short-term): In our opinion no positions are justified from the risk/reward perspective. We will keep you informed should anything change, or should we see a confirmation/invalidation of the above.
AUD/USD
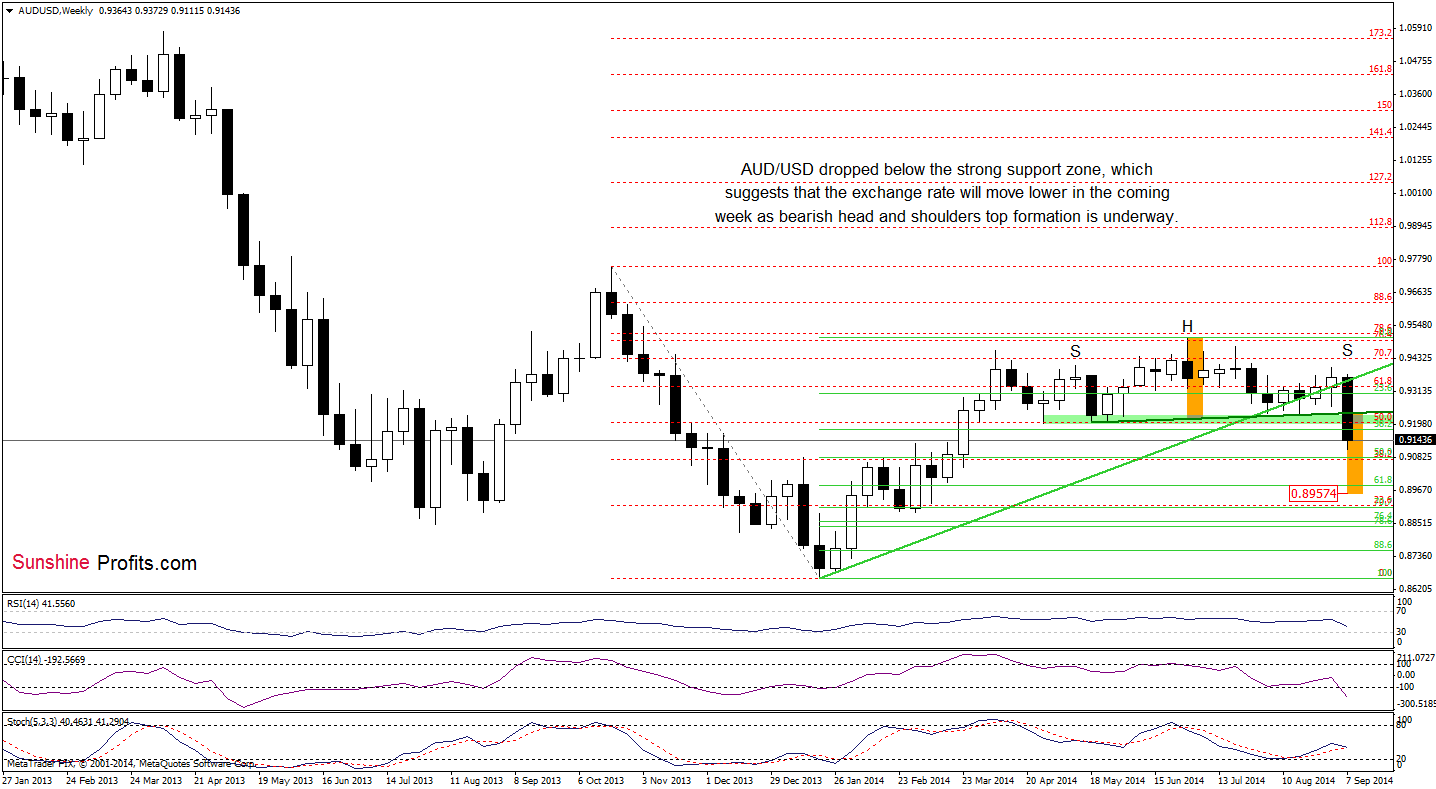
On the above chart, we see that AUD/USD dropped not only below the long-term green support line and the neck line of the head and shoulder top formation (marked with dark green), but also declined under the strong green support zone. This strong bearish signal triggered further deterioration and a drop to a multi-month low of 0.9111, which suggests that we may see lower values of AUD/USD as bearish top formation is underway.
Are there any short-term support levels that could hinder the realization of the above-mentioned scenario? Let’s check.
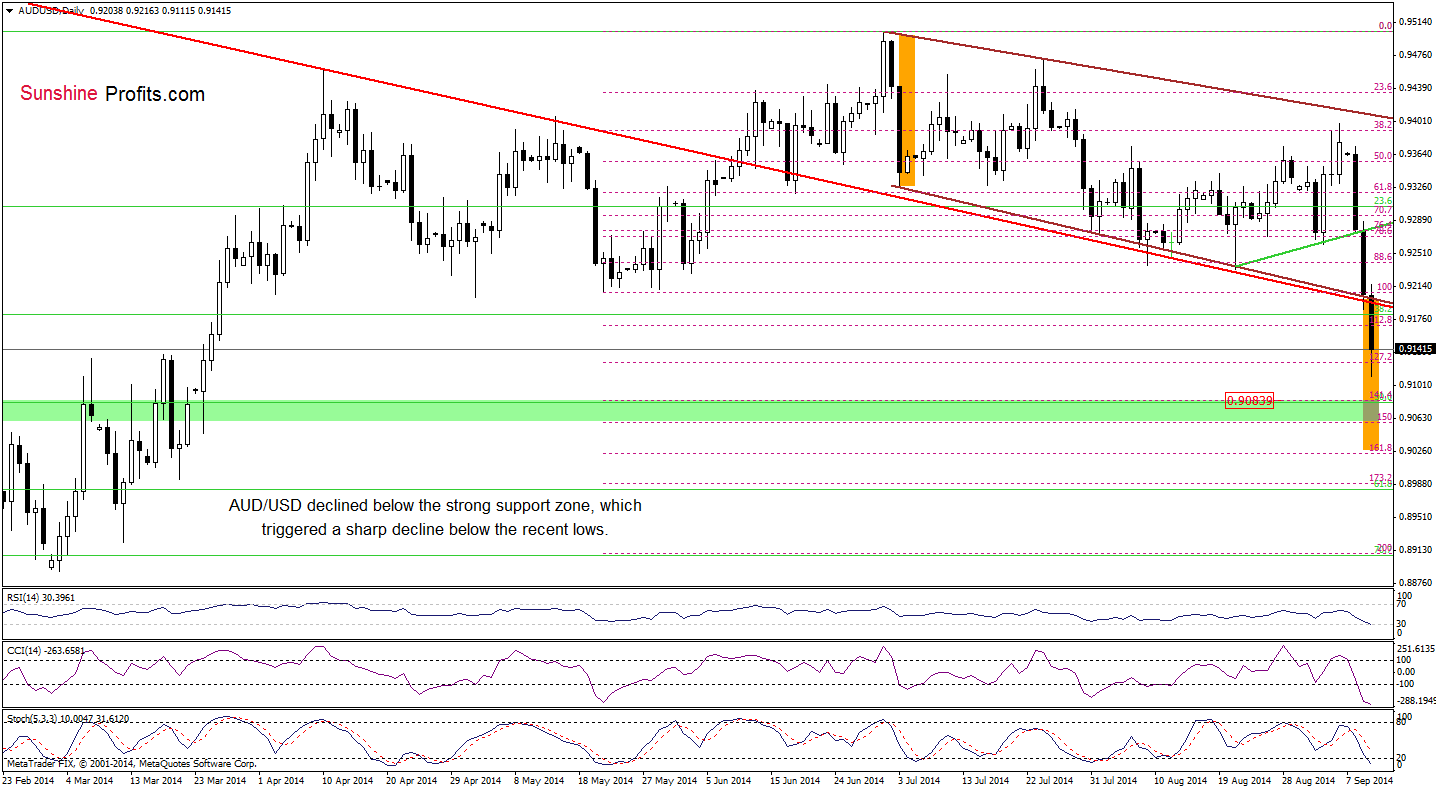
From this perspective, we see that AUD/USD moved lower and dropped below two very important support lines: the long-term red line and the lower border of the declining trend channel. This strong bearish signal triggered a sharp decline that took the pair to slightly below the 127.2% Fibonacci extension. Although this support level caused a small upswing, we should keep in mind that a drop under the lower border of the declining trend channel suggests further deterioration and correction to around 0.9026, where the size of the move will correspond to the height of the formation (please note that this area is reinforced by the 161.8% Fibonacci extension). As you see on the above chart, the position of the indicators also favors currency bears at the moment.
Very short-term outlook: bearish
Short-term outlook: mixed with bearish bias
MT outlook: mixed with bearish bias
LT outlook: bearish
Trading position (short-term): In our opinion no positions are justified from the risk/reward perspective. We will keep you informed should anything change, or should we see a confirmation/invalidation of the above.
Thank you.
Nadia Simmons
Forex & Oil Trading Strategist
Przemyslaw Radomski, CFA
Founder, Editor-in-chief
Gold & Silver Trading Alerts
Forex Trading Alerts
Oil Investment Updates
Oil Trading Alerts

