
The U.S. dollar moved lower against other major currencies after the disappointing University of Michigan report showed that consumer sentiment index declined to a four-month low of 81.3 in July, from a reading of 82.5 in the previous month, missing expectations for rise to 83.0. As a result, EUR/USD rebounded slightly from a 5-month low, while USD/CHF tested the strength of the strong resistance zone. What happened at the same time with other currency pairs? What is their current outlook?
In our opinion the following forex trading positions are justified - summary:
- EUR/USD: short (stop-loss order: 1.3670)
- GBP/USD: none
- USD/JPY: none
- USD/CAD: none
- USD/CHF: none
- AUD/USD: none
EUR/USD
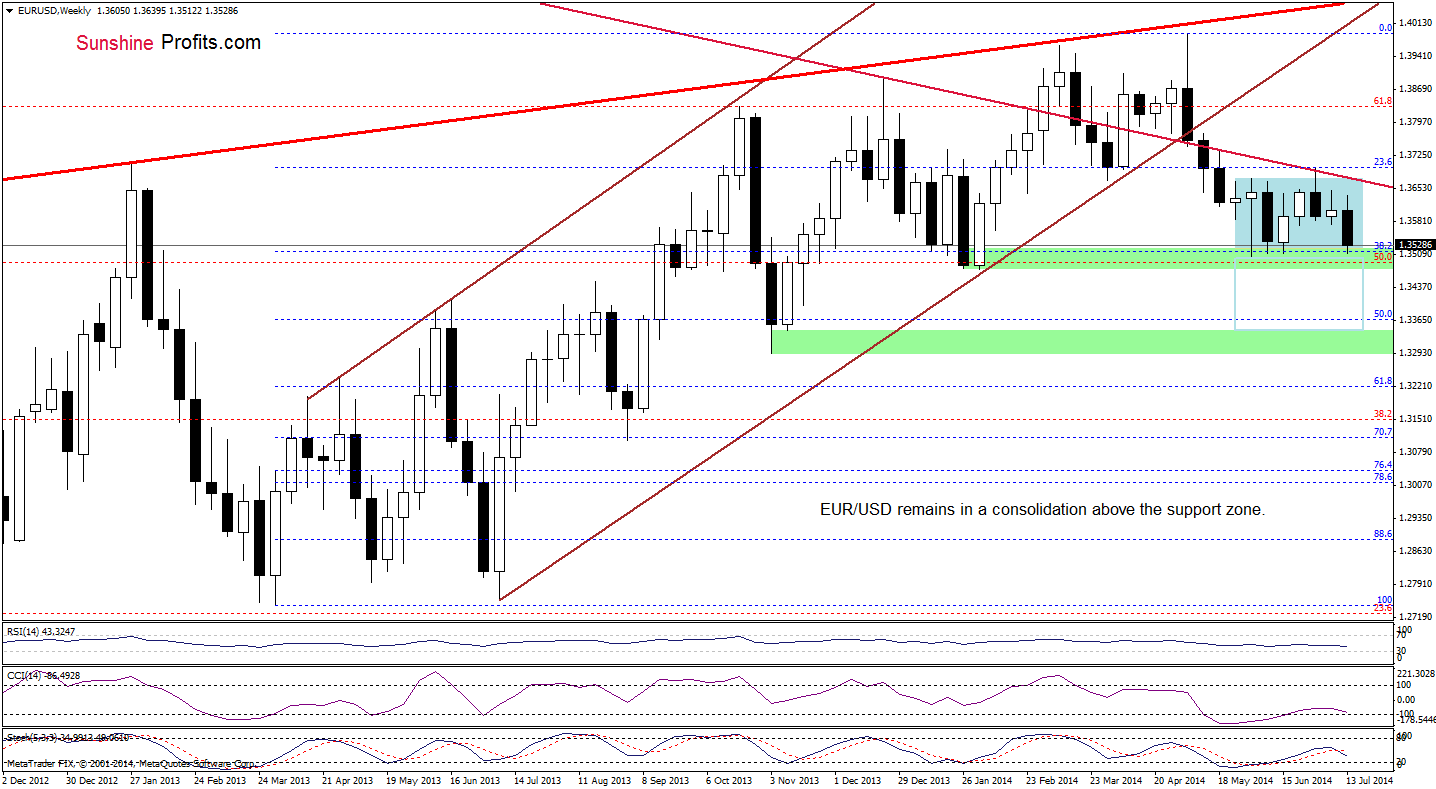
From the weekly perspective, the overall situation hasn’t changed much as EUR/USD still remains slightly above the lower border of the consolidation. Therefore, what we wrote yesterday is up-to-date:
(…) this area is reinforced by the 38.2% Fibonacci retracement and the June and February lows. If this strong support zone withstand the selling pressure, we’ll see another attempt to break above the upper border of the consolidation and the long-term resistance line (similarly to what we saw at the beginning and also in mid-June). However, if currency bulls fail and the pair moves lower, we may see a drop even to around 1.3320, where the size of the downswing will correspond to the height of the consolidation.
Having discussed the medium-term outlook, let’s check the daily chart.
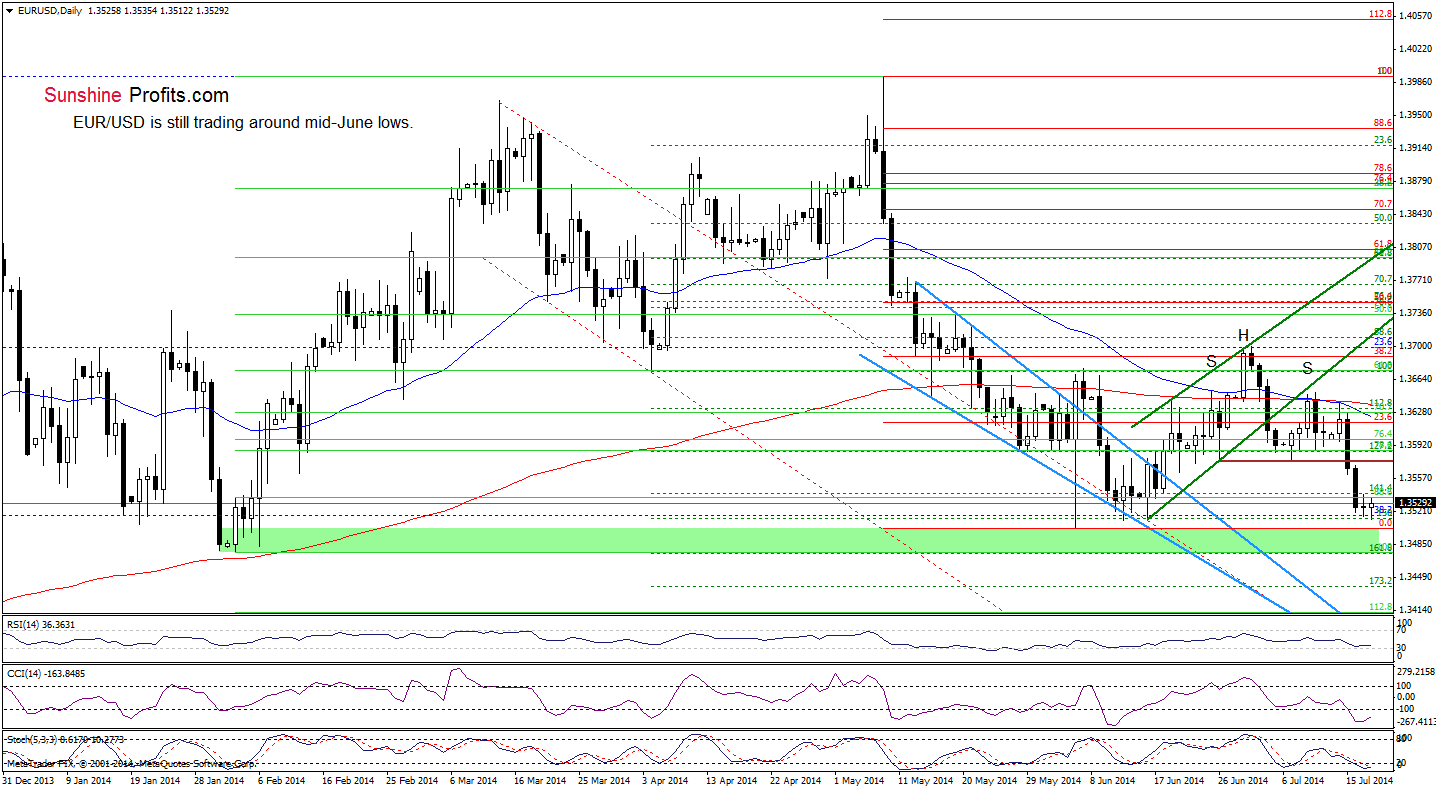
Looking at the above chart, we see that the situation in the very short-term hasn’t changed much as EUR/USD is trading in a narrow range, slightly above the June lows. That’s why we are convinced that our last commentary is still valid:
(…) If this area holds, we may see a corrective upswing to the previously-broken neck line of the bearish head and shoulders reversal formation. However, if it is broken, the next target for currency bears will be around 1.3476, where the February low is. Please note that although the CCI and Stochastic Oscillator are overbought, they didn’t generate buy signals, which supports the bearish case at the moment.
Very short-term outlook: bearish
Short-term outlook: mixed with bearish bias
MT outlook: bearish
LT outlook: bearish
Trading position (short-term): Small short positions (using half of the capital that one would normally use). Stop-loss order: 1.3670. We will keep you informed should anything change, or should we see a confirmation/invalidation of the above.
GBP/USD
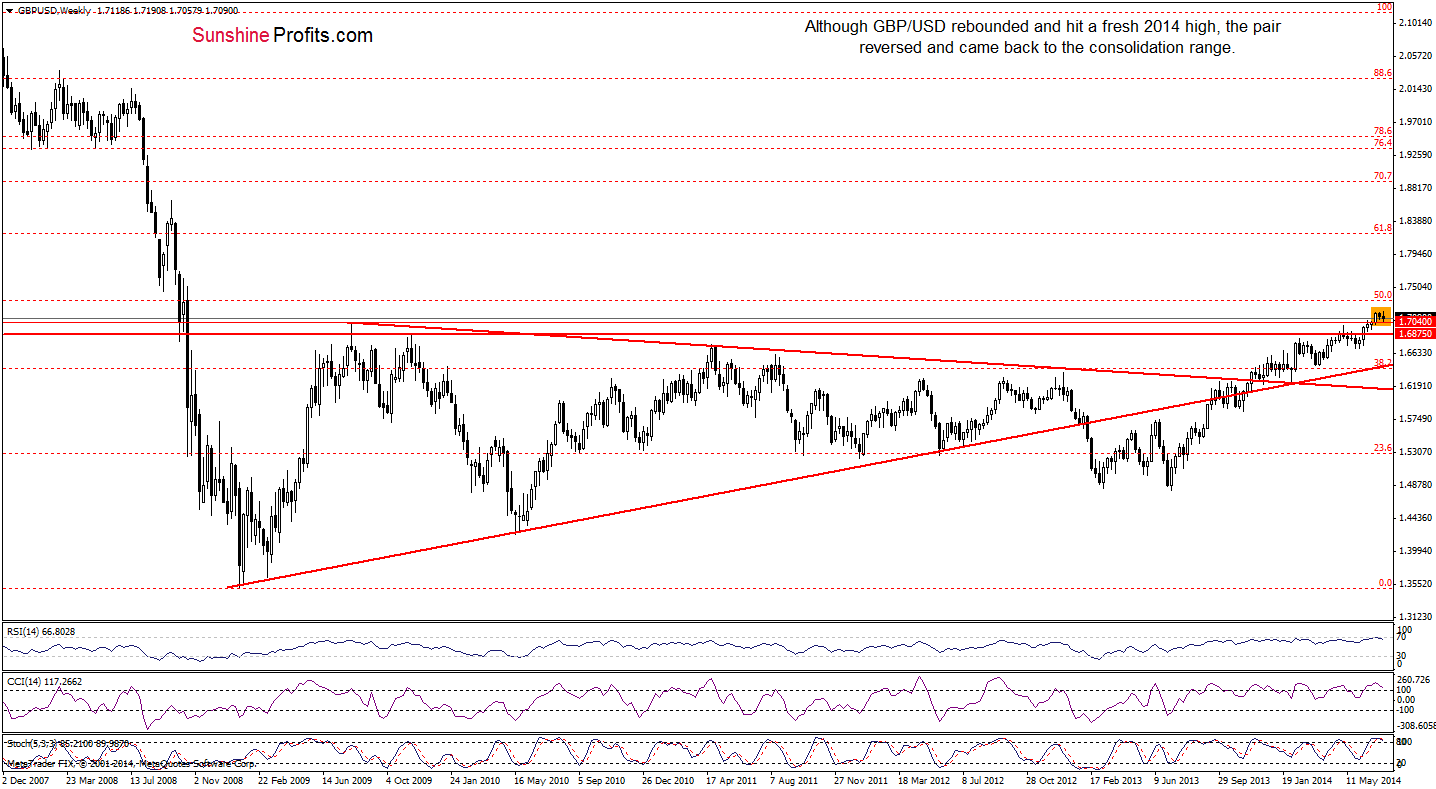
Although GBP/USD moved higher earlier this week, hitting a fresh 2014 high, the pair reversed and came back to the consolidation above the key support line created by the 2009 high. As you know from out previous alerts, an invalidation of the breakout is a bearish signal, which usually triggers a correction. Will we see similar price action in the coming week? In our opinion, as long as the exchange rate remains above its major support, another sizable downward move is not likely to be seen. Nevertheless, we should keep in mind that the RSI generated a sell signal, while the CCI and Stochastic Oscillator are very close to doing it, which suggests that we may see a test of the strength of the horizontal support line in the near future.
Can we infer something more from the daily chart?
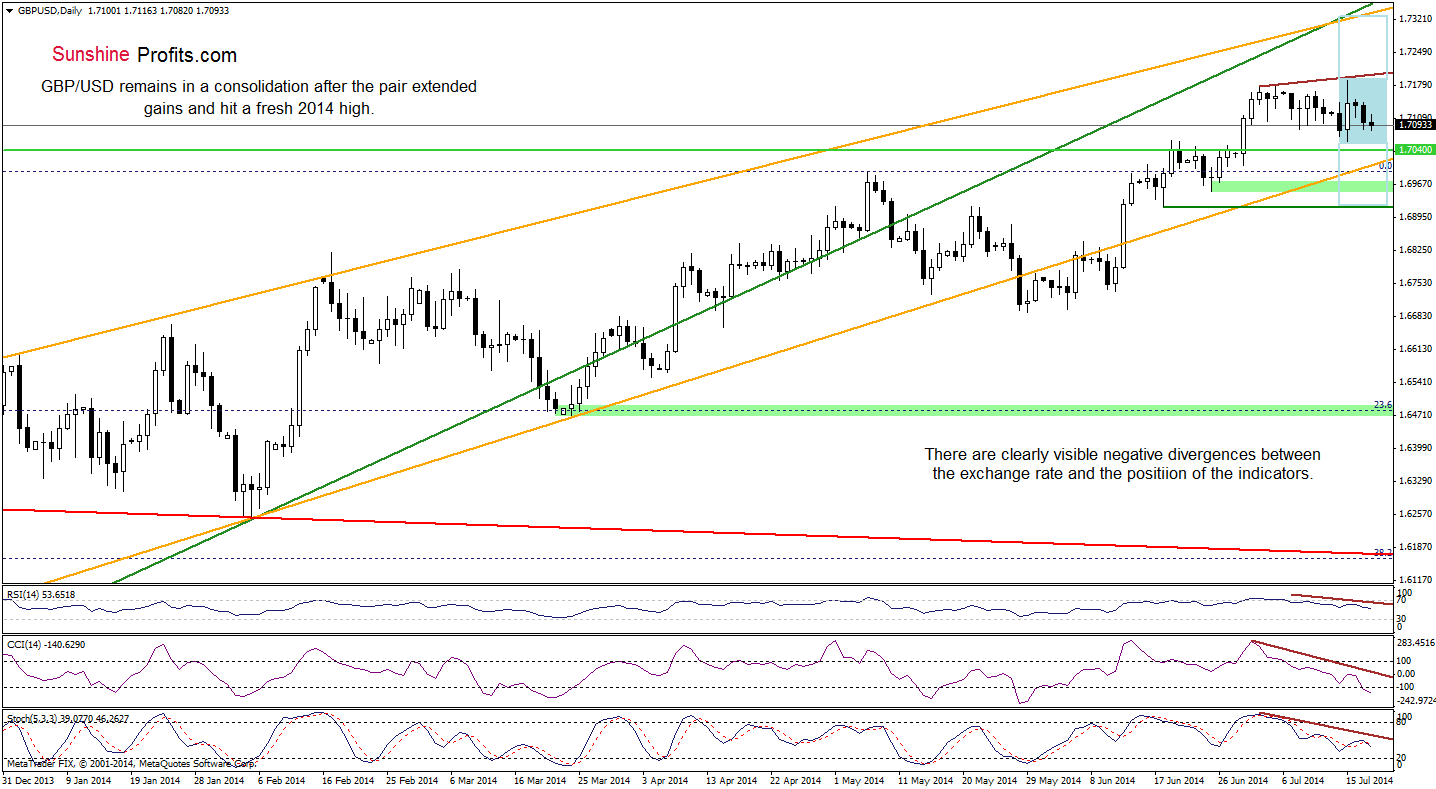
In our last commentary on this currency pair we wrote:
(…) the pair approached the 23.6% Fibonacci retracement, which serves as the nearest support. If his area holds, we’ll see a rebound even to the recent highs.
On the above chart, we see that currency bulls not only realized the above-mentioned scenario, but also pushed GBP/USD to a fresh 2014 high. Despite this improvement, they didn’t manage to hold gained levels and the pair reversed, declining below the previous highs. Although this is a bearish signal, we think that as long as the exchange rate is trading in a consolidation, we won’t see another bigger move. So, where the pair head next? In our opinion, based on the visible negative divergences between GBP/USD and all indicators, the next move will be to the downside. As you see on the above chart, if the pair breaks below the lower border of the consolidation, the nearest downside target will be the 2009 high, and the next - the medium-term orange line. Please note that only if the pair breaks below these lines, we’ll see a correction to around June 18 low, where the size of a pullback will correspond to the height of the formation.
Very short-term outlook: bearish
Short-term outlook: mixed with bearish bias
MT outlook: bearish
LT outlook: mixed
Trading position (short-term): In our opinion, no positions are justified from the risk/reward perspective. We will keep you informed should anything change, or should we see a confirmation/invalidation of the above.
USD/JPY
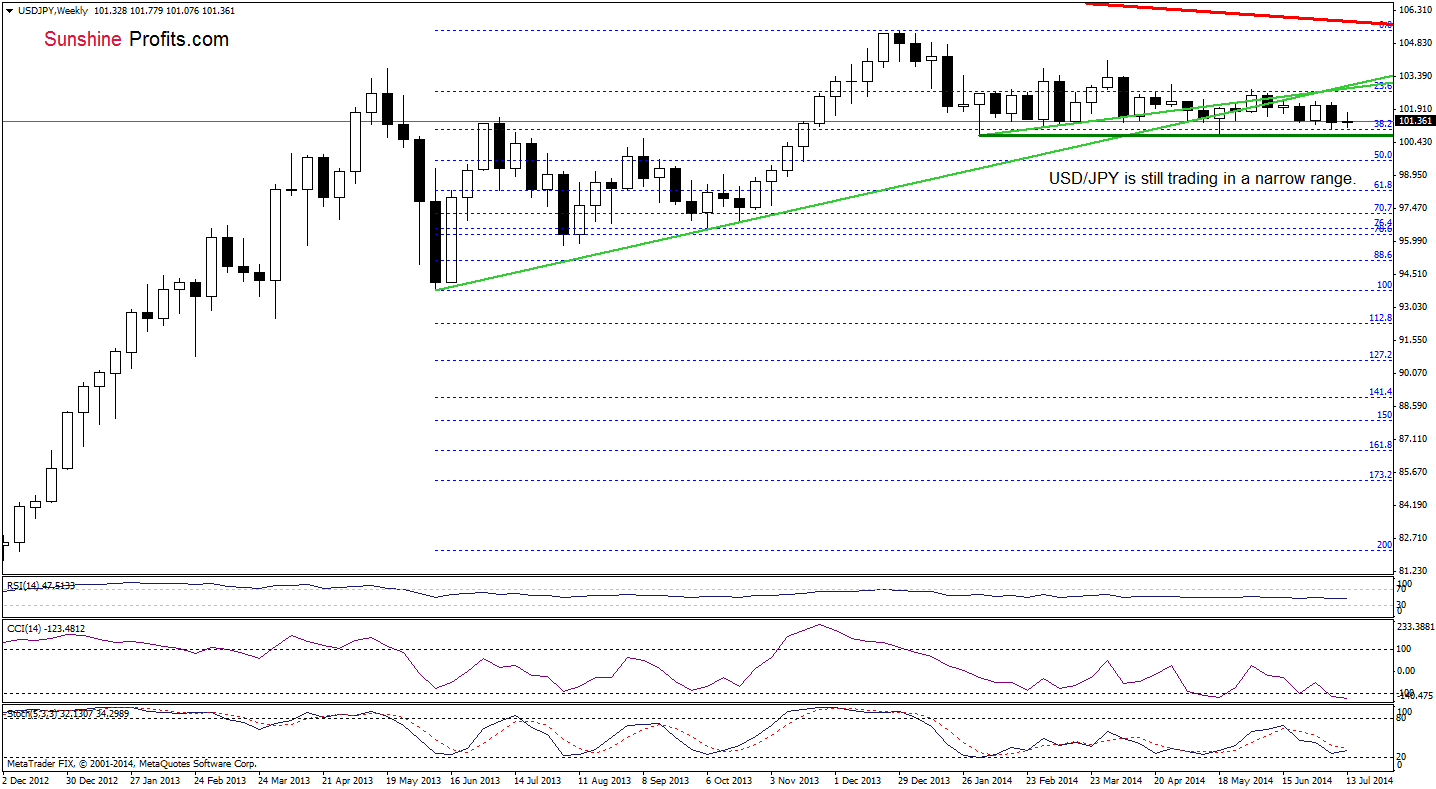
The medium-term picture remains unchanged as USD/JPY still remains between the medium-term support/resistance and the May low of 100.81. In our opinion, as long as there is no breakout above the nearest resistance (or breakdown below the major support) another sizable move is not likely to be seen.
Having say that, let’s find out what can we infer from the very short-term picture.
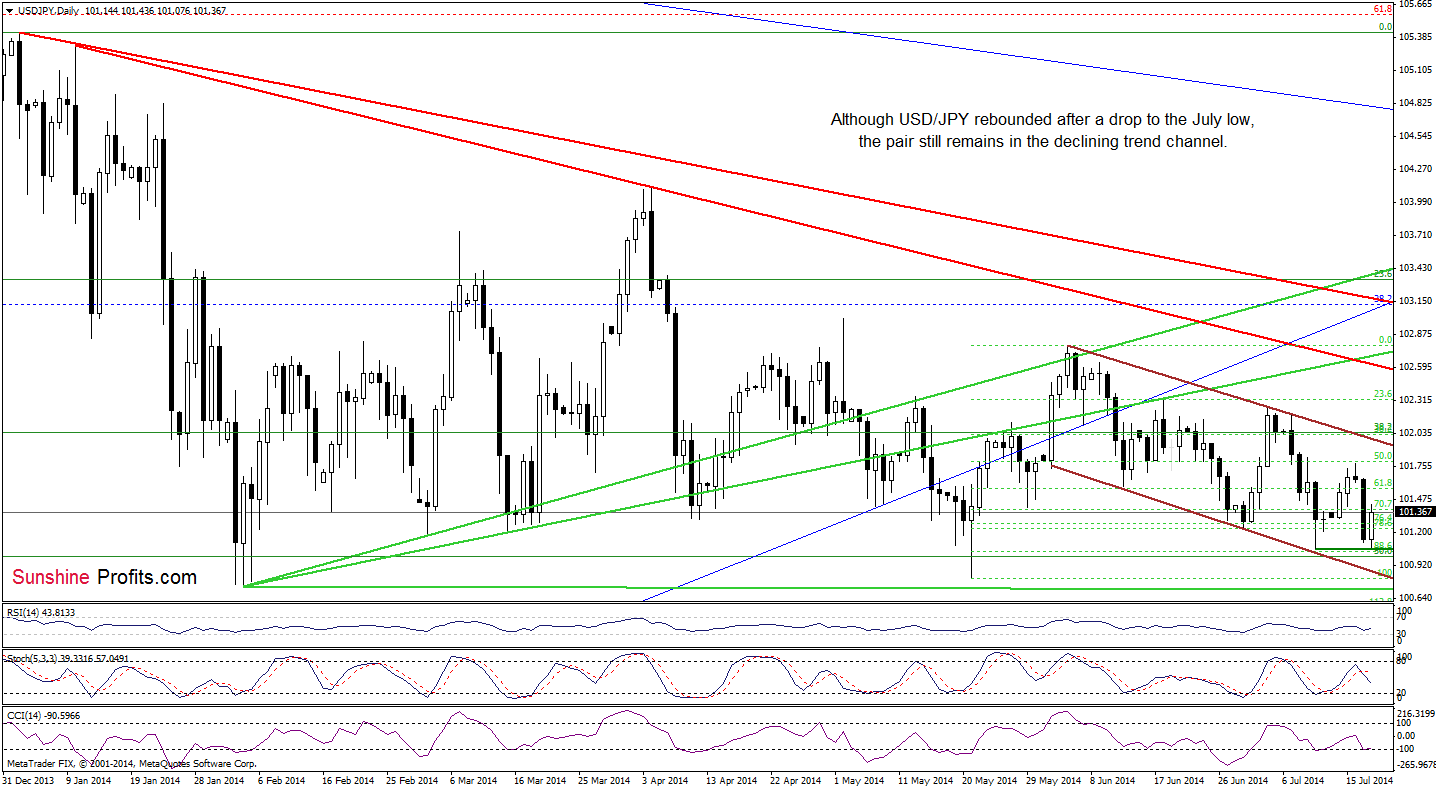
Quoting our last commentary on this currency pair:
(…) Taking into account the current position of the indicators, it seems that the exchange rate will move lower in the coming day (or days) and drop to the July low of 101.05. If this support level withstand the selling pressure, we’ll see a rebound to yesterday’s high
From today’s point of view, we see that the proximity to the July low was enough to trigger an upswing earlier today. So far, the pair didn’t reach its upside target, which means that if currency bulls give up half way we’ll see a test of the strength of the green support line once again. Please keep in mind that if it is broken, the next downside target will be the lower border of the declining trend channel (currently around 100.89).
Very short-term outlook: mixed
Short-term outlook: mixed
MT outlook: mixed
LT outlook: bearish
Trading position (short-term): In our opinion no positions are justified from the risk/reward perspective at the moment. We will keep you informed should anything change, or should we see a confirmation/invalidation of the above.
USD/CAD
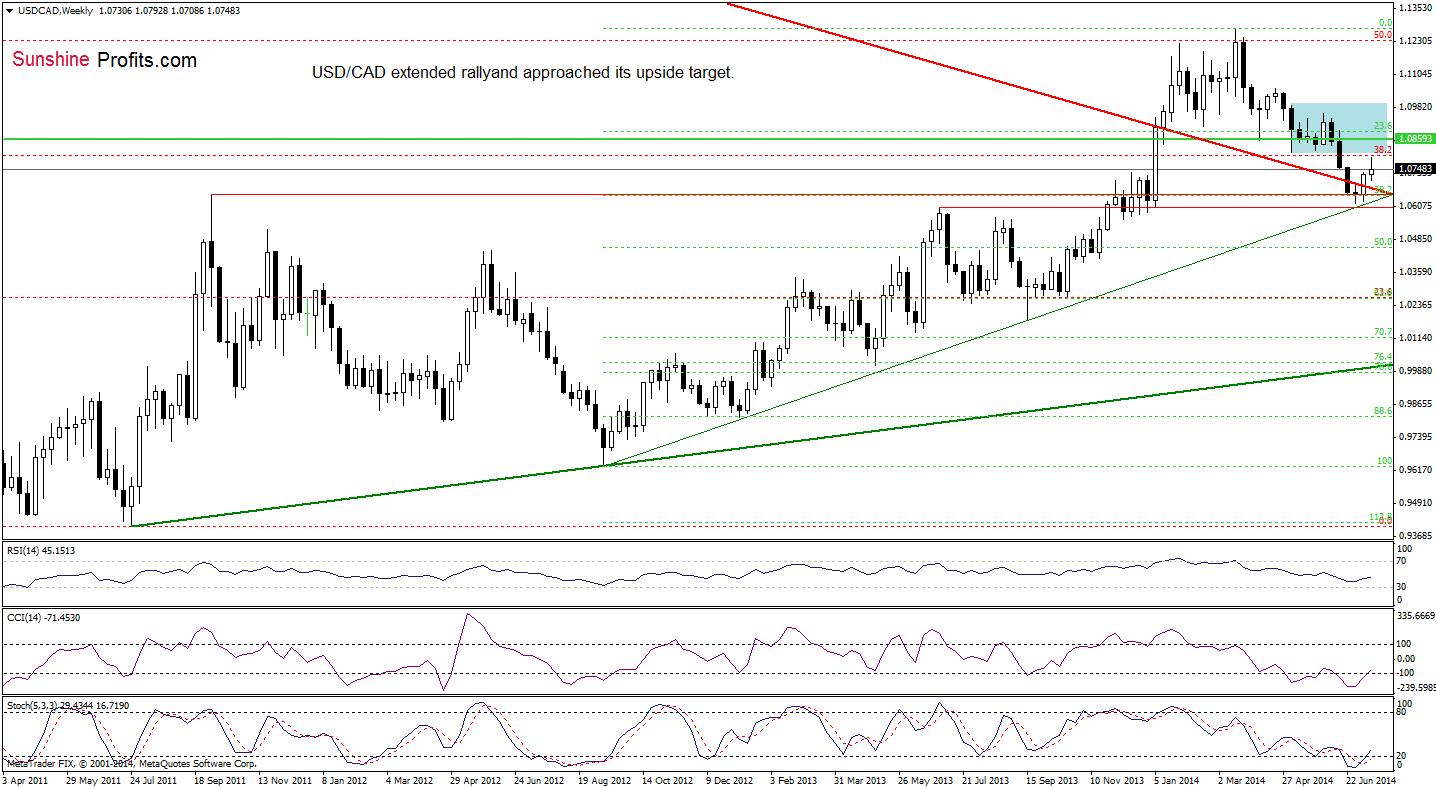
Although the medium-term picture has improved as USD/CAD extended gains, the proximity to the resistance level created by the previously-broken lower border of the consolidation (marked with blue) triggered a pullback. Will we see further deterioration in the coming week? Let’s check the daily chart.
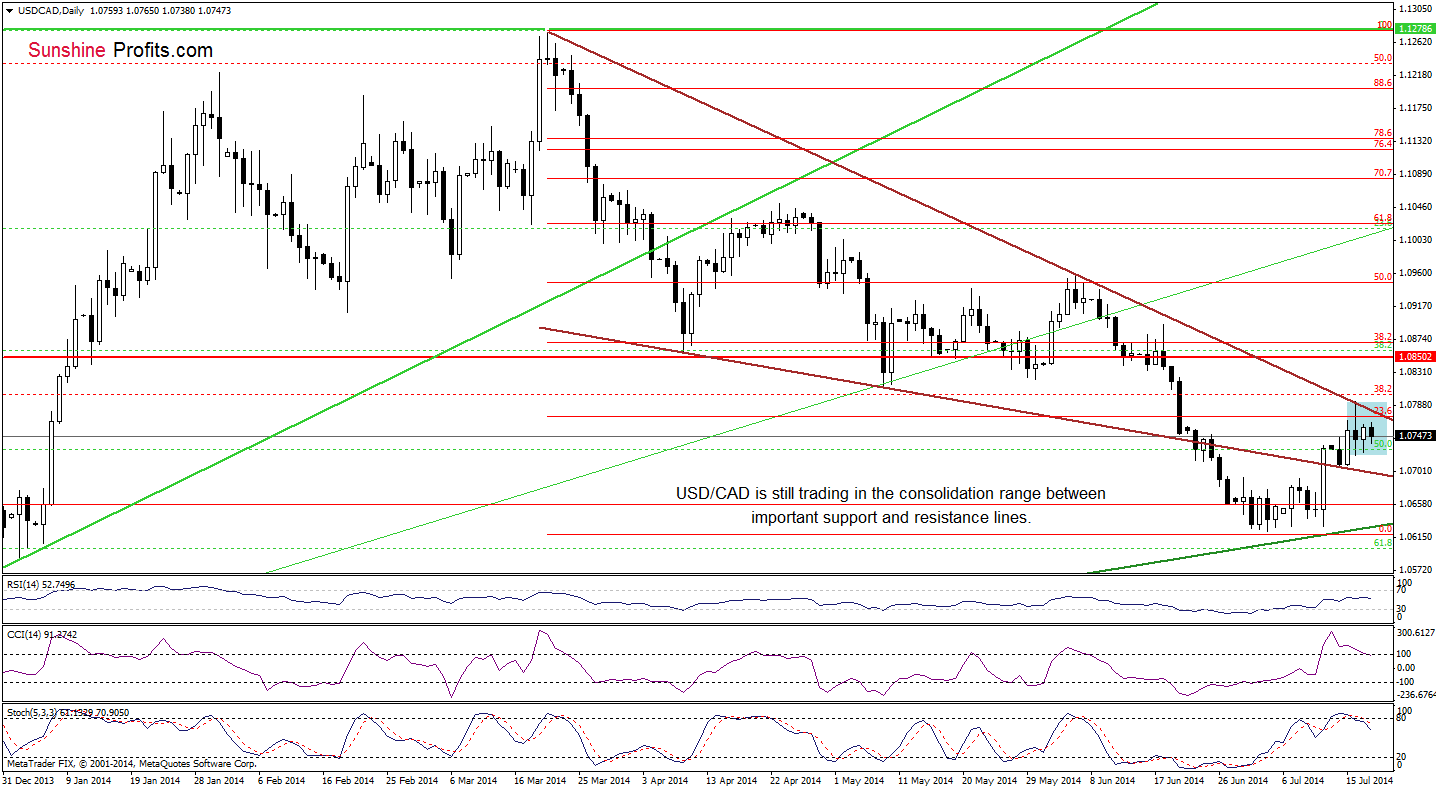
Looking at the above chart, we see that the overall situation hasn’t changed much since our last commentary on this currency pair was posted as USD/CAD is trading in a consolidation between important support/resistance lines. Therefore, what we wrote on Wednesday is still up-to-date:
(…) Although the situation hasn’t deteriorated significantly (the exchange rate is still trading above the lower border of the declining wedge), it seems to us that as long as there is no breakout above the upper brown resistance line, we won’t see further improvement. On top of that, if indicators generate sell signals, we’ll likely see a breakdown not only below the major support line, but also a re-test of the strength of the long-term green support line.
Please note that the CCI an Stochastic Oscillator generated sell signals, which means that the bearish scenario is more likely at the moment.
Very short-term outlook: mixed with bearish bias
Short-term outlook: mixed
MT outlook: mixed
LT outlook: bearish
Trading position (short-term): In our opinion no positions are justified from the risk/reward perspective. We will keep you informed should anything change, or should we see a confirmation/invalidation of the above.
USD/CHF
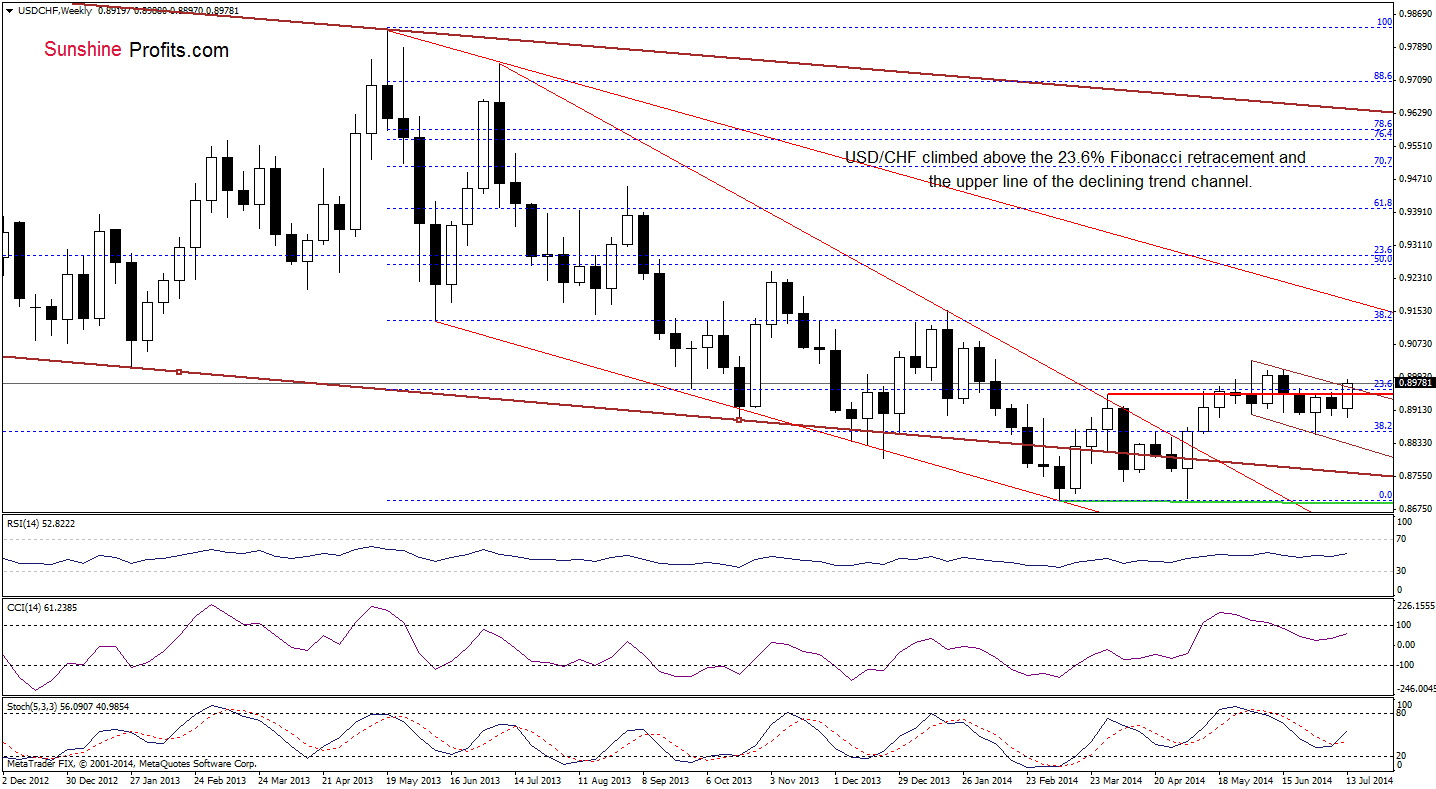
From this perspective, we see that the situation has improved as USD/CHF came back above the April high and the 23.6% Fibonacci retracement. With this upswing, the pair also broke above the upper line of the declining trend channel, which suggests further improvement and an increase to at least recent highs.
Will the short-term picture confirm this scenario?
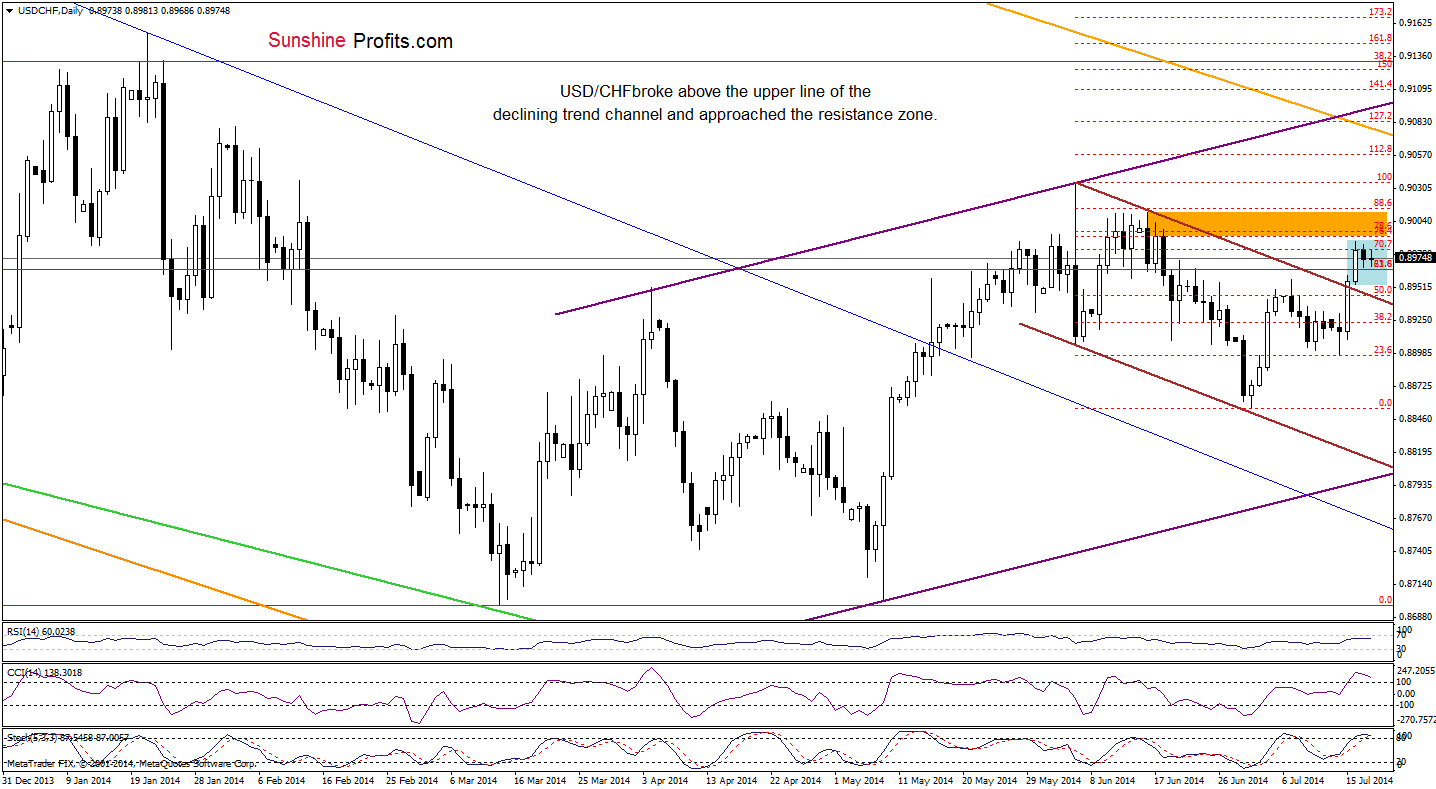
Looking at the above chart, we see that USD/CHF paused after a breakout above the upper line of the declining trend channel and remains in a consolidation. If the pair moves higher, we’ll see a test of the strength of the resistance zone created by mid-June highs and the 76.4% and 78.6% Fibonacci retracement levels (marked with orange). In our opinion, only if this area is broken, we’ll see an increase to around the 2014 high. However, at this point, we should take a closer look at the position of the indicators. Are they supporting the above bullish scenario? Not really. The RSI reached its highest level since the beginning of June. Back then such high reading in combination with the position of the CCI and Stochastic Oscillator (today they are even higher) triggered a sharp correction. If history repeats itself once again, we may see similar price action in the coming day (or days).
Very short-term outlook: mixed
Short-term outlook: mixed
MT outlook: mixed with bullish bias
LT outlook: bearish
Trading position (short-term): In our opinion no positions are justified from the risk/reward perspective. We will keep you informed should anything change, or should we see a confirmation/invalidation of the above.
AUD/USD
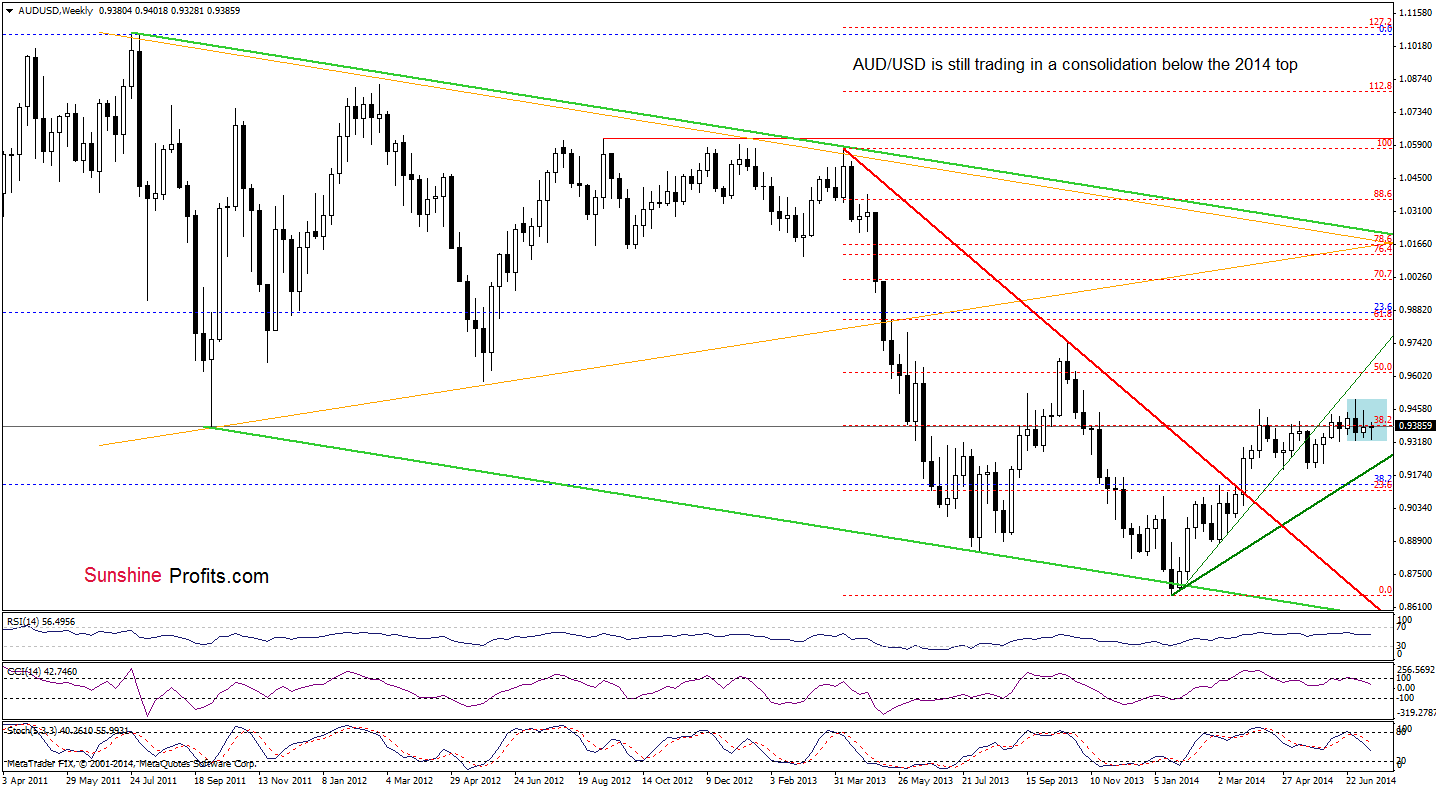
The medium-term outlook remains mixed as AUD/USD is still trading in a consolidation slightly below the 2014 high. Will the very short-term picture give us more learly clues where the pair head next? Let’s check.
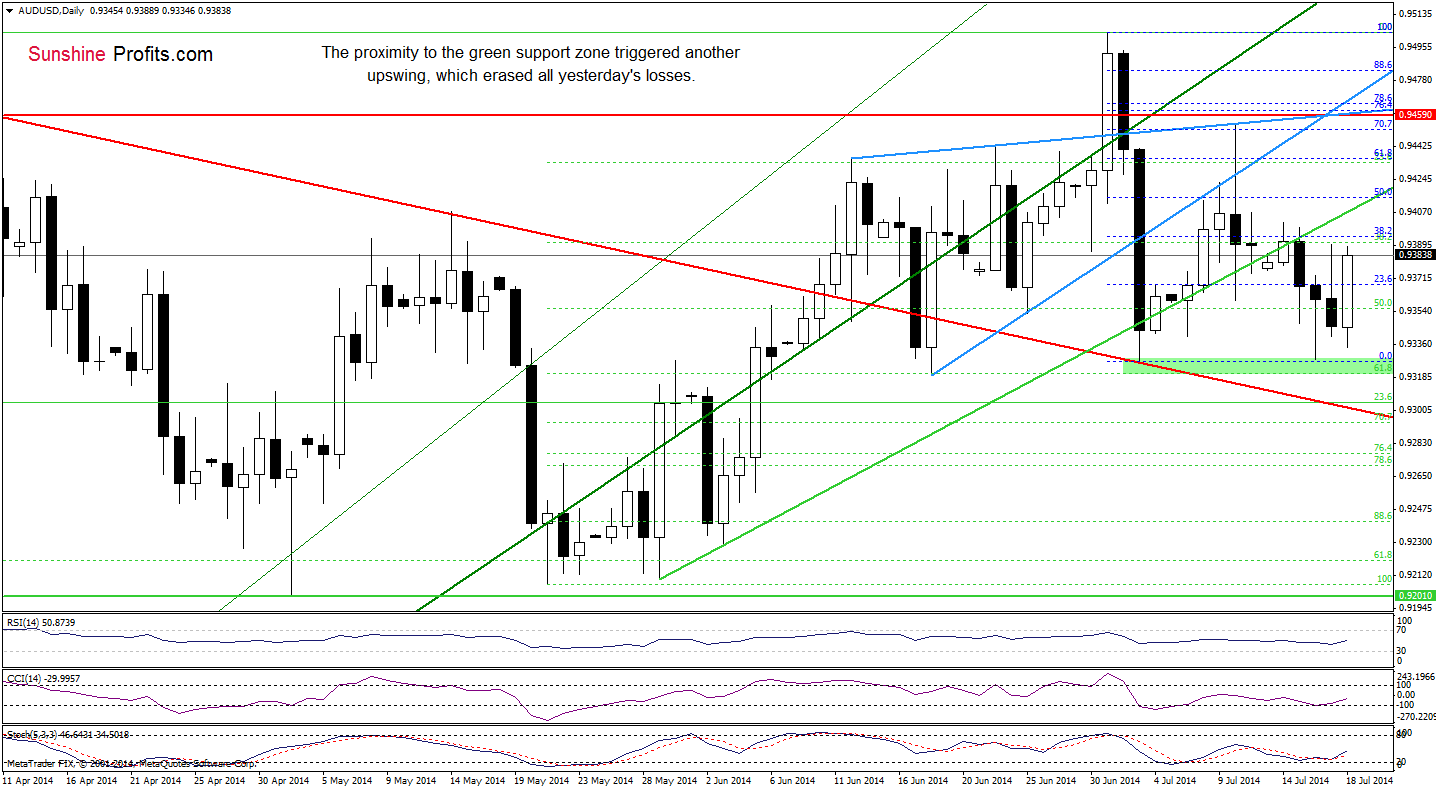
Yesterday, we wrote that if the proximity to the nearest resistance encouraged forex traders to push the sell button, we would see a pullback to the green support zone. Although we saw a correction earlier today, the proximity to this support area encouraged forex traders to push the buy button, which resulted in a sharp upswing that erased all yesterday’s losses. This is a bullish signal, and we think that the pair will increase to at least its key support/resistance line (this scenario is still supported by the position of the indicators). If it is broken, the upside target will be around 0.9454, where the strong resistance zone (created by the July 10 high, the 70.7% Fibonacci retracement and the upper line of the rising wedge) is.
Very short-term outlook: mixed with bullish bias
Short-term outlook: mixed
MT outlook: mixed
LT outlook: bearish
Trading position (short-term): In our opinion, no positions are justified from the risk/reward perspective. We will keep you informed should anything change, or should we see a confirmation/invalidation of the above.
Thank you.
Nadia Simmons
Forex & Oil Trading Strategist
Przemyslaw Radomski, CFA
Founder, Editor-in-chief
Gold & Silver Trading Alerts
Forex Trading Alerts
Oil Investment Updates
Oil Trading Alerts

