
Earlier today, the British pound declined against the U.S. dollar after data showed that overall industrial production was down 0.7%, while manufacturing production fell 1.3% in May, missing expectations for a gain of 0.4%. Because of this largest decline since January 2013, GBP/USD hit a fresh July low of 1.7084. Will we see an invalidation of the breakout above the 2009 high in the coming days?
In our opinion the following forex trading positions are justified - summary:
EUR/USD
The situation in the medium term hasn’t changed much as EUR/USD still remains in the consolidation below the long-term resistance line. Today, we’ll take a closer look at the very short-term changes.
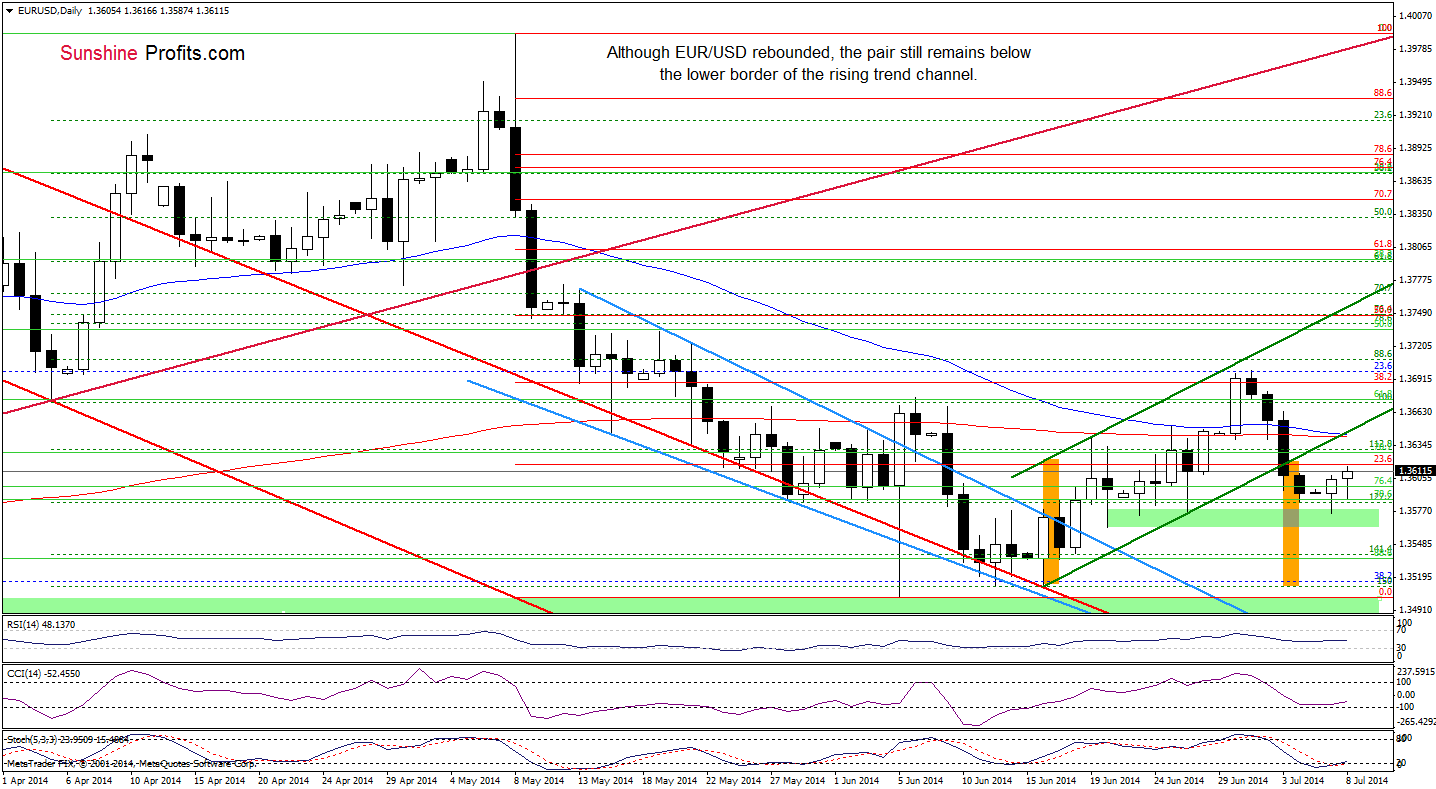
Although EUR/USD moved higher once again and reached the 23.6% Fibonacci retracement, the exchange rate still remains below the strong resistance zone created by the 50- and 200-day moving averages, which intersects the previously-broken lower border of the rising trend channel at the moment. Taking this fact into account, our last commentary on this currency pair is up-to-date:
(…) we think that we’ll see another bigger upswing only if EUR/USD invalidates earlier breakdown below this resistance. Therefore, as long as the exchange rate is trading under this line, another test of the strength of the support zone can’t be ruled out.
Very short-term outlook: mixed
Short-term outlook: mixed with bearish bias
MT outlook: bearish
LT outlook: bearish
Trading position (short-term; our opinion): In our opinion no positions are justified from the risk/reward perspective. We will keep you informed should anything change, or should we see a confirmation/invalidation of the above.
GBP/USD
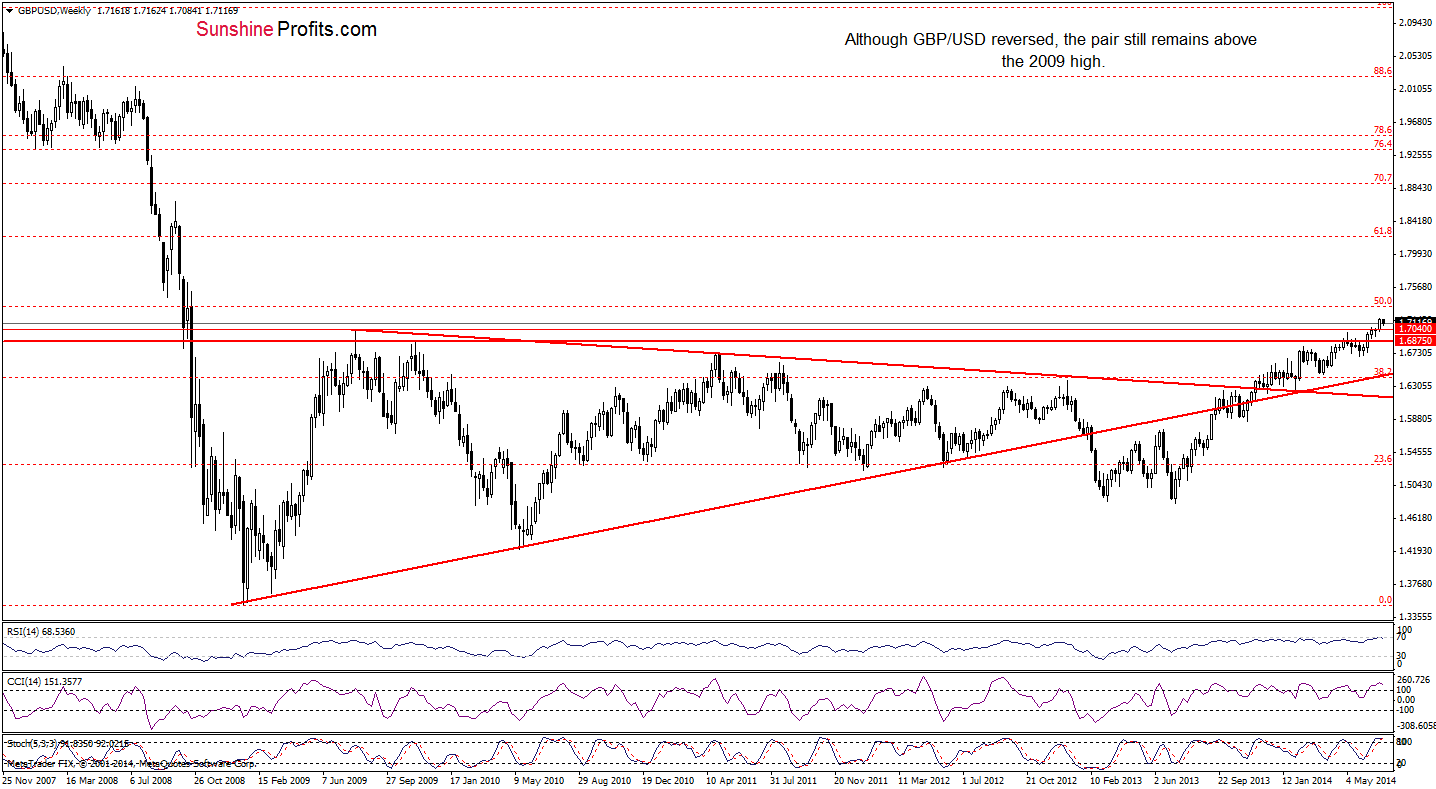
Looking at the above chart, we see that although GBP/USD reversed and declined, the pair is still trading above the 2009 high. Therefore, we think that another sizable downward move will be more likely only if the exchange rate invalidates the breakout above this horizontal support line. Please note that the CCI and Stochastic Oscillator are overbought, while the RSI reached the level of 70, which together suggests that correction is just around the corner.
Will the very short-term picture give us more precise clues about future moves?

The first thing that catches the eye on the daily chart is position of the indicators. As you see, they all generated sell signals, which will likely encourage forex traders to push the sell button. If this is the case, we’ll see further declines and the initial downside target will be the green horizontal support line (the 2009 high). If it withstand the selling pressure, GBP/USD would rebound and come back to around recent highs. But if this important line is broken, we’ll see a drop to the green support zone created by the medium-term orange support line and the bottom of the previous correction (around 1.6950).
Very short-term outlook: bearish
Short-term outlook: mixed with bearish bias
MT outlook: bearish
LT outlook: mixed
Trading position (short-term): In our opinion, no positions are justified from the risk/reward perspective. We will keep you informed should anything change, or should we see a confirmation/invalidation of the above.
AUD/USD
Today, we’ll focus on the daily chart.
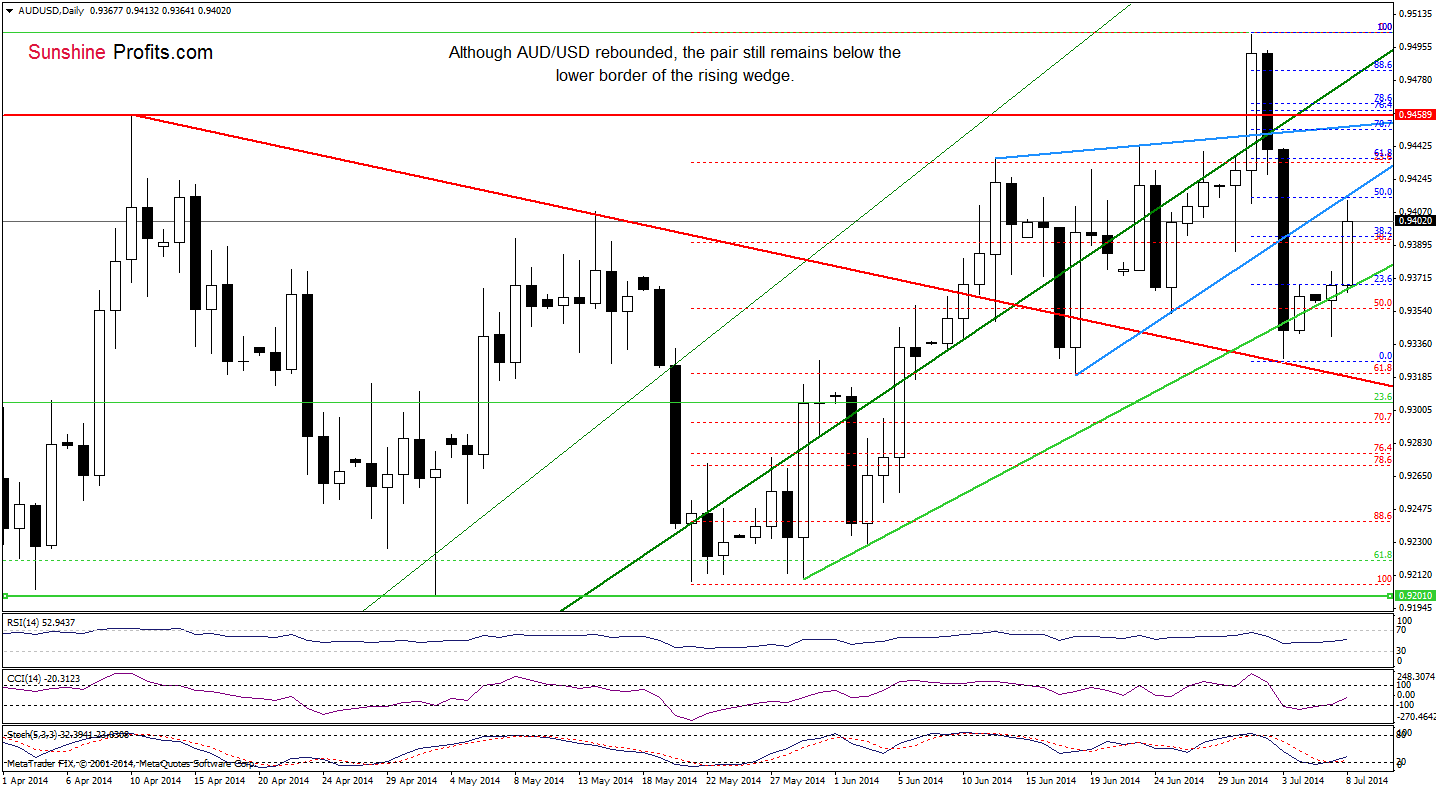
Earlier today, AUD/USD bounced off the green support line and climbed above the 38.2% Fibonacci retracement based on the recent decline. As a result, we noticed a sharp corrective upswing that took the exchange rate to the previously-broken lower border of the rising wedge. Despite this improvement, this resistance line in combination with the 50% Fibonacci retracement encouraged currency bears to act, which resulted in a pullback. If this resistance area holds, we’ll see further deterioration and a comeback to the green support line. However, taking into account the current position of the indicators, it seems to us that we’ll see another attempt to move higher. If this is the case and the pair breaks above the lower blue line, the next upside target will be around 0.9452, where the upper line of the formation intersects with the 70.7% Fibonacci retracement (based on the recent decline).
Very short-term outlook: mixed
Short-term outlook: mixed
MT outlook: bearish
LT outlook: bearish
Trading position (short-term): In our opinion, no positions are justified from the risk/reward perspective. We will keep you informed should anything change, or should we see a confirmation/invalidation of the above.
Thank you.
Nadia Simmons
Forex & Oil Trading Strategist
Przemyslaw Radomski, CFA
Founder, Editor-in-chief
Gold & Silver Trading Alerts
Forex Trading Alerts
Oil Investment Updates
Oil Trading Alerts

