
Although the Thomson Reuters/University of Michigan consumer sentiment index increased to 82.5 in June from 81.2 in May (beating expectations for a 82.2 reading), the U.S. dollar moved lower against major currency pairs as market participants bet that the Federal Reserve will keep interest rates low until 2015. Because of these circumstances, EUR/USD reached its important resistance, while USD/CAD dropped below the long-term support line. What impact did these fundamental factors have on other currency pairs and their outlook?
In our opinion the following forex trading positions are justified - summary:
EUR/USD
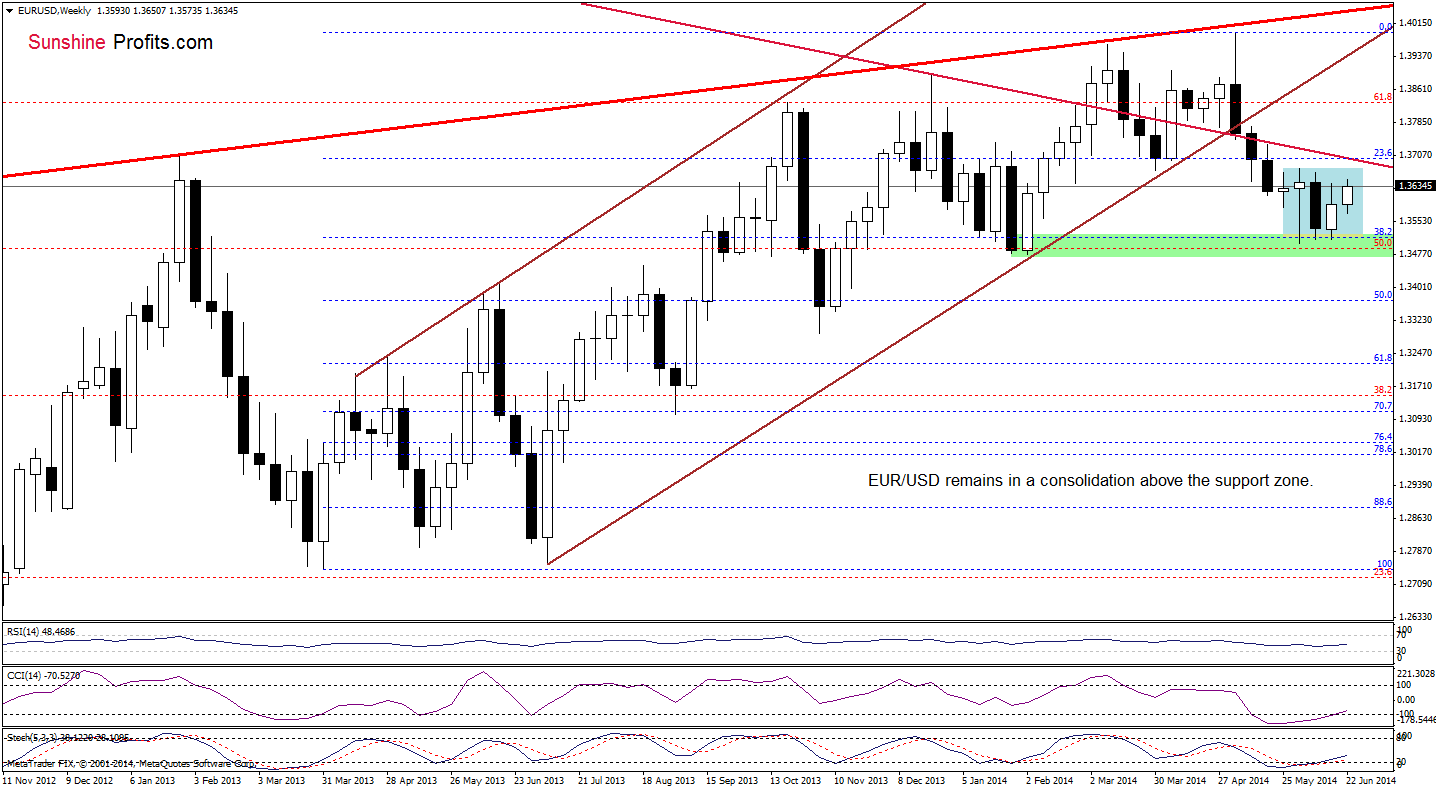
The situation in the medium term hasn’t changed much as EUR/USD is still trading in the consolidation between the support zone (created by the 38.2% Fibonacci retracement and last week’s low) and the June high, which is slightly below the long-term declining line at the moment. Nevertheless, we should keep in mind that the CCI and Stochastic Oscillator generated buy signals, which supports the bullish case at the moment.
What can we infer from the very short-term chart?
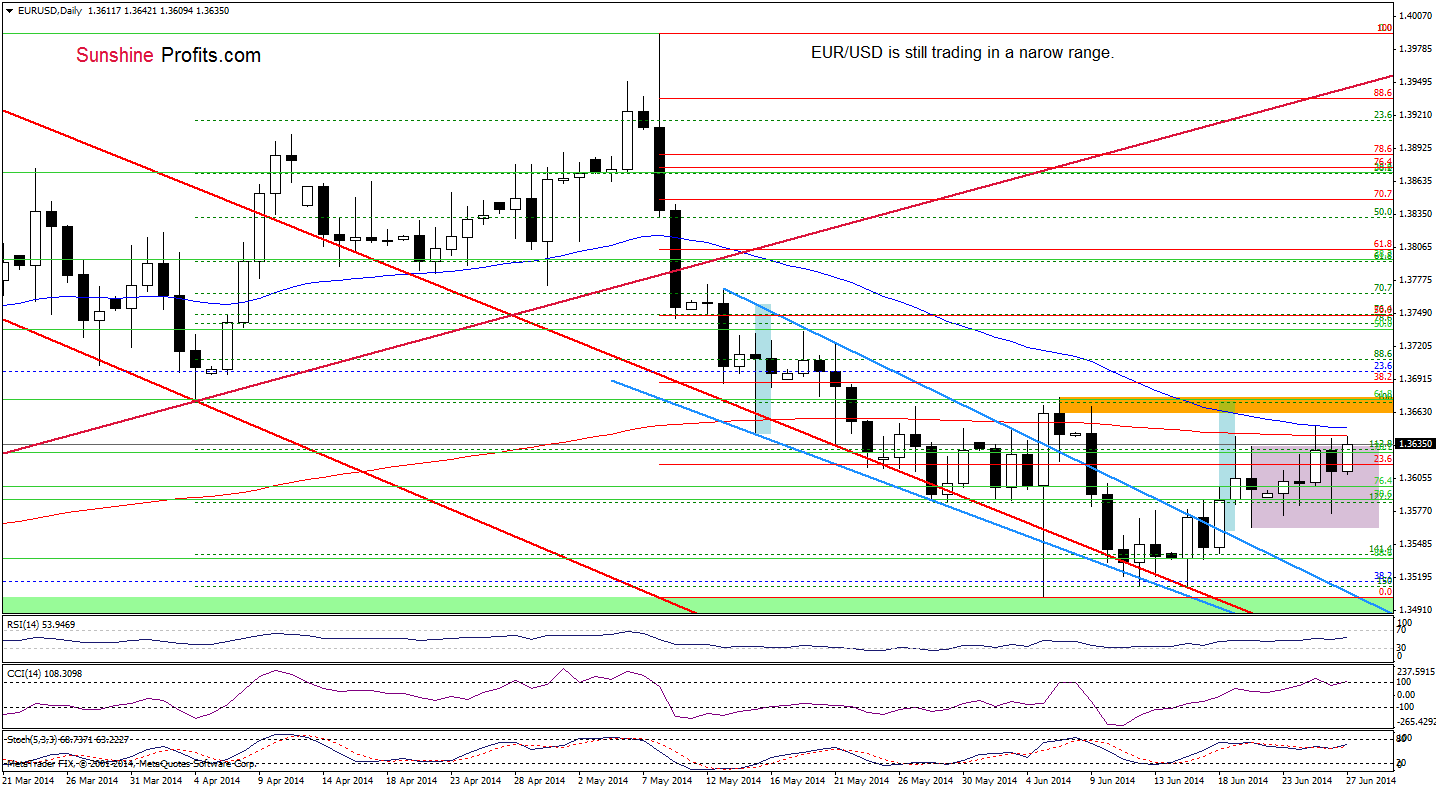
Yesterday, we wrote the following:
(…) even if the exchange rate moves higher once again, it seems to us that the strong resistance zone created by both moving averages will be strong enough to stop further gains in the nearest future.
As you see on the above chart, although EUR/USD rebounded and broke above the upper line of the consolidation, the exchange rate still remains below the 200- and 50-day moving averages. If they stop further increases (similarly to what we saw earlier this week), we’ll see a pullback from here and the initial downside target will be yesterday’s low of 1.3575. However, if this strong resistance zone is broken, we’ll likely see further improvement and an increase to (at least) around 1.3671, where the 38.2% Fibonacci retracement (based on the entire recent decline) is.
Very short-term outlook: mixed
Short-term outlook: bearish
MT outlook: bearish
LT outlook: bearish
Trading position (short-term; our opinion): In our opinion no positions are justified from the risk/reward perspective. We will keep you informed should anything change, or should we see a confirmation/invalidation of the above.
GBP/USD
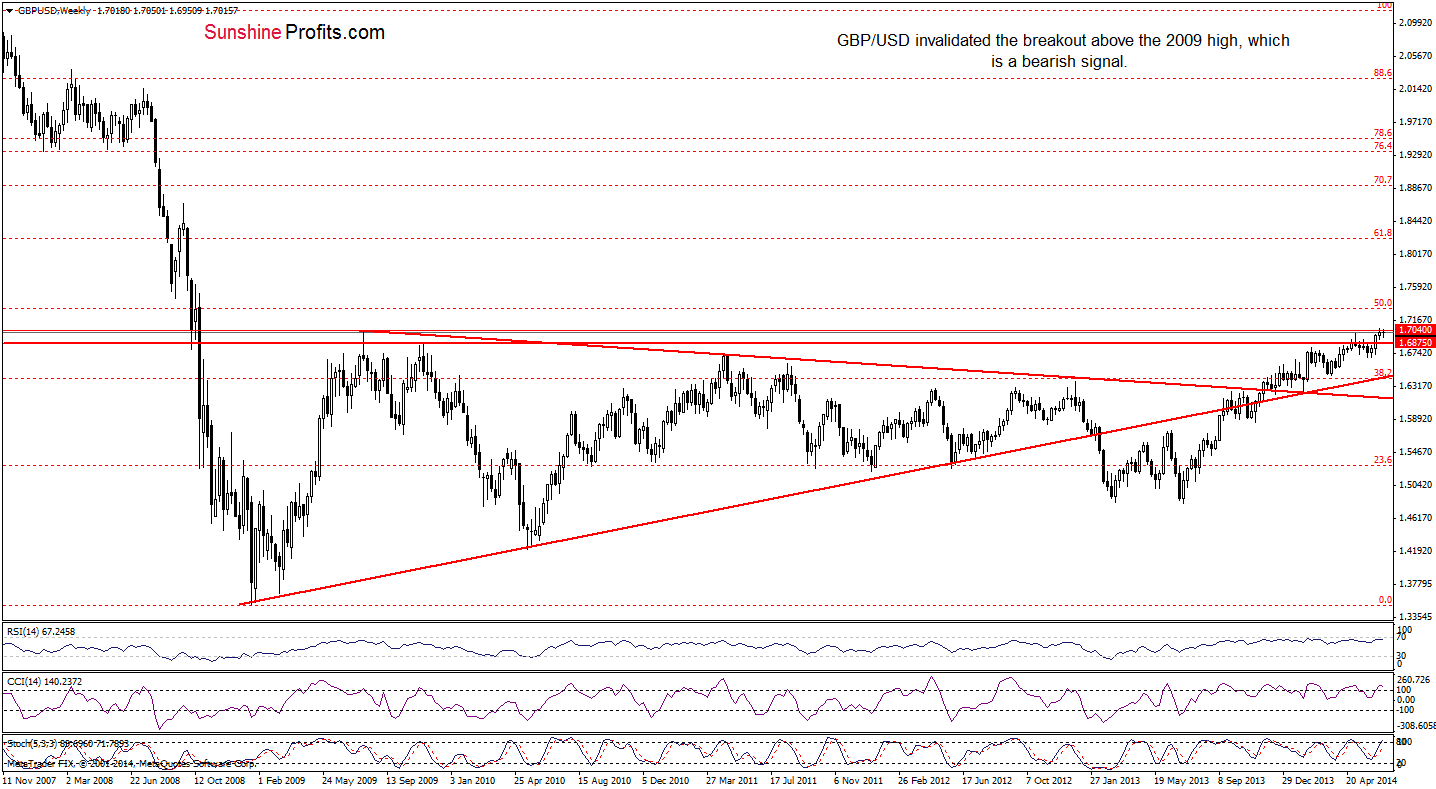
Looking at the above chart, we noticed that GBP/USD reversed and declined below the 2009 high, invalidating earlier breakout. Although this is a bearish signal, the pair is still trading between last week’s high and low. Therefore, we think that further deterioration will be more likely if the exchange rate drops below 1.6917 (last week’s low).
To have a more complete picture of this currency pair, let’s zoom in our picture and take a look at the daily chart.
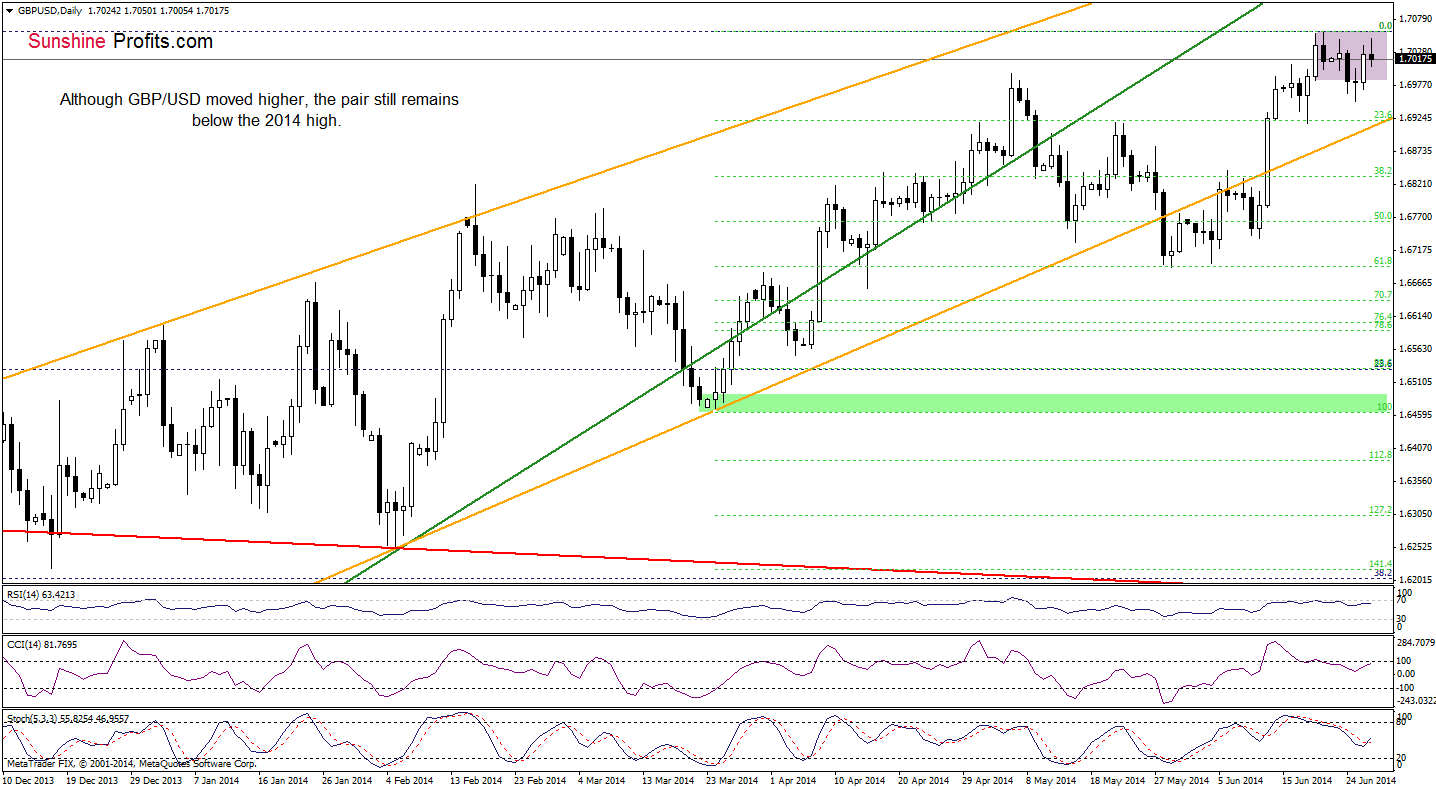
As you see on the above chart, GBP/USD reversed in the recent day and moved higher, invalidating the breakdown below the lower border of the consolidation (marked with purple). Although this is a positive signal, the pair still remains below the annual high and it seems to us that as long as there is no breakout above this resistance level, another attempt to move lower should not surprise us – especially when we factor in the current position of the indicators. Please note that if the exchange rate drops below Wednesday’s low, we will likely see a post double top decline. If this is the case, the initial downside target will be around 1.6909, where the medium-term support line is.
Very short-term outlook: bearish
Short-term outlook: bearish
MT outlook: bearish
LT outlook: mixed
Trading position (short-term): In our opinion, no positions are justified from the risk/reward perspective. We will keep you informed should anything change, or should we see a confirmation/invalidation of the above.
USD/JPY
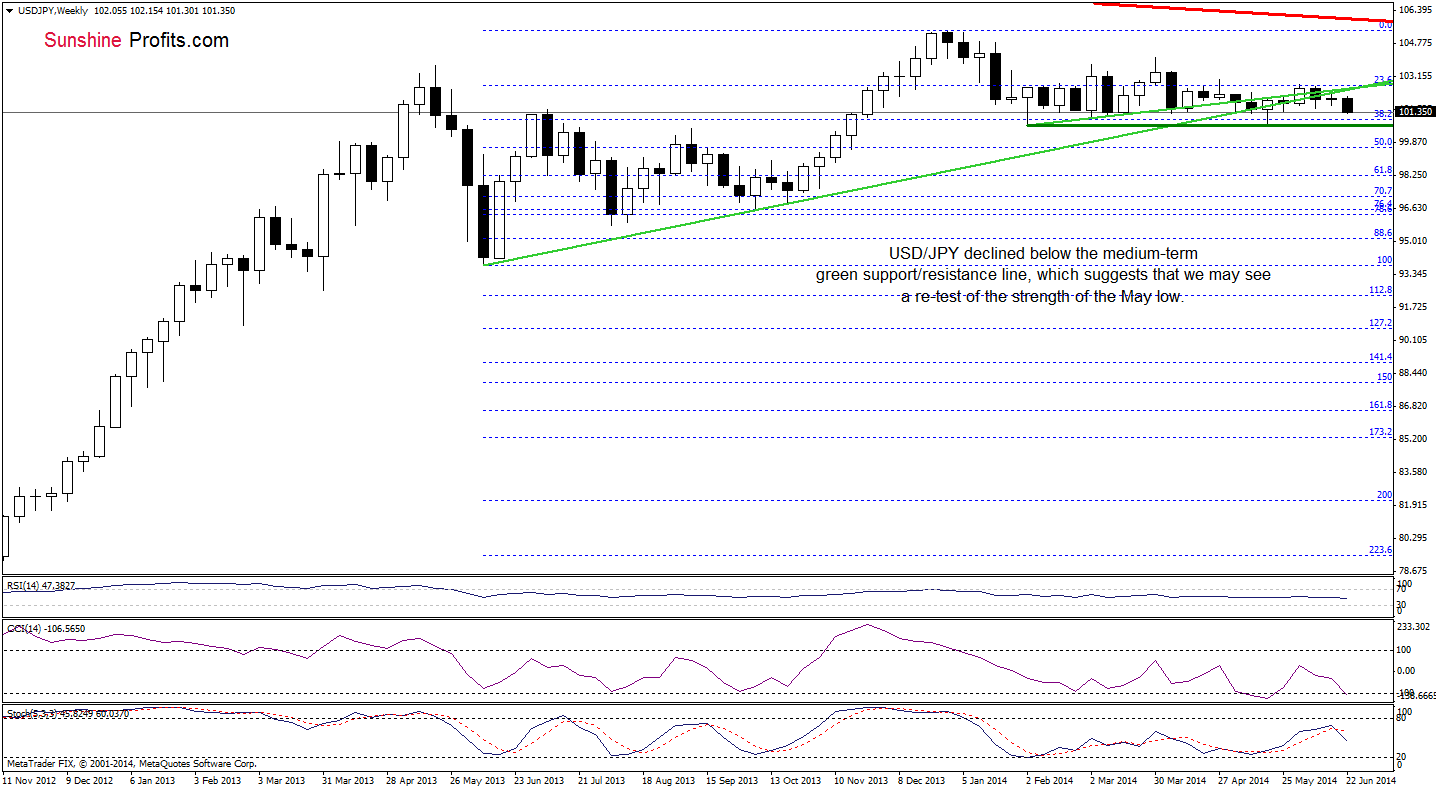
The situation on the weekly chart has deteriorated significantly as USD/JPY extended losses and moved away from the medium-term support/resistance line once again. With this downswing, the pair hit a fresh June low, which means that the next support will be the previously-broken 38.2% Fibonacci retracement and the May low of 100.81. If this support area holds, we’ll see a rebound and another attempt to break above the medium-term green line (which correspond to the short-term resistance line at the moment). However, if currency bulls fail, the exchange rate may drop even to 99.58, where the 50% Fibonacci retracement is.
Will the short-term picture give us any interesting clues about future moves? Let’s check.
A week ago, we wrote the following:
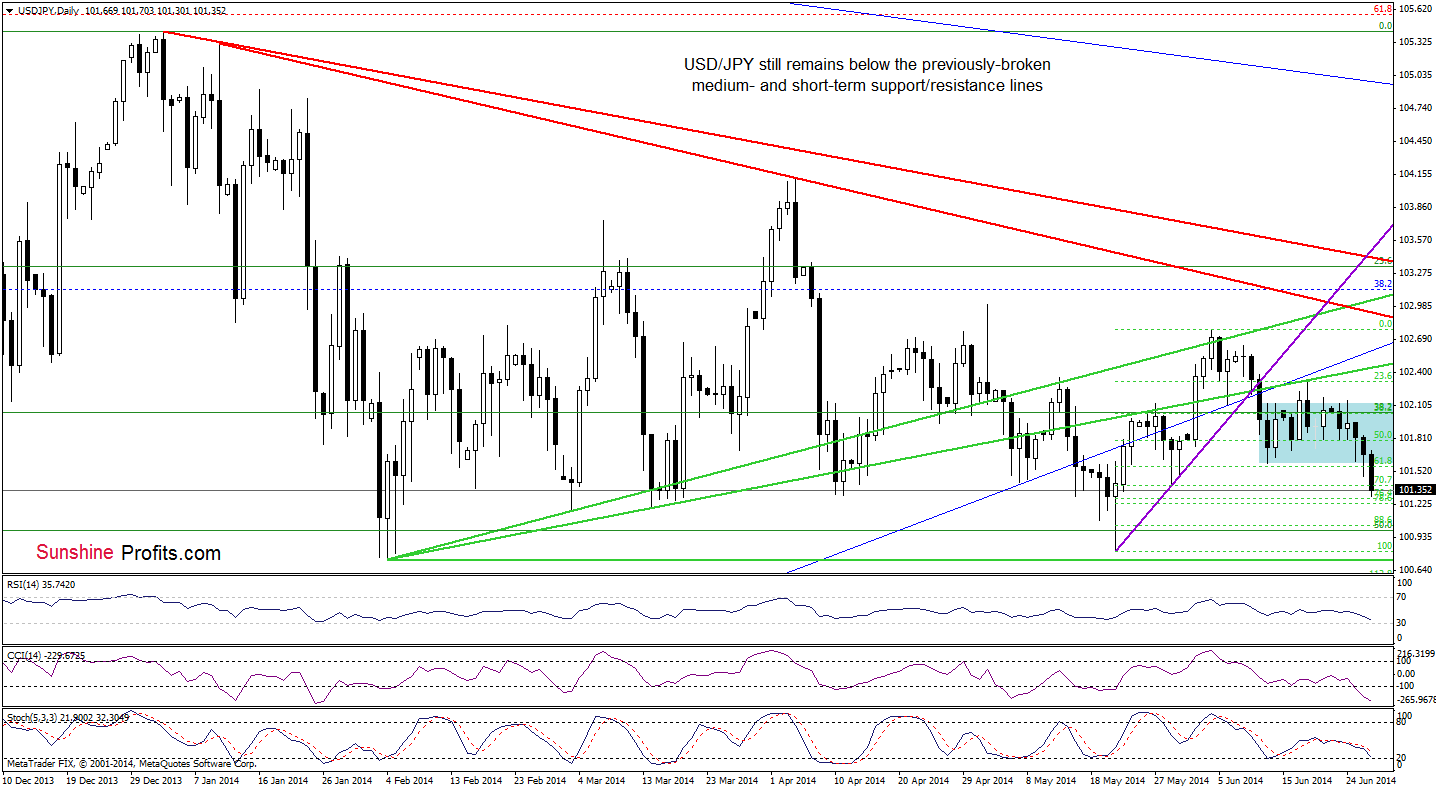
(…) Although the pair moved little higher, it still remains below major resistance lines. (…) we should keep in mind that if currency bulls fail once again and the pair declines below the 61.8% retracement, we’ll see further deterioration and a drop to the May 29 low (or even to the May low of 100.81).
As you can see on the above chart, the situation developed exactly as we expected it to. Earlier today, USD/JPY extended declines and dropped below the lower border of the consolidation, which triggered a sharp decline, which took the exchange rate to its first downside target. With this downswing, the pair reached a support zone created by the 76.4% and 78.6% Fibonacci retracement levels based on the recent rally. If it withstand the selling pressure, we’ll see a corrective upswing to the lower line of the consolidation at 101.59. However, if it is broken, the next target for currency bears will be the May low.
Very short-term outlook: mixed with bearish bias
Short-term outlook: mixed
MT outlook: mixed
LT outlook: bearish
Trading position (short-term): In our opinion no positions are justified from the risk/reward perspective at the moment. We will keep you informed should anything change, or should we see a confirmation/invalidation of the above.
USD/CAD
Quoting our yesterday’s Forex Trading Alert:
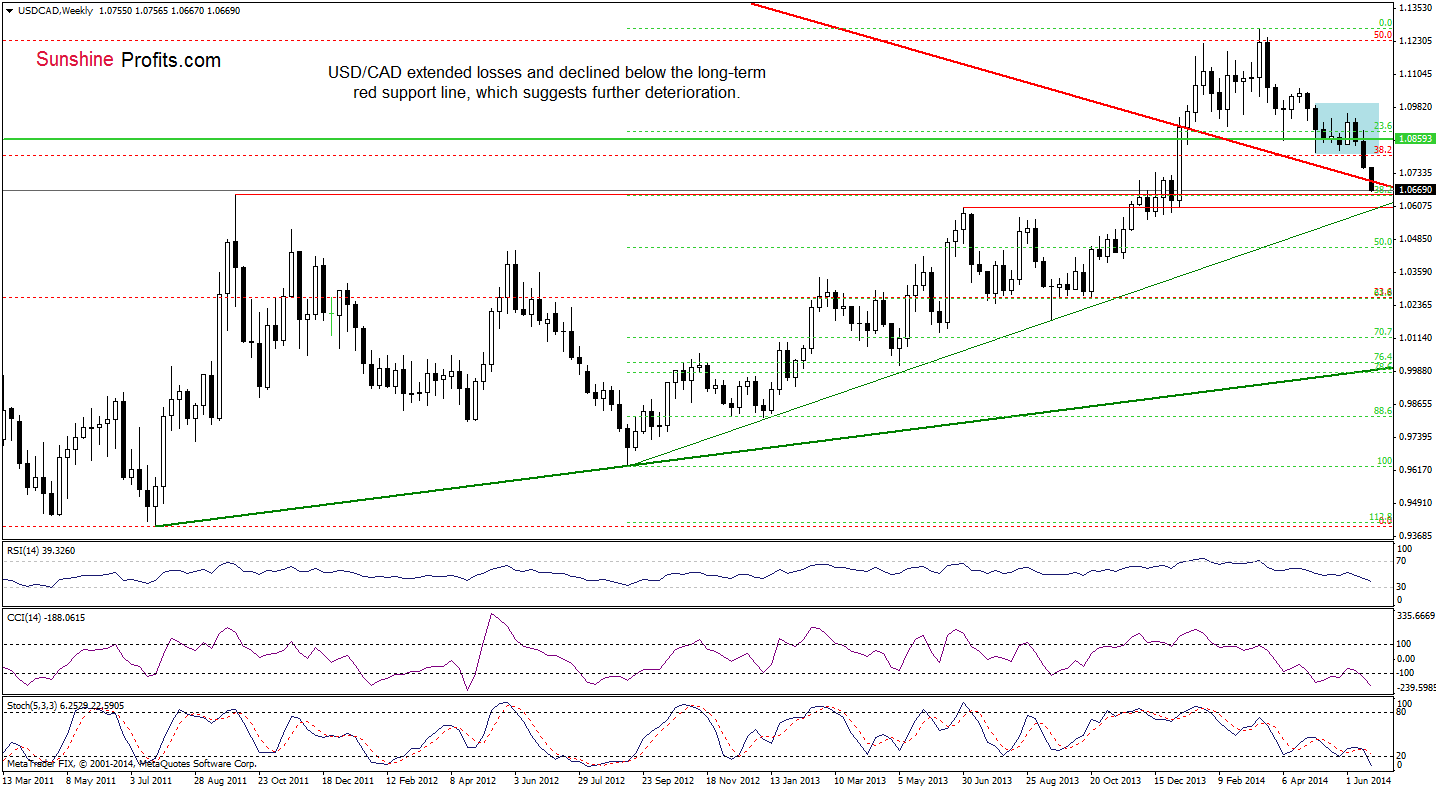
(…) if the major support is broken, we may see further deterioration and a drop to around 1.0645 where the 38.2% Fibonacci retracement is.
As you see on the above chart, earlier today USD/CAD broke below the long-term declining line, which triggered a sharp pullback that took the pair to slightly above its downside target. Taking into account the current position of the indicators (sell signals are still in play), it seems to us that the exchange rate will reach the 38.2% Fibonacci retracement in the nearest future. If it encourage forex traders to push the buy button, we’ll see a corrective upswing and a try to come back above the red support/resistance line (currently around 1.0696). However, if it’s broken the next downside target will be around 1.0597, where the support line based on the June 2013 high intersects with the long-term green support line (please note that this area is also supported by December lows).
Having discussed the above, let’s move on to the daily chart.
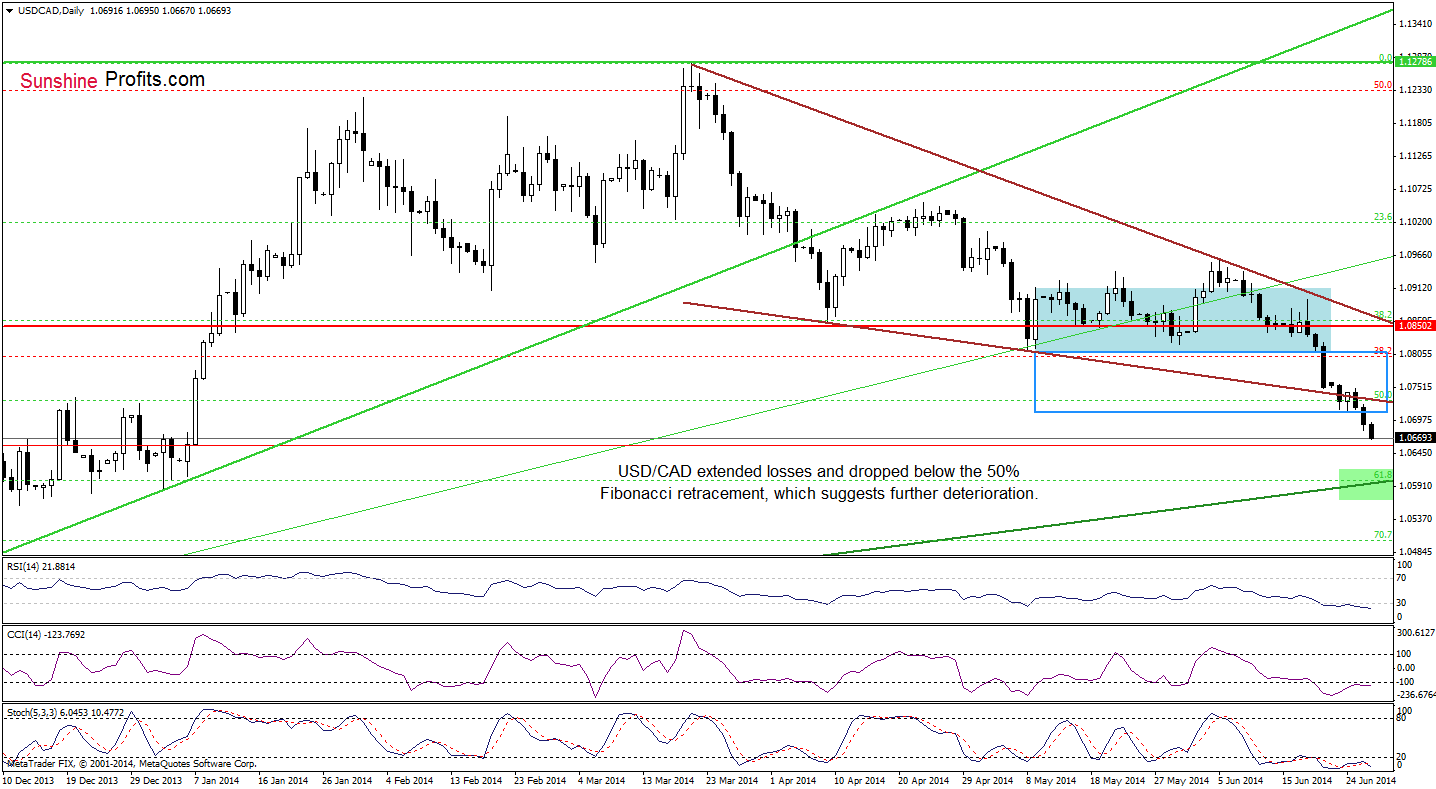
Looking at the above chart, we see that USD/CAD extended losses below the lower border of the declining wedge. Therefore, what we wrote yesterday is up-to date:
(…) the exchange rate reached its downside target, declining to 1.0710, where the size of the downswing corresponds to the height of the consolidation. (…) if this area is broken, the next downside target will be around 1.0600, where the 61.8% Fibonacci retracement (based on the Sept.-March rally) is.
Very short-term outlook: bearish
Short-term outlook: bearish
MT outlook: mixed
LT outlook: bearish
Trading position (short-term): In our opinion no positions are justified from the risk/reward perspective as the space for further declines may be limited. We will keep you informed should anything change, or should we see a confirmation/invalidation of the above.
USD/CHF
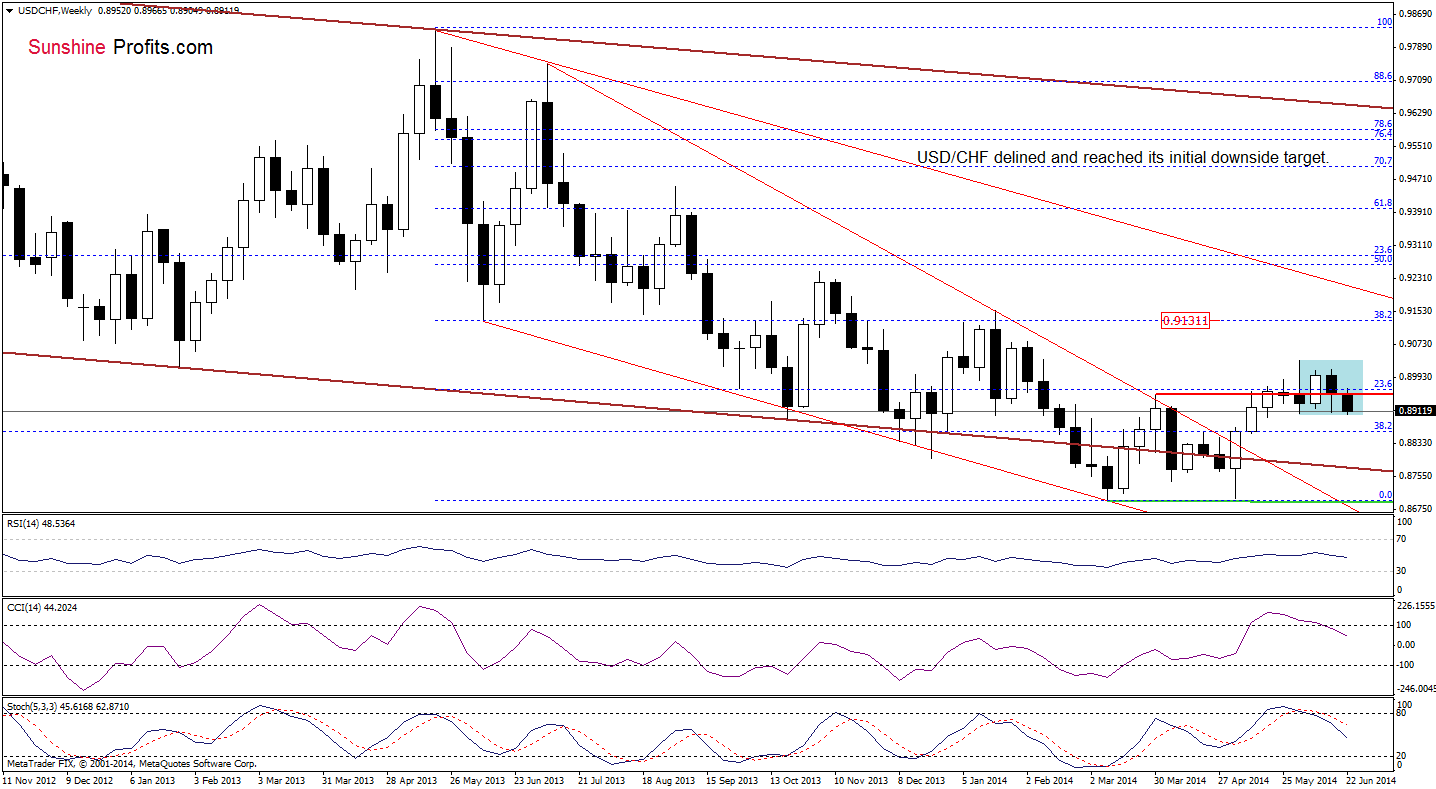
From this prspective, we see that the situation in the medium term has deteriorated as USD/CHF moved lower and declined not only below the 23.6% Fibonacci retracement, but also under the April high. Taking this fact into account, we think that our last commentary on this currency pair is still valid:
(…) the CCI and Stochastic Oscillator generated sell signals, which suggests that we’ll see another attempt to move lower in the coming week. Please note that if the pair drops below the lower border of the consolidation, the initial downside targert, will be around 0.8780, where the lower line of the declining trend channel (marked with brown) is.
What can we infer from the short-term picture?
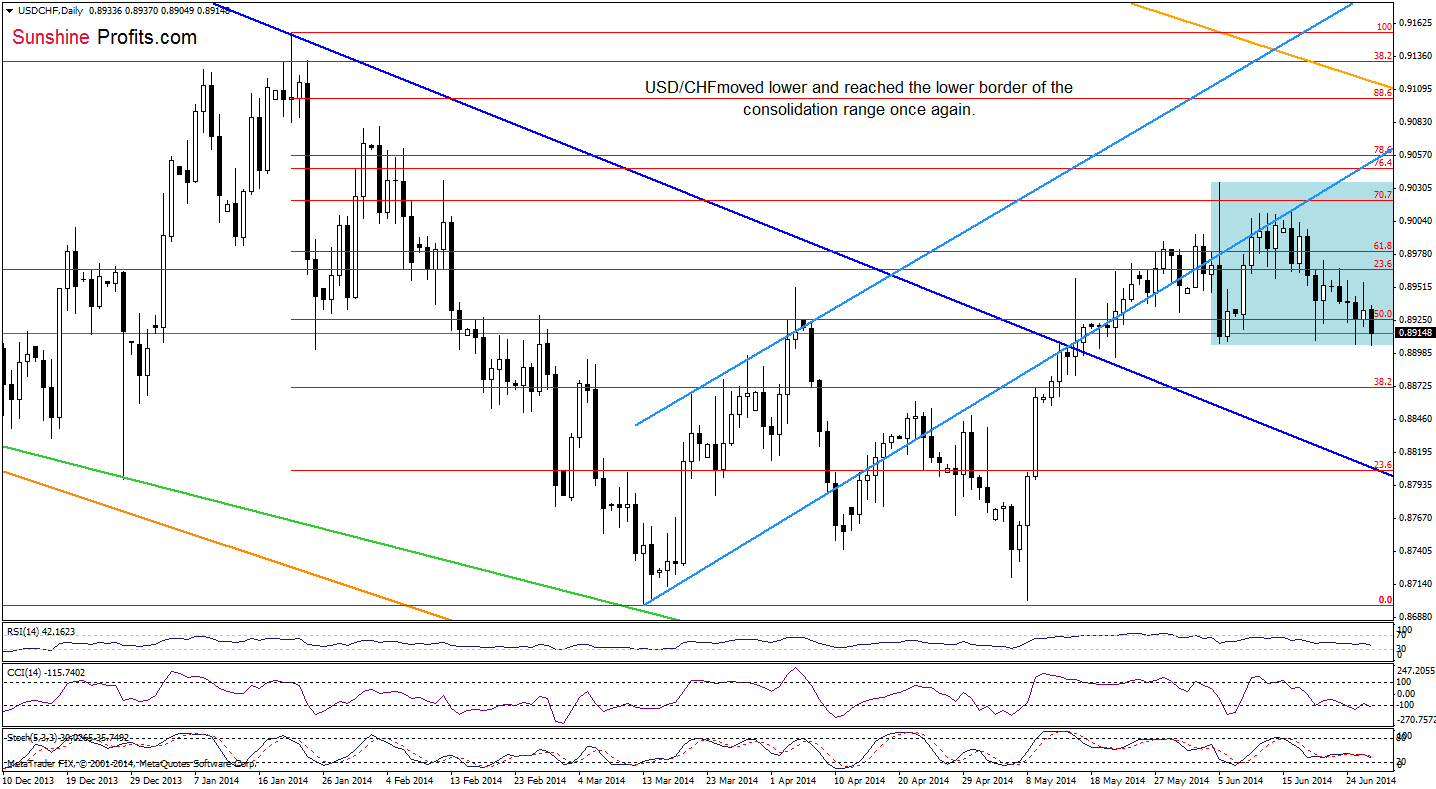
From today’s point of view, we see that the situation hasn’t hanged much as USD/CHF still remains above the lower border of the consolidation. If it holds, we may see a post double bottom rally and an increase to around 0.9011 (June 16 high). Nevertheless, we should keep in mind that even if we see such price action, the exchange rate will be still trading below the previously-broken blue resistance line. Therefore, we think that as long as there is no breakout above this line or a breakdown below 0.8907, another sizable move is not likely.
Very short-term outlook: mixed
Short-term outlook: mixed
MT outlook: mixed with bullish bias
LT outlook: bearish
Trading position (short-term): In our opinion no positions are justified from the risk/reward perspective. We will keep you informed should anything change, or should we see a confirmation/invalidation of the above.
AUD/USD
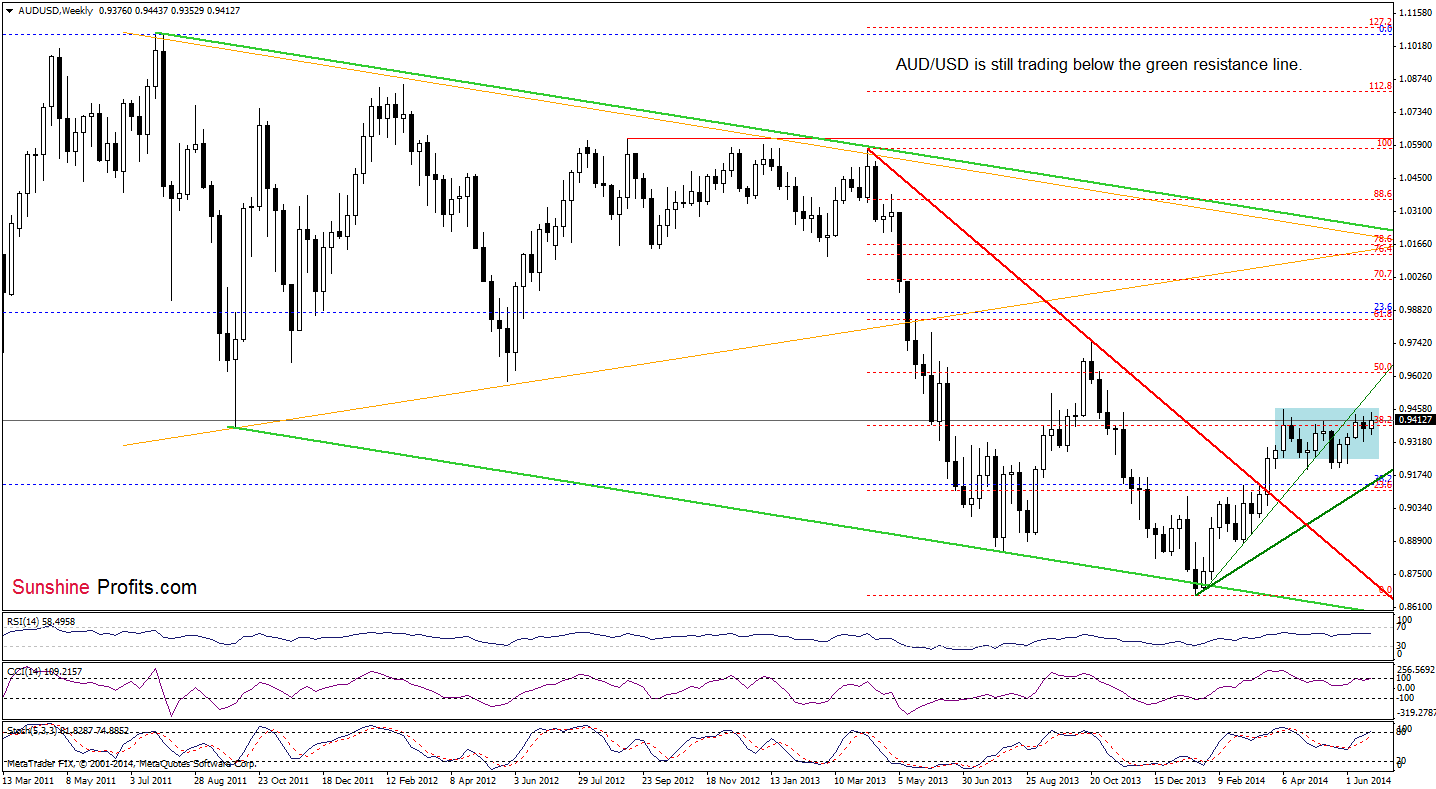
Although AUD/USD moved higher this week, the exchange rate still remains in the consolidation below the 2014 high and the medium-term green resistance. If the proximity to the upper border of the formation encourage currency bears to act, we’ll see a pullback from here – similarly to what we noticed in mid-April. However, if this resistance is broken, the initial upside target will be around 0.9523, where the major resistance line is.
Once we know the above, let’s focus on the very short-term changes.
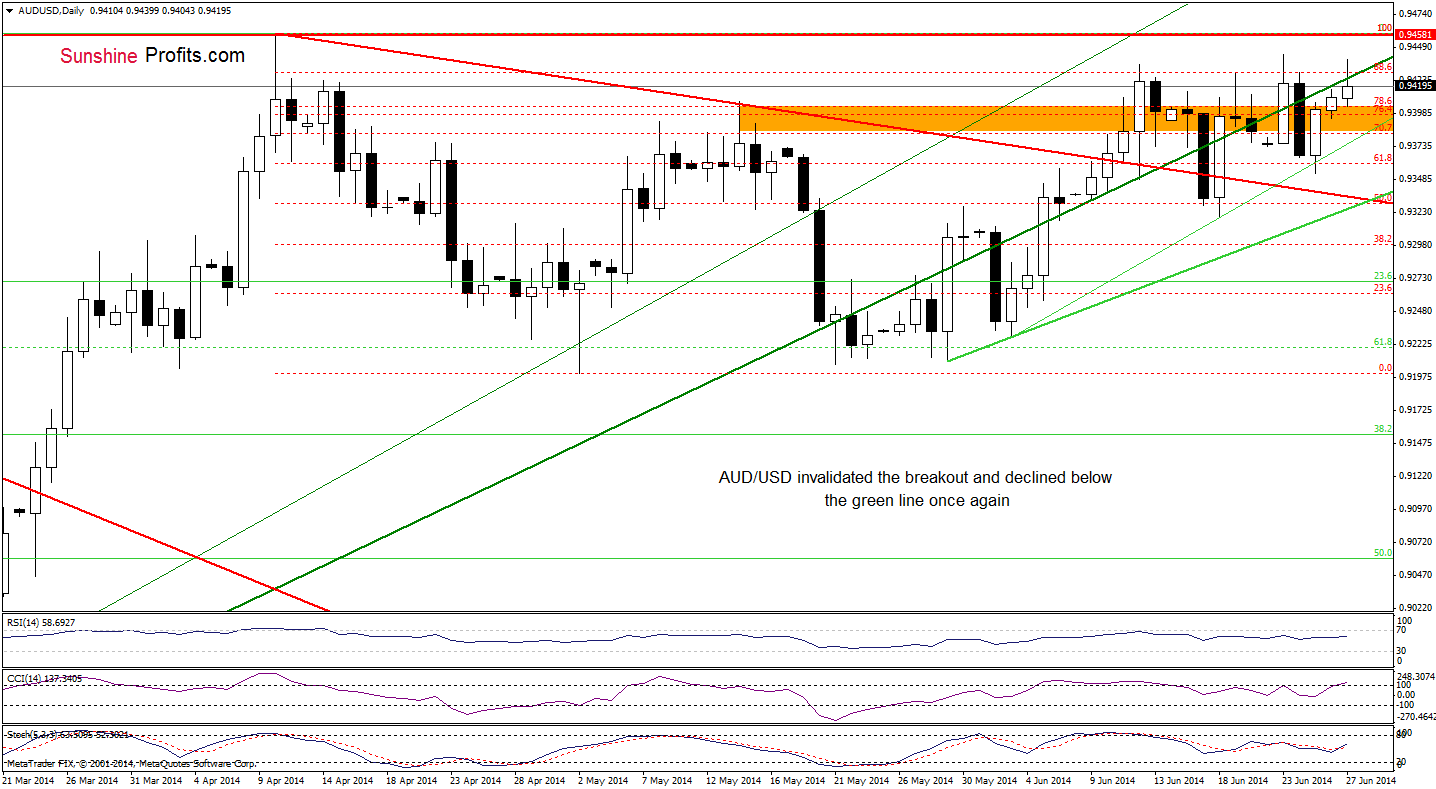
Looking at the daily chart, we see that although AUD/USD moved higher and broke (very temporarily) above the medium-term resistance line, currency bulls didn’t manage to hold gained levels, which triggered a downswing. With this move, the pair invalidated earlier breakout (similarly to what we noticed at the beginning of the week and also earlier this month), which is a bearish signal. Therefore, it seems to us that if the major support/resistance holds, we’ll see a downward move to the support line based on the June 3 and June 18 lows.
Very short-term outlook: mixed with bearish bias
Short-term outlook: mixed
MT outlook: bearish
LT outlook: bearish
Trading position (short-term): In our opinion, no positions are justified from the risk/reward perspective. We will keep you informed should anything change, or should we see a confirmation/invalidation of the above.
Thank you.
Nadia Simmons
Forex & Oil Trading Strategist
Przemyslaw Radomski, CFA
Founder, Editor-in-chief
Gold & Silver Trading Alerts
Forex Trading Alerts
Oil Investment Updates
Oil Trading Alerts

