
Earlier today, the U.S. dollar moved lower against its Canadian and Australian counterparts after official data showed that the U.S. trade deficit narrowed to $40.38 billion in March, from $41.87 billion in February, missing analysts expectations. In reaction to this news AUD/USD and USD/CAD moved sharply and approached their important levels. Did these circumstances change the outlook for both currency pairs?
In our opinion the following forex trading positions are justified - summary:
- EUR/USD: none
- GBP/USD: none
- USD/JPY: none
- USD/CAD: none
- USD/CHF: none
- AUD/USD: short (stop-loss order: 0.9410; initial price target: 0.9060)
USD/CAD
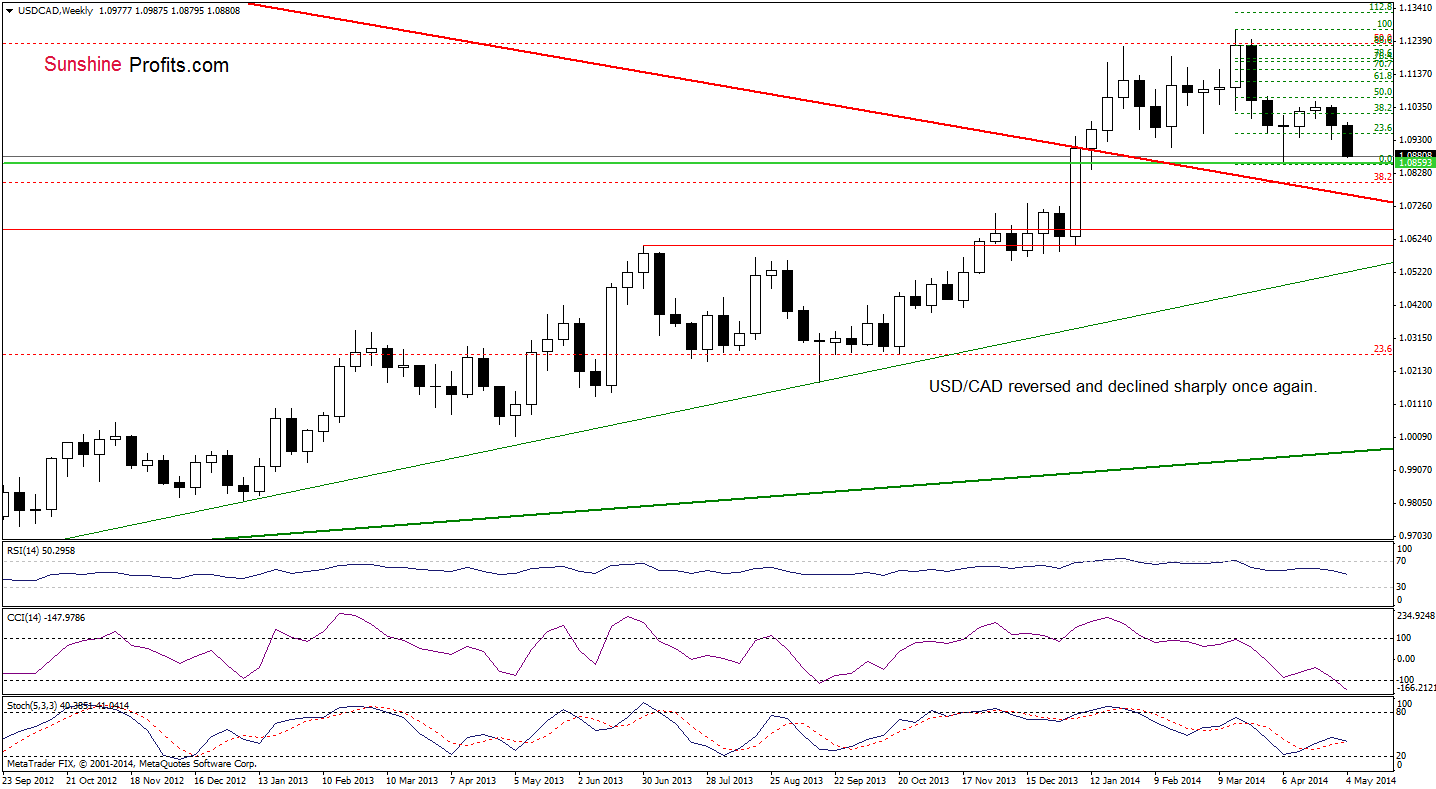
In our Forex Trading Alert posted last Tuesday, we wrote the following:
(…) the pair moved below the previously-broken 38.2% Fibonacci retracement, and it seems that the initial target for the sellers (at least from this perspective) will be around 1.0941. If this support is broken, we may see a drop to around 1.0857, where the April low is.
As you see on the above chart, USD/CAD declined below its initial target, which means that we will see the test of the strength of the previous month low in the very near future (in our opinion, such price action is likely to be seen today or tomorrow). If this support level holds, the exchange rate may rebound and we’ll see a corrective upswing. However, if it is broken, it seems quite likely that USD/CAD will decline to the long-term declining support line based on the Sept.2002 and March 2009 highs (marked with red) – currently around 1.0770. Looking at the position of the indicators, we see that they support the bearish case at moment, which suggests that a fresh 2014 low is just around the corner.
Let’s move on to the daily chart.
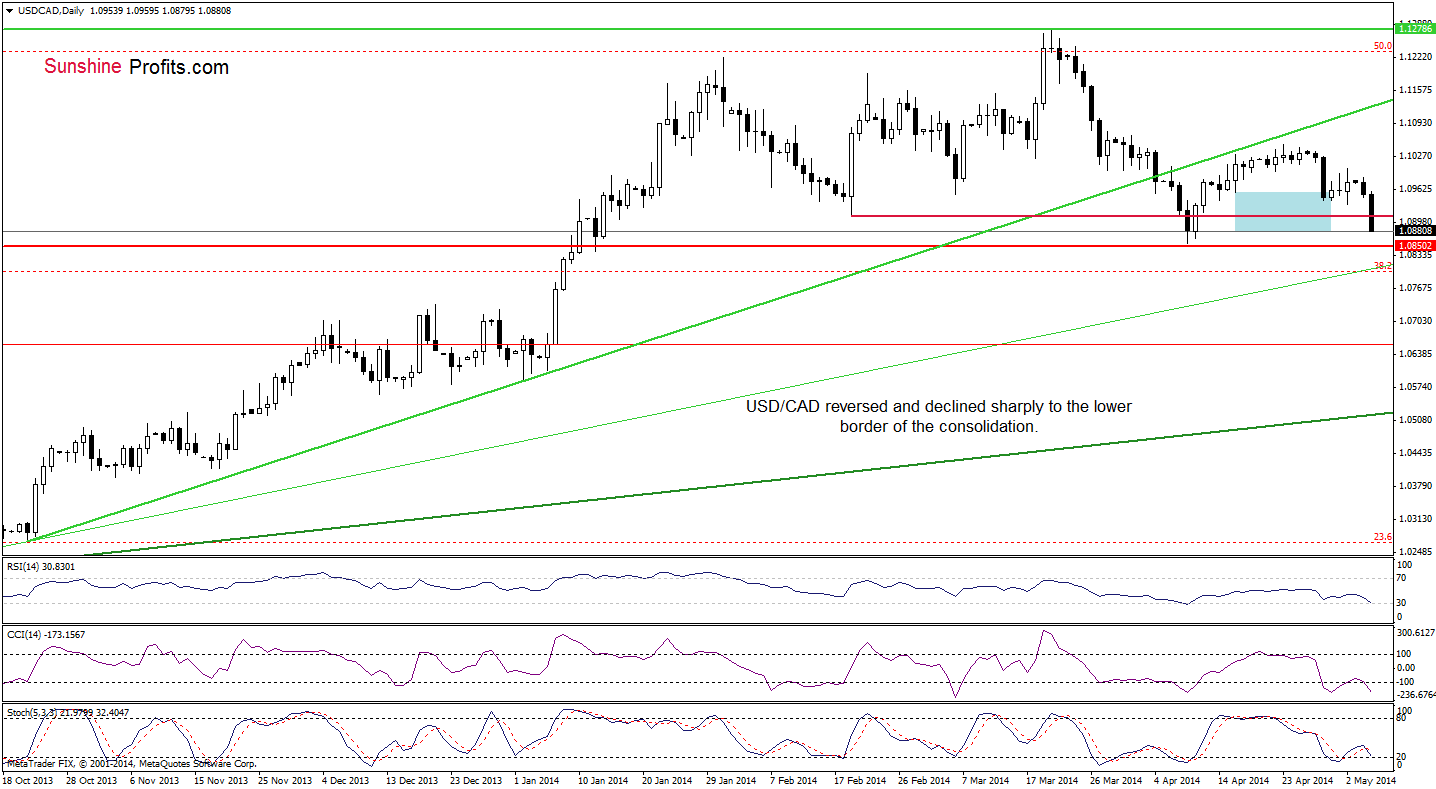
Quoting our Forex Trading Alert posted on Apr.29:
(…) we will likely see a pullback to around 1.0982 (the April 17 low) or even to 1.0958, where the lower border of the consolidation is. (…) forex traders pushed the sell button and approached the downside target (…) as USD/CAD hit an intraday low of 1.0962. If the proximity to the support level encourages buyers to act, we may see a corrective upswing in the coming day (or days). However, if (…) the pair declines below the lower border of the consolidation, we may see a correction even to around 1.0882 (in this area the size of the downswing will correspond to the height of the consolidation range).
From the daily perspective, we see that the pair declined sharply and reached the above-mentioned downside target earlier today. Although these circumstances may reduce the selling pressure, it seems to us that the exchange rate will likely move lower once again and (as mentioned earlier) test the strength of the April low. At this point, it’s worth noting that this scenario is currently reinforced by the position of the daily indicators. However, the CCI is already oversold, while the RSI reached the level of 30, which suggests that the space for further declines may be limited. In our opinion, if the nearest support level doesn’t trigger a corrective upswing and the pair breaks below it, we will likely see a drop to the rising medium-term support line based on the Sept. and Oct. lows (currently around 1.0808).
Very short-term outlook: bearish
Short-term outlook: bearish
MT outlook: bullish
LT outlook: bearish
Trading position (short-term): In our opinion no positions are justified from the risk/reward perspective as the space for further declines may be limited. We will keep you informed should anything change, or should we see a confirmation/invalidation of the above.
AUD/USD
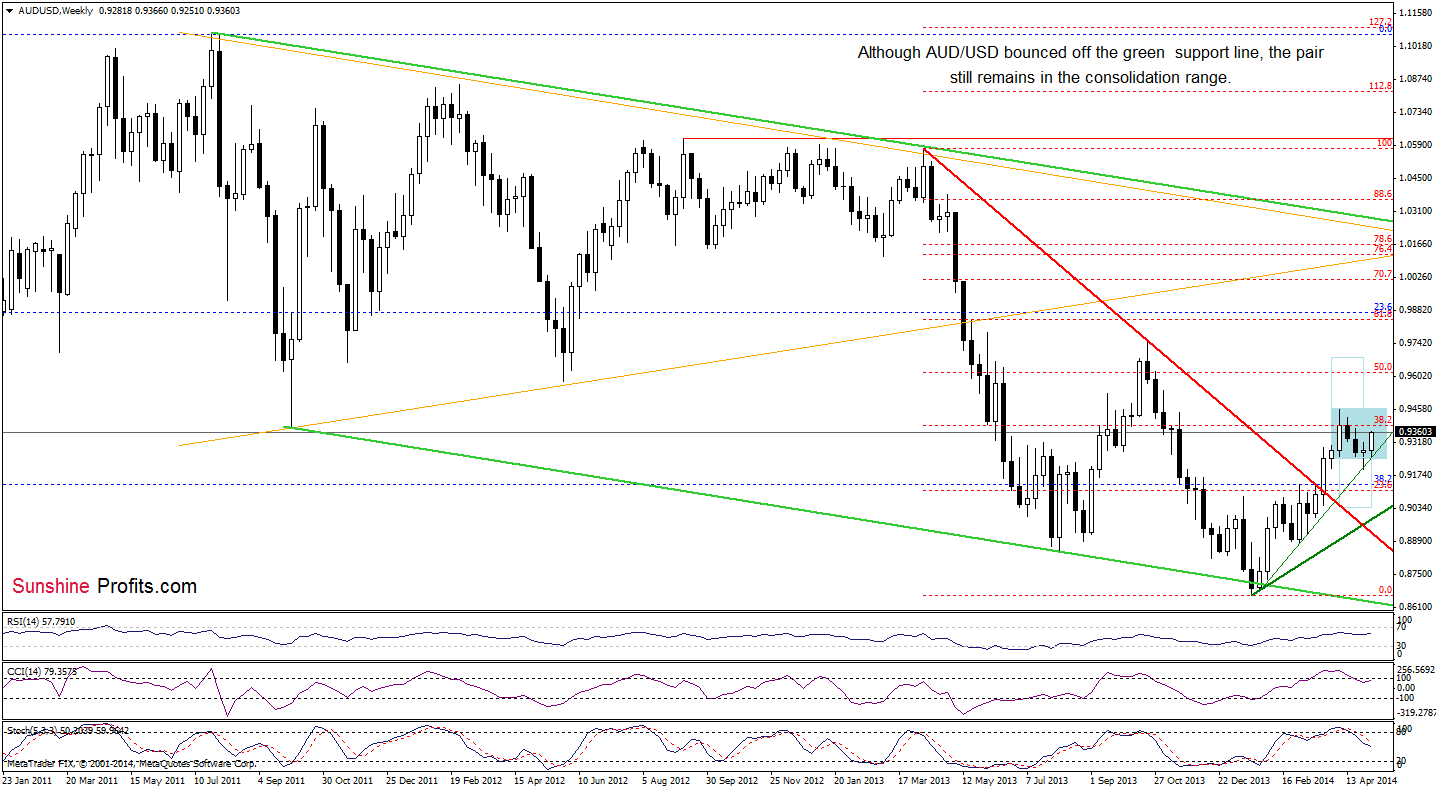
On the weekly chart, we see that although AUD/USD bounced off the upper green line and extended gains, the overall situation hasn’t changed much as the exchange rate remain in the consolidation range. Please note that sell signals generated by the CCI and Stochastic Oscillator remain in place, which suggests that another attempt to move lower can’t be ruled out.
Once we know the medium-term situation, let’s move on to the daily chart.
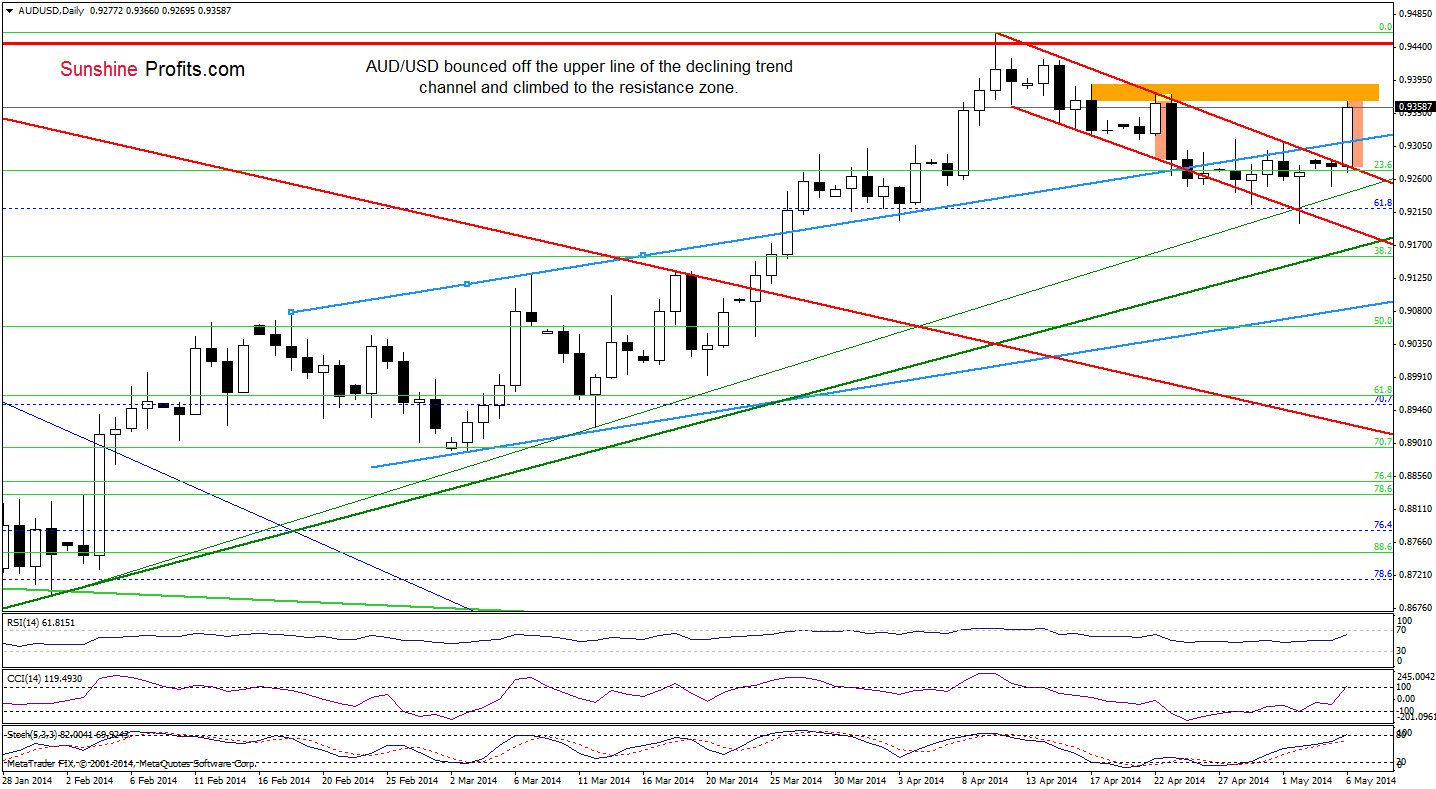
Looking at the daily chart, we see that the situation has improved as AUD/USD broke above the upper line of the declining trend channel earlier today. This bullish signal triggered further improvement in the following hours, which resulted in an upward move to the resistance zone created by the Apr. 17 and Apr. 22 highs. At this point, it’s worth noting that the size of today’s rally corresponds to the height of the trend channel, which suggests that day traders will likely close their position in this area. If this is the case, such price action will likely result in a pullback – especially when we factor in the proximity to the resistance zone.
The AUD/USD pair moved sharply higher today and that's clearly a consequence of US Dollar's weakness - other USD-related pairs have also moved based on it. However, the USD Index itself moved to a major support level - the 2013 low and is basically right at it at the moment of writing these words. It's also at its cyclical turning point. If the USD Index is to reverse shortly, and it still seems likely, then the AUD/USD pair is likely to be impacted in a significant way, as the Australian currency has already been acting weak relative to the US Dollar. Please note that the USD Index is at its 2013 low and at the same time the AUD/USD pair is far from its 2013 high (even if we take the October 2013 high into account). That's why we think that the short position in the AUD/USD pair remains justified from the risk/reward perspective. Please note that the stop-loss level for the current position is relatively close, so of the USD Index broke below its 2013 low and the situation changed significantly, this order would shortly take you out of this trade. For now, it seems that the AUD/USD pair will move lower in the coming weeks.
Very short-term outlook: bearish
Short-term outlook: bearish
MT outlook: bearish
LT outlook: bearish
Trading position (short-term): Short. Stop-loss order: 0.9410 and initial price target: the lower border of the blue rising trend channel (currently at 0.9060). We will keep you informed should anything change, or should we see a confirmation/invalidation of the above.
Thank you.
Nadia Simmons
Forex & Oil Trading Strategist
Przemyslaw Radomski, CFA
Founder, Editor-in-chief
Gold & Silver Trading Alerts
Forex Trading Alerts
Oil Investment Updates
Oil Trading Alerts

