
Earlier today, the British pound rebounded sharply after data showed that the U.K. unemployment rate drop to a five year low of 6.9% in the three months to February. In reaction to this, GBP/USD almost touched a 4-year high. Will we see further rally or rather a triple top?
In our opinion the following forex trading positions are justified - summary:
- EUR/USD: none
- GBP/USD: short (stop-loss order: 1.6855)
- USD/JPY: none
- USD/CAD: none
- USD/CHF: none
- AUD/USD: none
EUR/USD
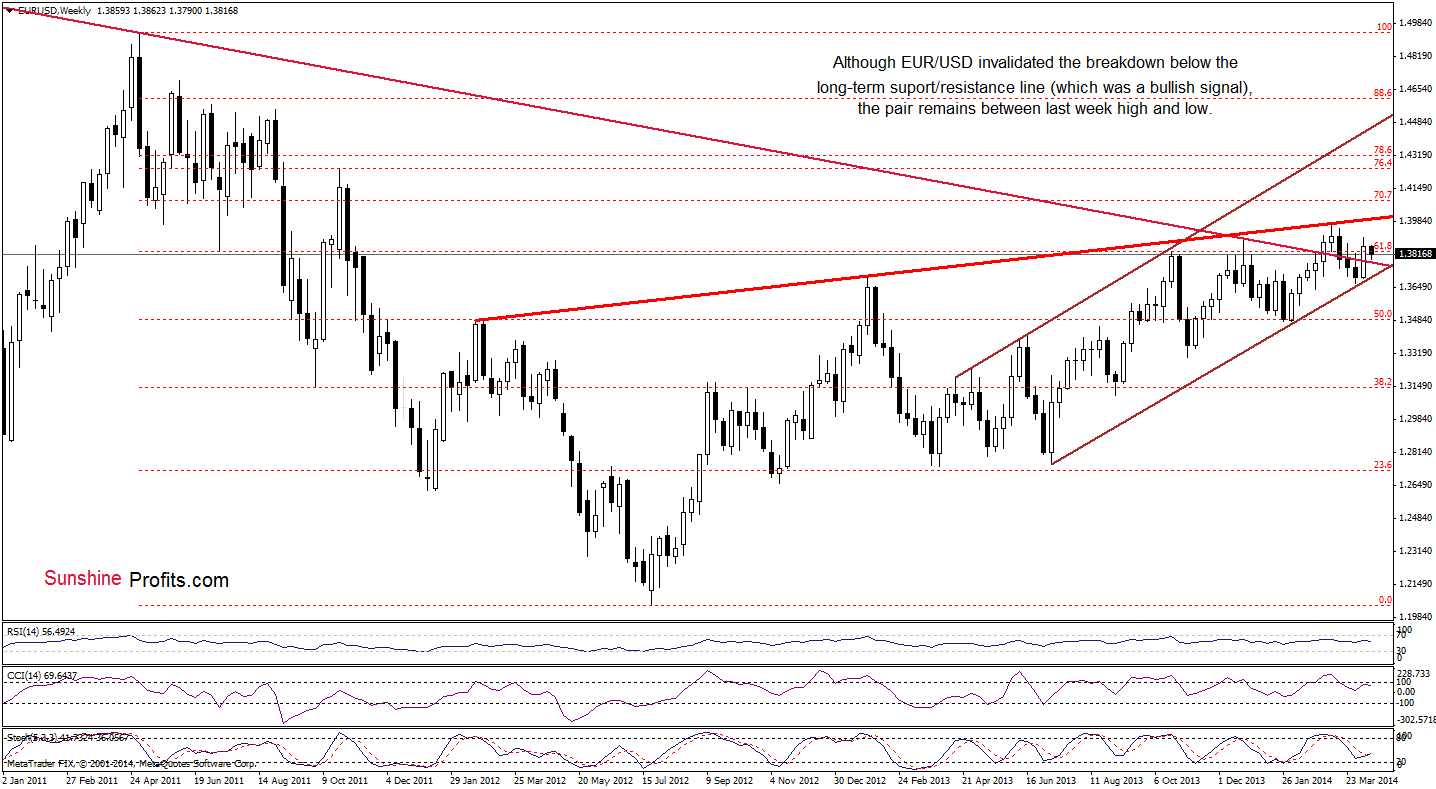
From the weekly perspective, we see that the situation hasn’t changed much. Therefore, what we wrote in our previous Forex Trading Alert is still up-to-date.
(…) EUR/USD still remains above the previously-broken long-term declining resistance line and the lower border of the rising trend channel (marked with brown). (…) These two important lines still serve as major support. As you see on the above chart, the exchnge rate remains below the 2014 high and the rising resistance line (marked with red), which succesfully stopped growth in the previous month. From this perspective, it seems that as long as these key lines are in play, a bigger upward or downward move is not likely to be seen.
Once we know the above, let’s take a look at the daily chart.
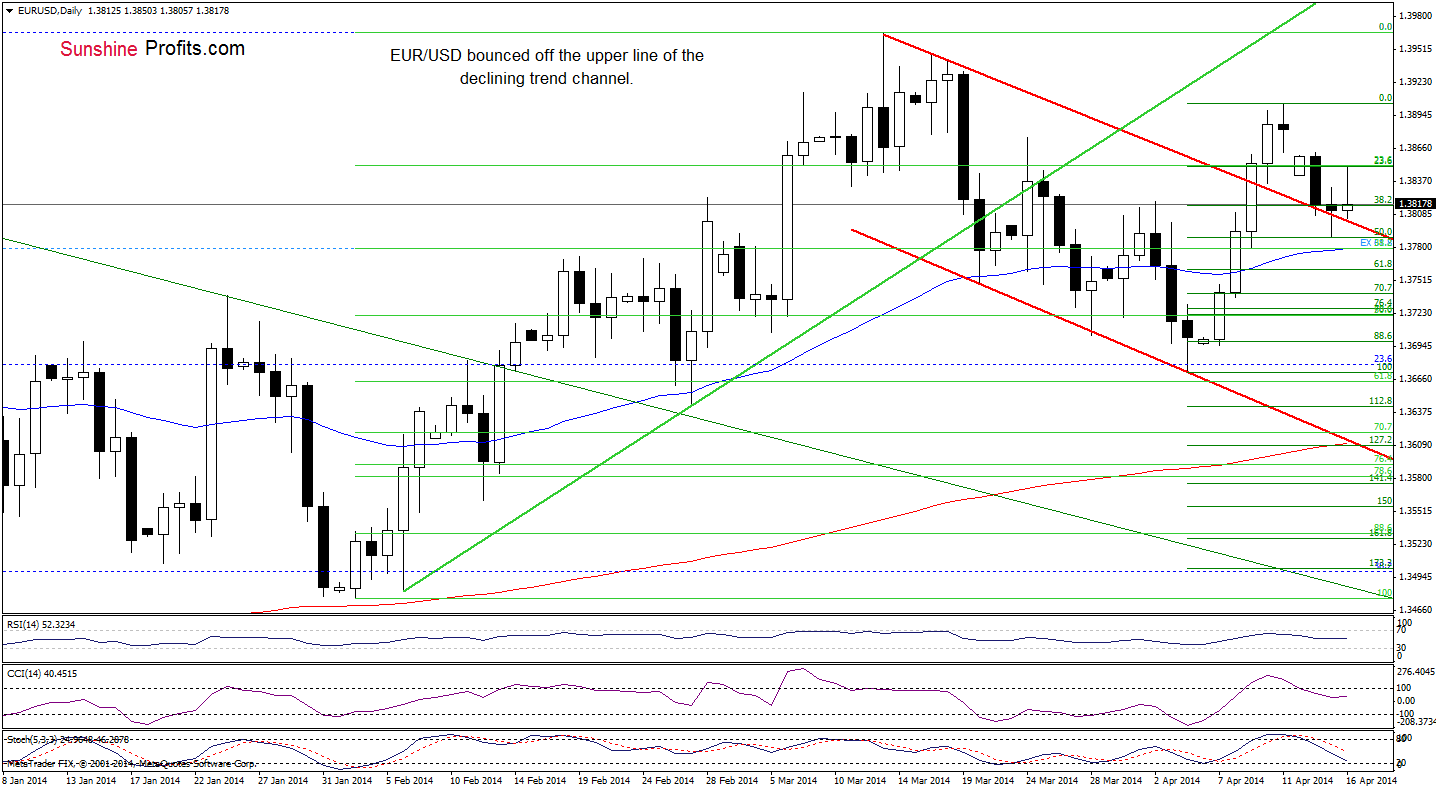
Quoting our previous Forex Trading Alert:
(…) EUR/USD (…) reached the 50% Fibonacci retracement level (based on the recent rally) earlier today. Although this support level encouraged buyers to act (which resulted in a corrective upswing), the pair still remains quite close to this important line. If it holds, we may see another corrective upswing in the near future.
Earlier today, we noticed such price action as the exchange rate rebounded and erased 50% of the recent decline. If the buyers do not give up, we may see further improvement and an increase to Monday high of 1.3862. However, taking into account the position of the indicators (sell signals remain in place) we see that they still favor sellers, which suggests that another attempt to break below the upper line of the declining trend channel should not surprise. If this is the case, the first downside target will be around 1.3777, where the long-term declining line is (please note that in this area is also the 50-day moving average).
Very short-term outlook: bearish
Short-term outlook: bearish
MT outlook: bearish
LT outlook: bearish
Trading position: In our opinion no positions are justified from the risk/reward perspective. We are not opening short positions just yet, because of the divergence on the long-term charts (we wrote more about this situation in our Forex Trading Alert posted on Thursday), however we will quite likely open it once we see some kind of confirmation. We will keep you informed should anything change, or should we see a confirmation/invalidation of the above.
GBP/USD
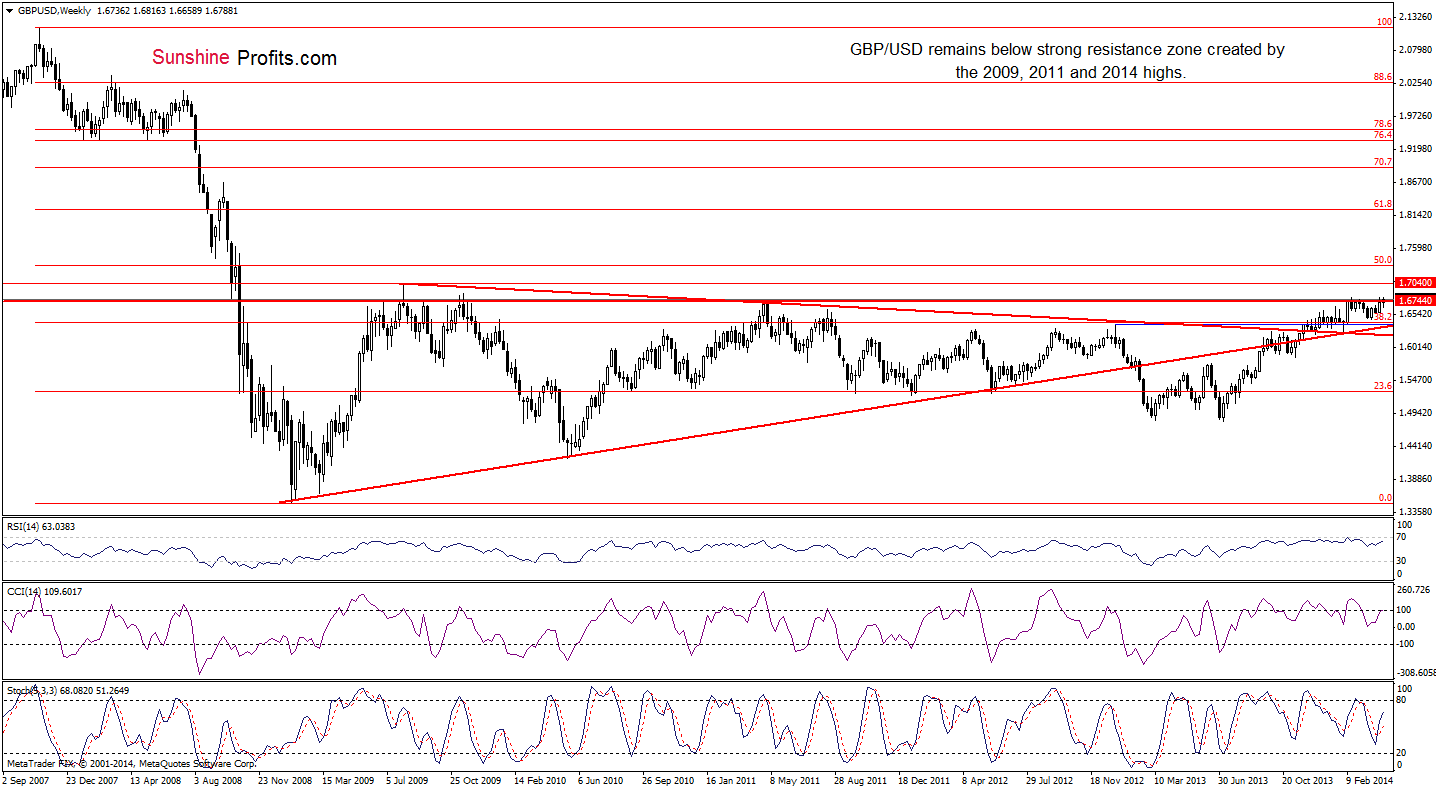
From the weekly perspective, we see that the situation hasn’t changed much. So, what we wrote in our last Forex Trading Alert is still up-to-date.
(…) GBP/USD still remains below the strong resistance zone created by the 2009, 2011 and 2014 highs, which suggests that further deterioration should not surprise us. In fact, it’s likely enough to justify having a speculative short position open (the one that was opened yesterday is already profitable).
To have more complete picture of the current situation in GBP/USD, let’s take a look at the daily chart.
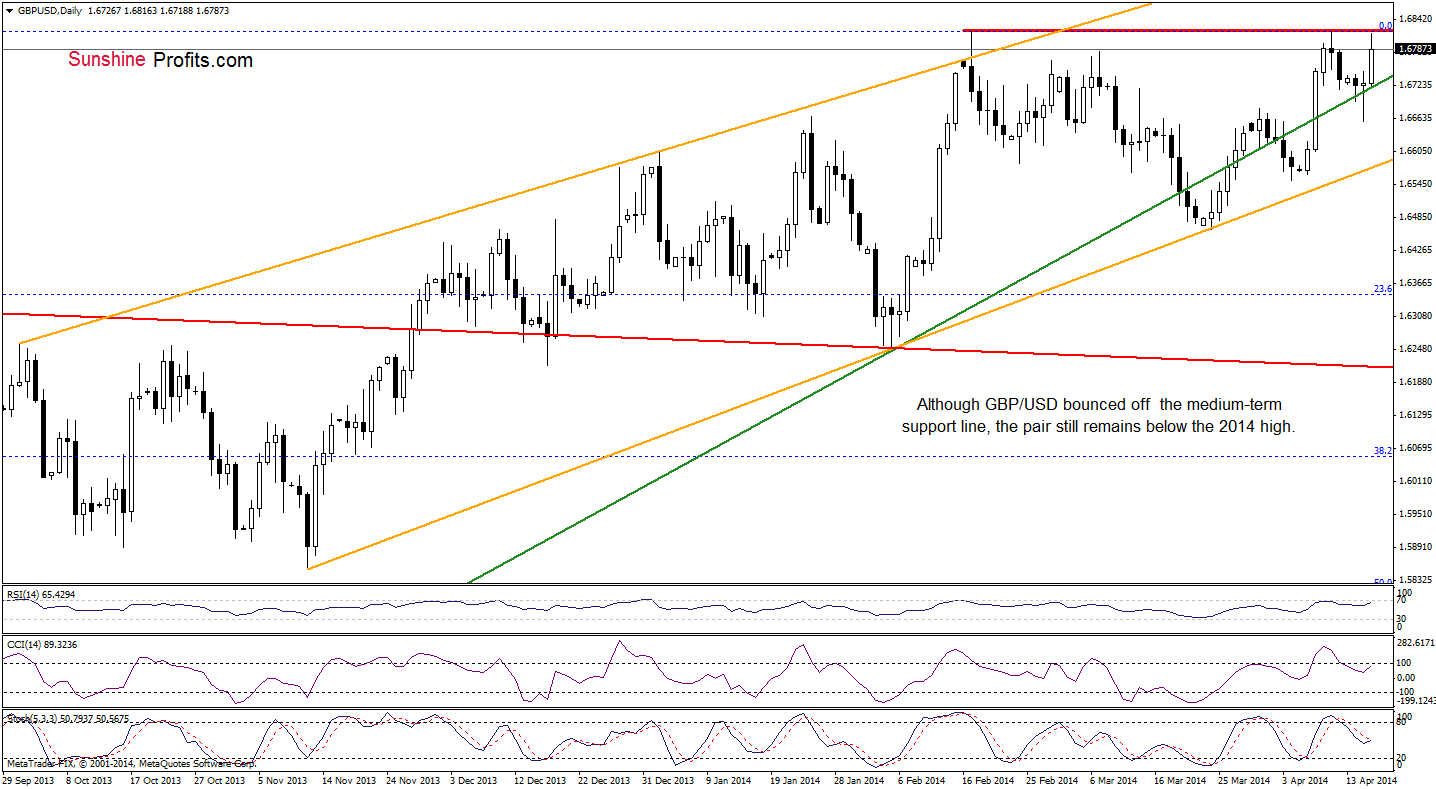
On the above chart, we see that GBP/USD bounced off the medium-term rising green line and almost touched the previous high earlier today. At this point, it’s worth noting that slightly above this level is the 2014 high, which together create a strong resistance zone. Therefore, if this strong resistance area holds, we will likely see a bearish triple top pattern. In this case, the initial downside target will be the medium-term rising green line (currently around 1.6714) once again. Nevertheless, if the buyers do not give up and push the pair above the 2014 high, we may see an increase to the upper line of the trend channel (around 1.6984) or even to the 2009 high (around 1.7040).
Very short-term outlook: mixed with bearish bias
Short-term outlook: bearish
MT outlook: bearish
LT outlook: mixed
Trading position (short-term; our opinion): Short. Stop-loss order: 1.6855. Please note that even if GBP/USD breaks above the 2014 high (and stop-loss order works), we’ll consider re-opening short positions around the 2009 high. At this time, however, it seems that these levels will not be reached before we see another sizable downswing – and thus the current short positions are still justified. We will keep you informed should anything change, or should we see a confirmation/invalidation of the above.
USD/JPY
In our Forex Trading Alert posted on Monday, we wrote the following:
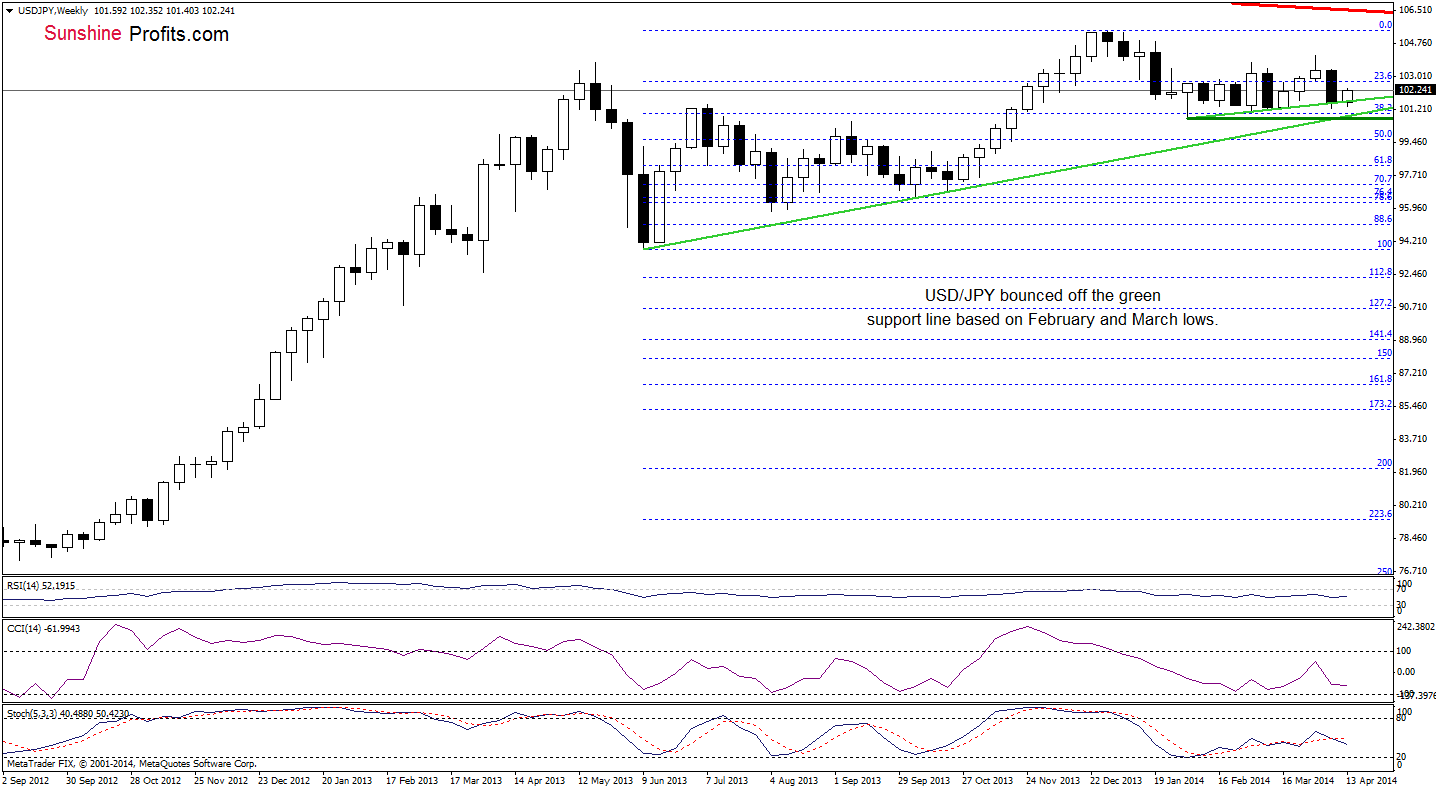
(…) from the weekly perspective, we see that the exchange rate extended declines in the previous week and reached the green support line created by the February and March lows. As you see on the above chart, this strong support encouraged buyers to act in mid-March, which resulted in a corrective upswing in the following weeks. If history repeats itself, we may similar upward move in the coming week (or weeks).
As you see on the above chart, USD/JPY bounced off the upper green support line, which suggests that if the buyers do not give up, we may see further improvement. Where the exchange rate could climb in the nearest future? Let’s take a look at the daily chart.
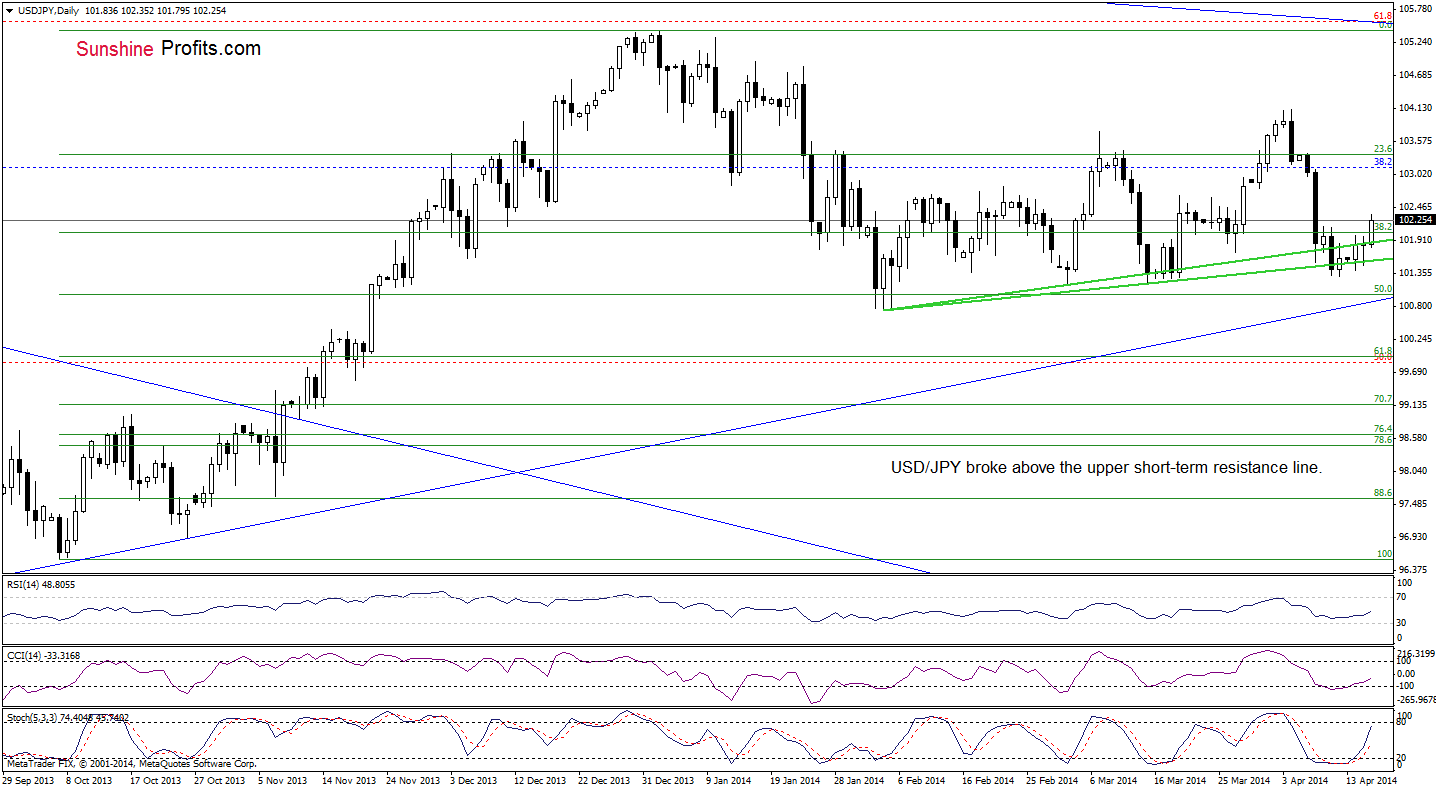
From this perspective, we see that after two unsuccessful attempts to break above the upper green line, the buyers finally managed to push USD/JPY above this resistance, which is a bullish signal. Taking into account the fact that buy signals generated by the indicators remain in place, we may see further improvement. In this case, the initial upside target will be around 102.70, where the 50% Fibonacci retracement based on the recent decline is. If it is broken, the next target for the buyers will be slightly below the April 8 high - around 103.03 (the 61.8% retracement).
Very short-term outlook: bullish
Short-term outlook: mixed
MT outlook: bullish
LT outlook: bearish
Trading position (short-term): In our opinion no positions are justified from the risk/reward perspective at the moment. We will keep you informed should anything change, or should we see a confirmation/invalidation of the above.
USD/CAD
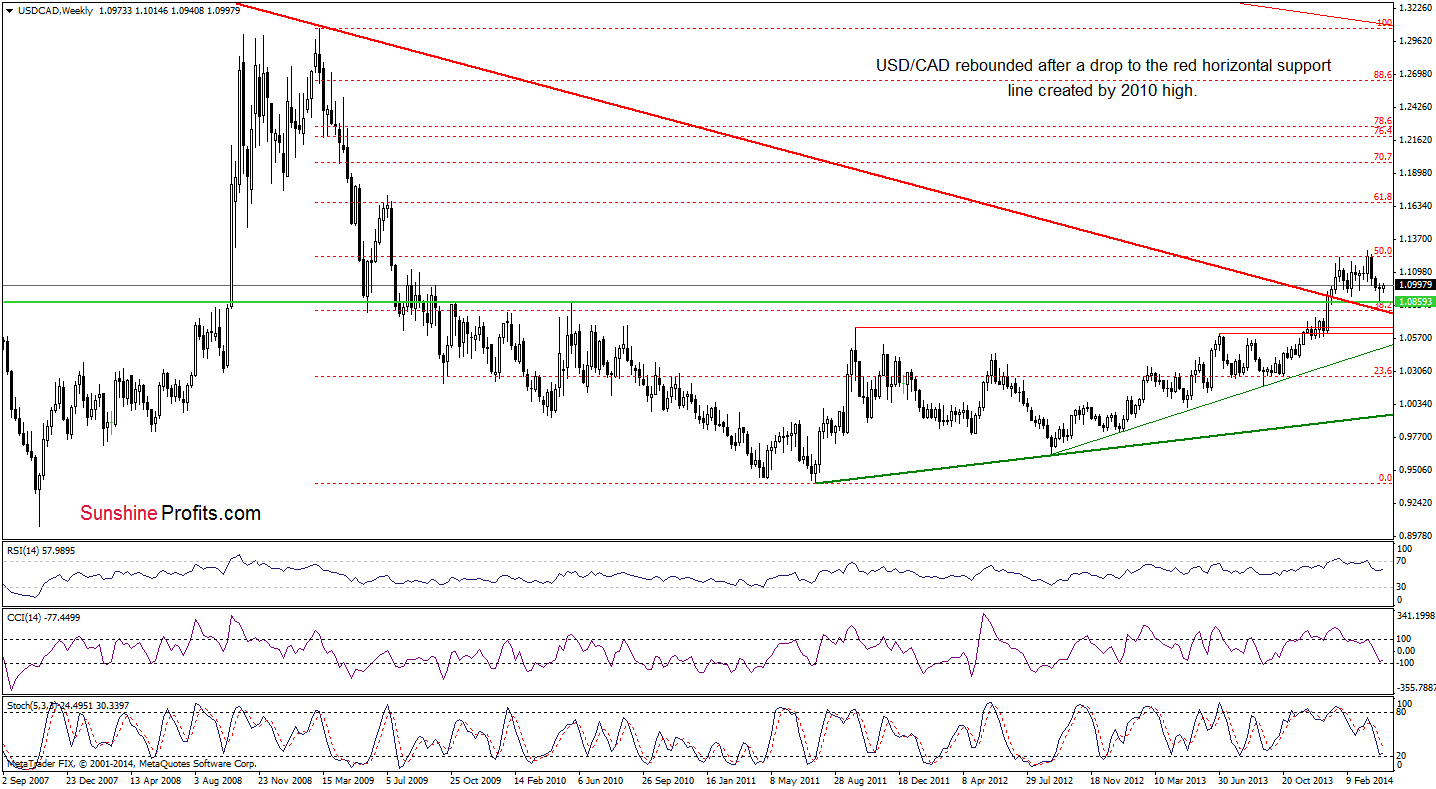
Looking at USD/CAD from the weekly perspective, we see that although the exchange rate declined in the previous weeks, it still remains above the previously-broken long term declining support/resistance line (marked with red). With this downward move, the pair declined to the horizontal green support line (created by the 2010 high) and rebounded. Nevertheless, the size of the corrective upswing is still quite small, which suggests that another attempt to move lower can’t be ruled out.
Before we summarize this currency pair, let’s move on to the daily chart.
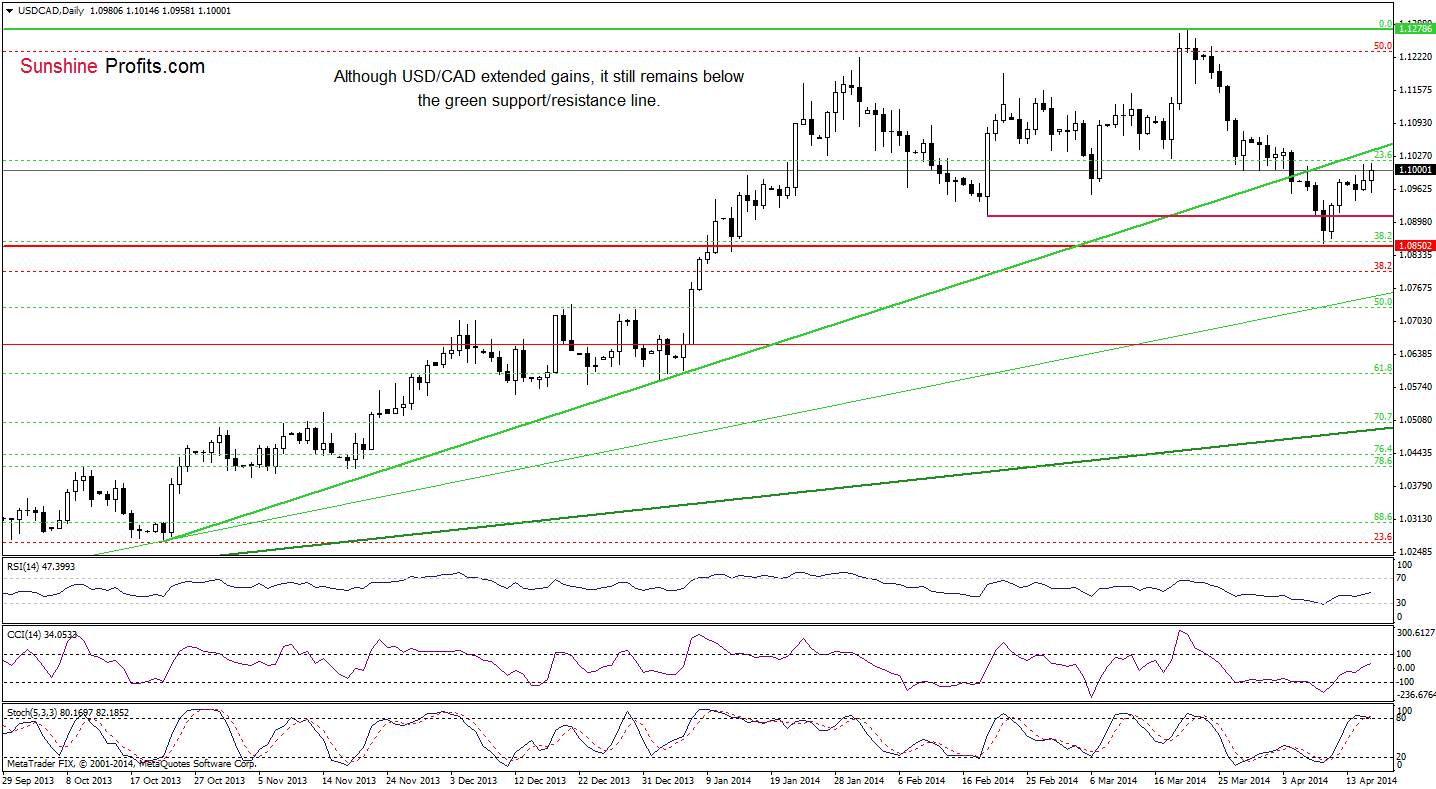
As you see on the above chart, the situation hasn’t changed much. Although USD/CAD extended gains earlier today, it still remains below the previously-broken green support line. Therefore, what we wrote in our previous Forex Trading Alert is still valid.
(…) if the buyers manage to push the exchange rate higher, we may see an increase to the major resistance line (currently around 1.1026). Please note that the pro growth scenario is reinforced by the current position of the indicators (the RSI bounced off the level of 30, while buy signals generated by the CCI and Stochastic Oscillator remain in place).
Very short-term outlook: mixed with bullish bias
Short-term outlook: mixed
MT outlook: bullish
LT outlook: bearish
Trading position (short-term): In our opinion no positions are justified from the risk/reward perspective. We will keep you informed should anything change, or should we see a confirmation/invalidation of the above.
USD/CHF
Quoting our last Forex Trading Alert:
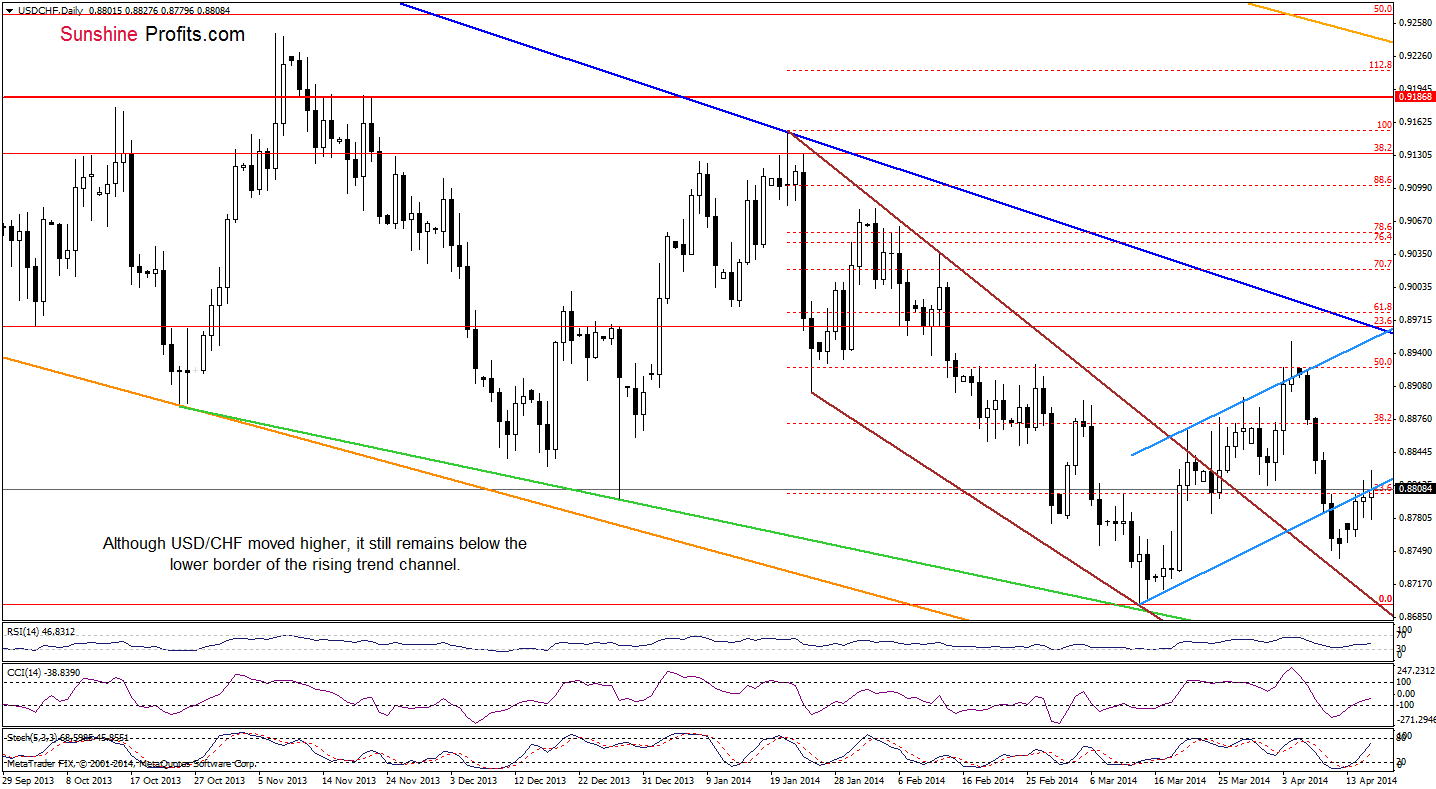
(…) If the buyers do not give up and break above this resistance line, we may see an increase to (at least) 0.8813, where the Apr.1 low is. (…) Please note that the RSI bounced of the level of 30, while the CCI and Stochastic Oscillator generated buy signals, which suggests that another attempt to move higher should not surprise us.
As you see on the above chart, although the overall situation hasn’t changed much (as USD/CHF remains around the lower border of the blue rising trend channel), the buyers managed to push the exchange rate to the first upside target, which is a positive signal. Additionally, buy signals generated by the indicators remain in place, which suggest further improvement. If this is the case, the initial upside target will be around 0.8845, where the 50% Fibonacci retracement (based on the recent decline) and the Apr.9 high are. If this level is broken, the next upside target will be slightly below the Apr.8 high, where the 61.8% Fibonacci retracement is (around 0.8872).
Very short-term outlook: bullish
Short-term outlook: mixed
MT outlook: bearish
LT outlook: bearish
Trading position (short-term): In our opinion no positions are justified from the risk/reward perspective. We will keep you informed should anything change, or should we see a confirmation/invalidation of the above.
AUD/USD
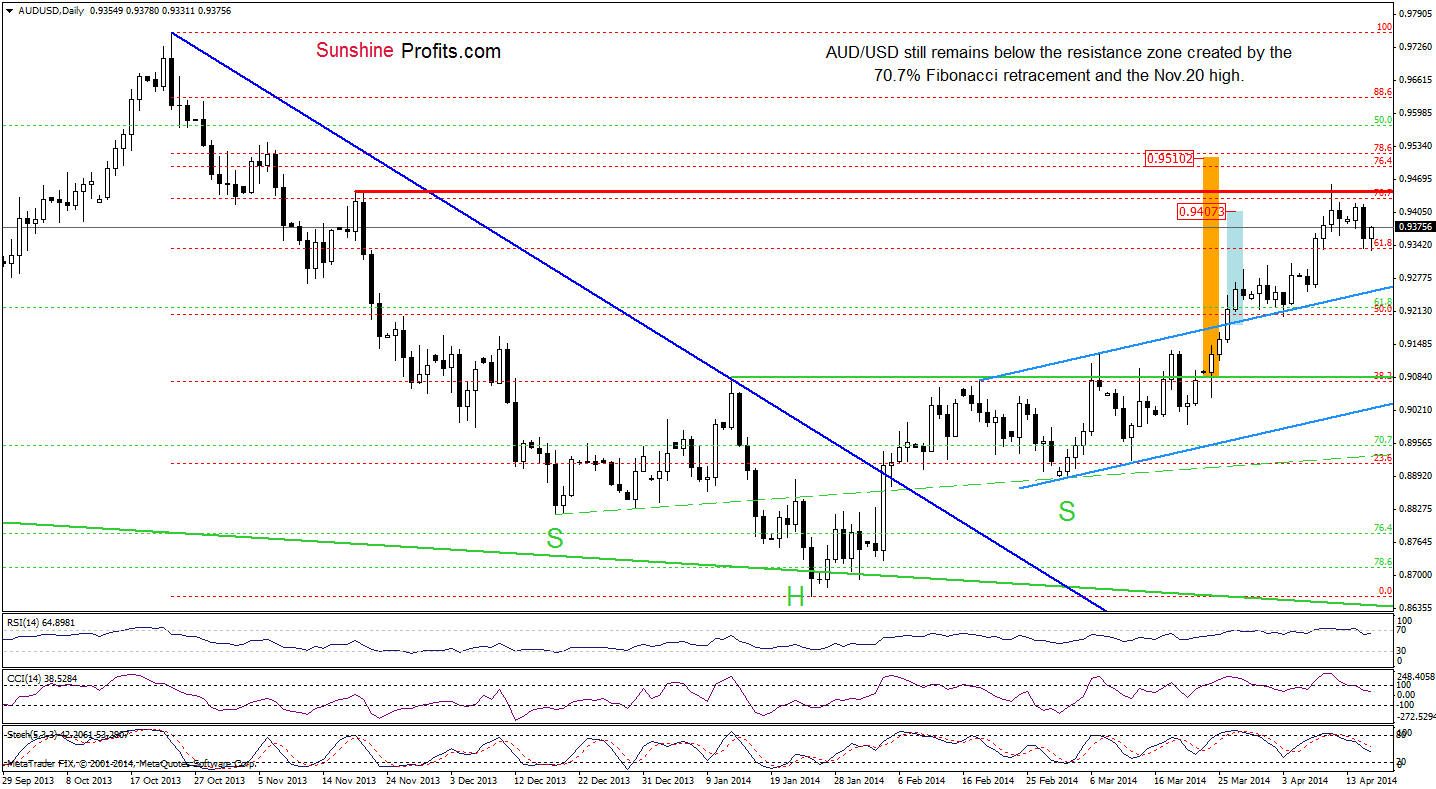
On the above chart, we see that the situation hasn’t changed much. Although AUD/USD rebounded, the pair still remains below the resistance zone created by the 70.7% Fibonacci retracement and the Nov.20 high. Additionally, the size of a corrective upswing is too small to say that we won’t see another attempt to move lower – especially when we factor in the current position of the indicators (sell signals remain in place and still favor sellers). As a reminder, if the exchange rate extends declines, we may see a pullback to the previously-broken upper line of the trend channel (currently around 0.9250).
Very short-term outlook: mixed
Short-term outlook: mixed with bearish bias
MT outlook: bearish
LT outlook: bearish
Trading position (short-term): In our opinion no positions are justified from the risk/reward perspective at the moment. We will keep you informed should anything change, or should we see a confirmation/invalidation of the above.
Thank you.
Nadia Simmons
Forex & Oil Trading Strategist
Przemyslaw Radomski, CFA
Founder, Editor-in-chief
Gold & Silver Trading Alerts
Forex Trading Alerts
Oil Investment Updates
Oil Trading Alerts

