
The U.S. currency moved lower after data showed that the Chicago PMI fell to 55.9 in March (from 59.8 in February), while analysts had expected a drop to 59.0 this month. Additionally, the greenback extended losses after Federal Reserve Chair Janet Yellen commentary. Ms. Yellen said that the Fed’s commitment to economic stimulus will still be needed for some time as “considerable slack” still remained in the labor market. What impact did it have on major currency pairs? What is their current outlook? If you want to know our take on this question, we invite you to read our today's Forex Trading Alert.
In our opinion the following forex trading positions are justified - summary:
EUR/USD
In our last Forex Trading Alert, we wrote the following:
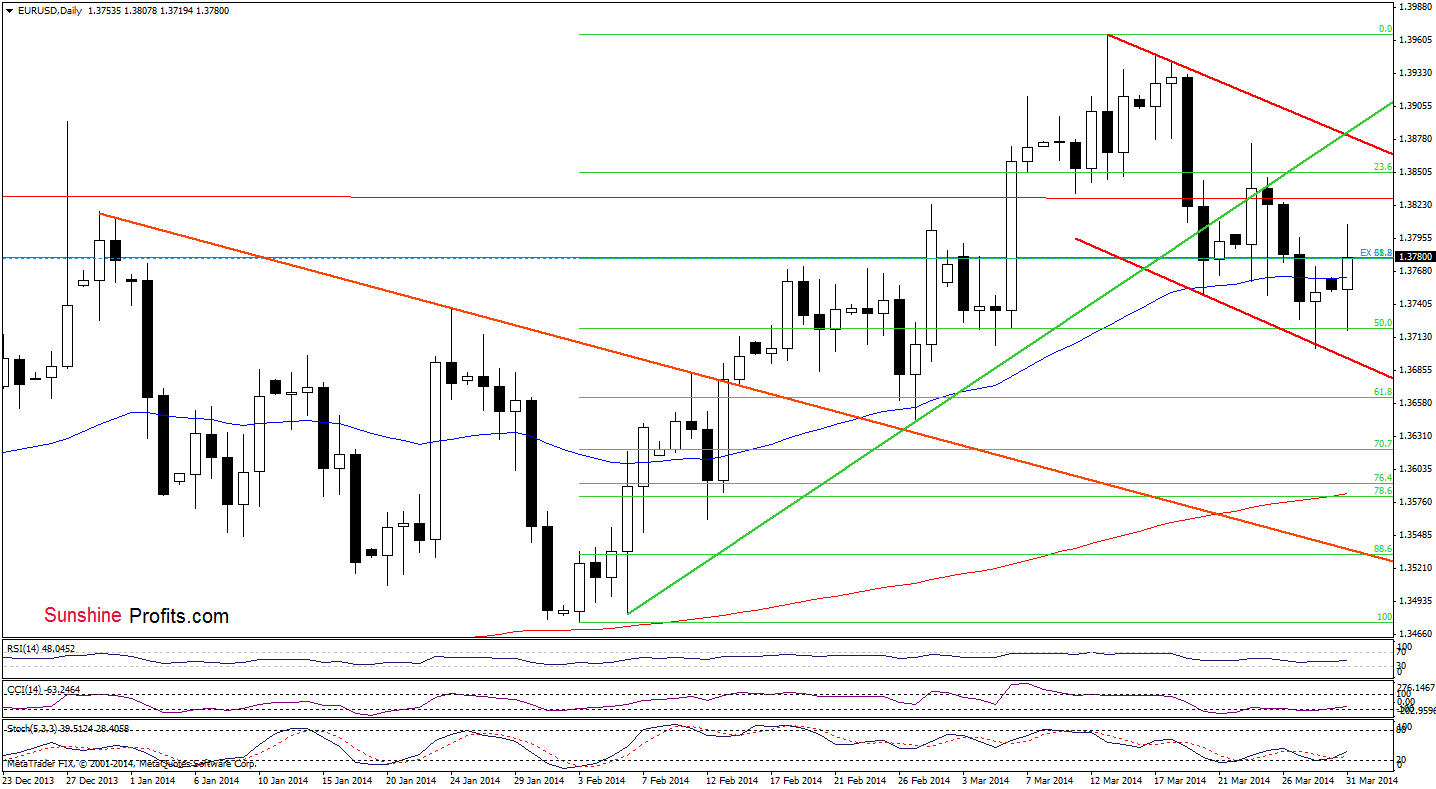
(…) the pair reversed and climbed to the previously broken 50-day moving average (…). If it holds, we will likely see a pullback to the 50% Fibonacci retracement. However, if this resistance is broken, we will likely see further improvement.
Earlier today, we saw such price action as EUR/USD bounced off the 50% Fibonacci retracement and came back above the 50-day moving average. As you see on the above chart, the CCI and Stochastic Oscillator generated buy signals, which suggests further improvement in the coming days.
Before we summarize this currency pair, let’s take a look at the 4-hour chart below.
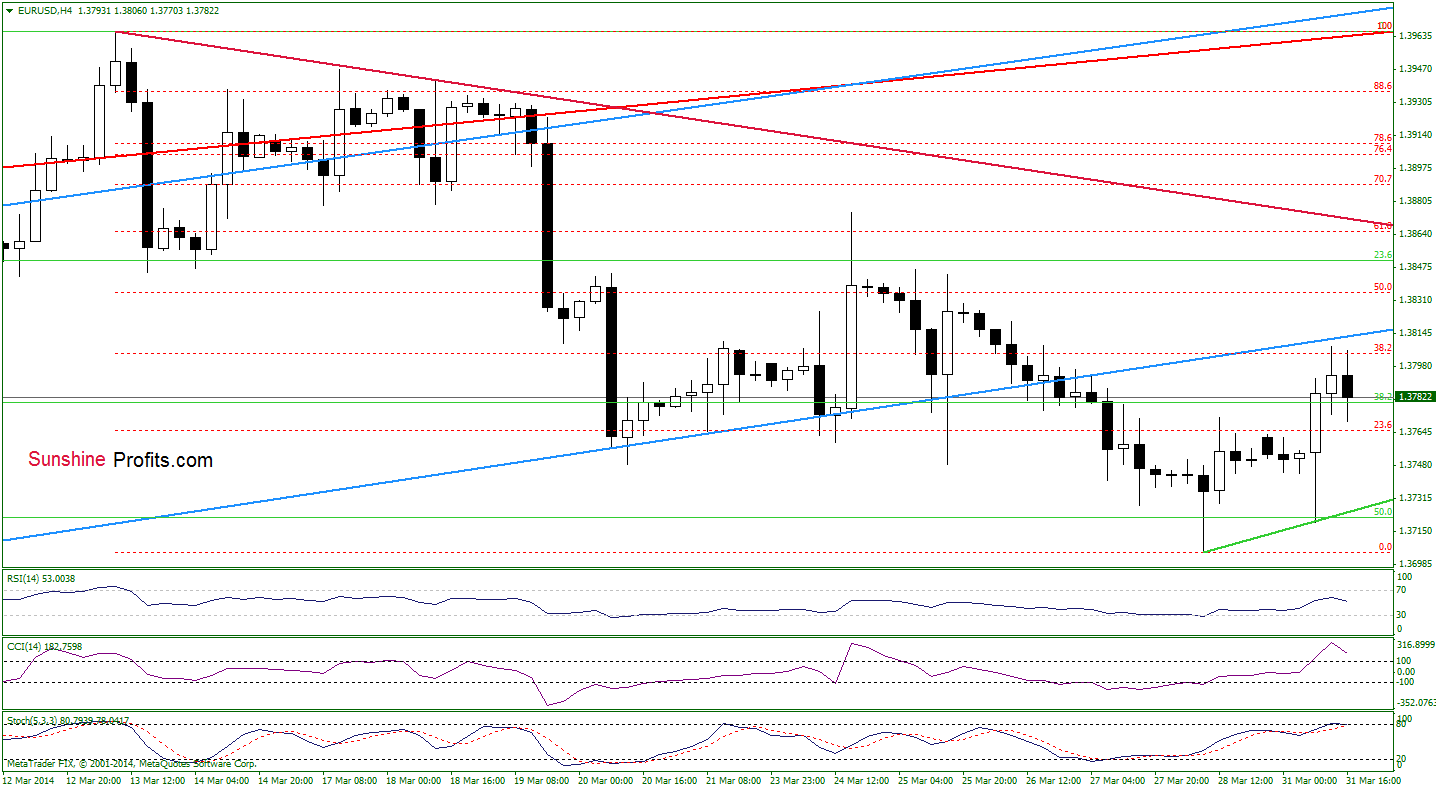
From this perspective, we see that the pair reached the 38.2% Fibonacci retracement and almost touched the previously-broken lower border of the blue rising trend channel. As you see on the above chart, this resistance zone encouraged the sellers to act and triggered a pullback. Taking into account the current position of the indicators (the CCI and Stochastic Oscillator are overbought), it seems that the exchange rate will extend the current correction in the following hours. If this is the case, the downside target will be the green support zone based on the recent lows.
Very short-term outlook: mixed
Short-term outlook: mixed
MT outlook: mixed
LT outlook: bearish
Trading position: In our opinion no positions are justified from the risk/reward perspective. We will keep you informed should anything change, or should we see a confirmation/invalidation of the above.
GBP/USD
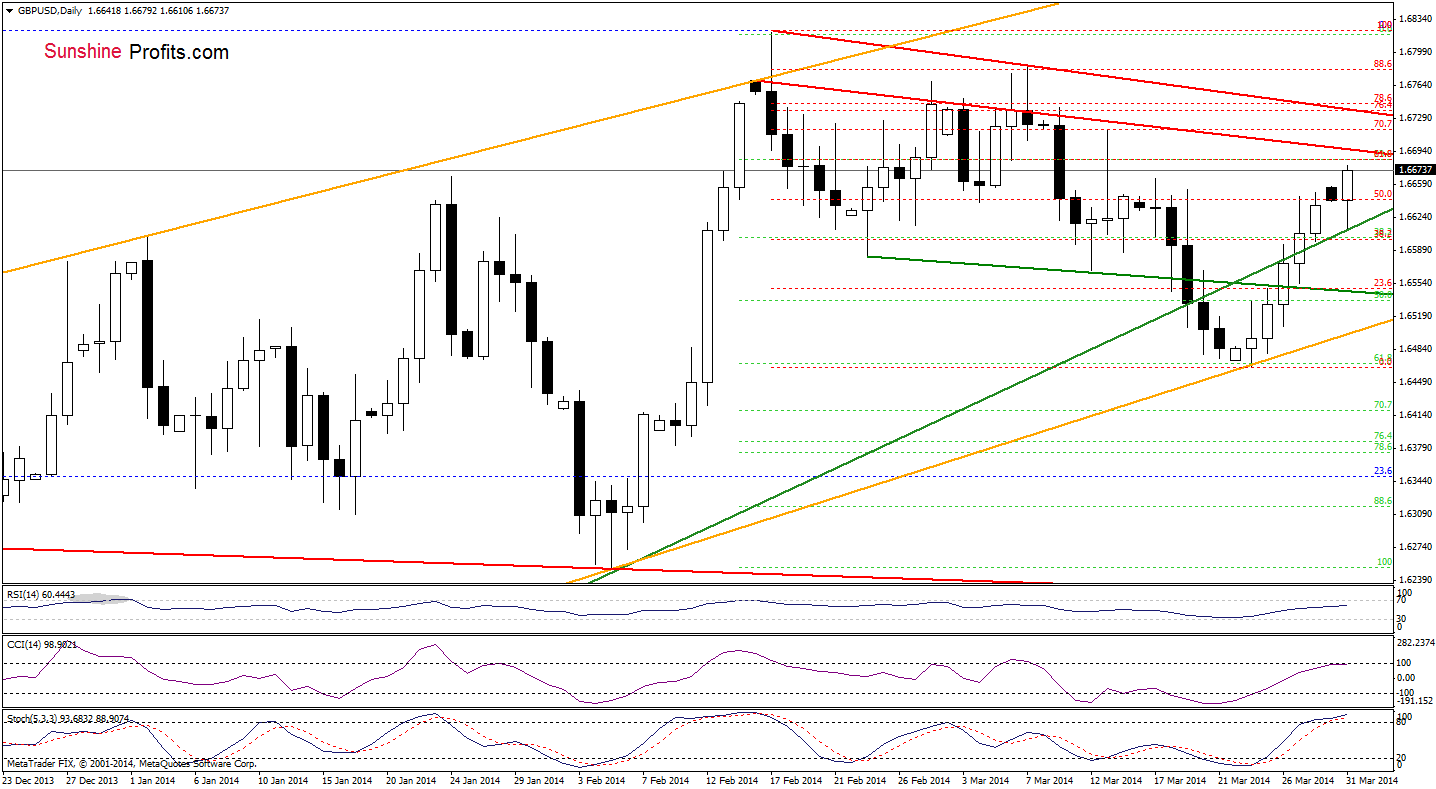
On the daily chart, we see that the situation has improved as GBP/USD bounced off the medium-term green support line and broke above the 50% Fibonacci retracement. Despite these positive circumstances, the exchange rate approached a strong resistance zone created by the 61.8% Fibonacci retracement and the red declining resistance line. If this area encourages the sellers to act, we will likely see a pullback in the coming day (or days). However, if it is broken, the pair may climb to the next resistance zone created by the 76.4%-78.6% Fibonacci retracements and the upper red declining resistance line. Nevertheless, we should keep in mind that the current position of the indicators (the CCI and Stochastic Oscillator are overbought) suggests that the space for further growth seems to be limited.
Very short-term outlook: bullish
Short-term outlook: mixed with bullish bias
MT outlook: mixed
LT outlook: mixed
Trading position (short-term): In our opinion no positions are justified from the risk/reward perspective at the moment. We will keep you informed should anything change, or should we see a confirmation/invalidation of the above.
USD/JPY
Quoting our last Forex Trading Alert:
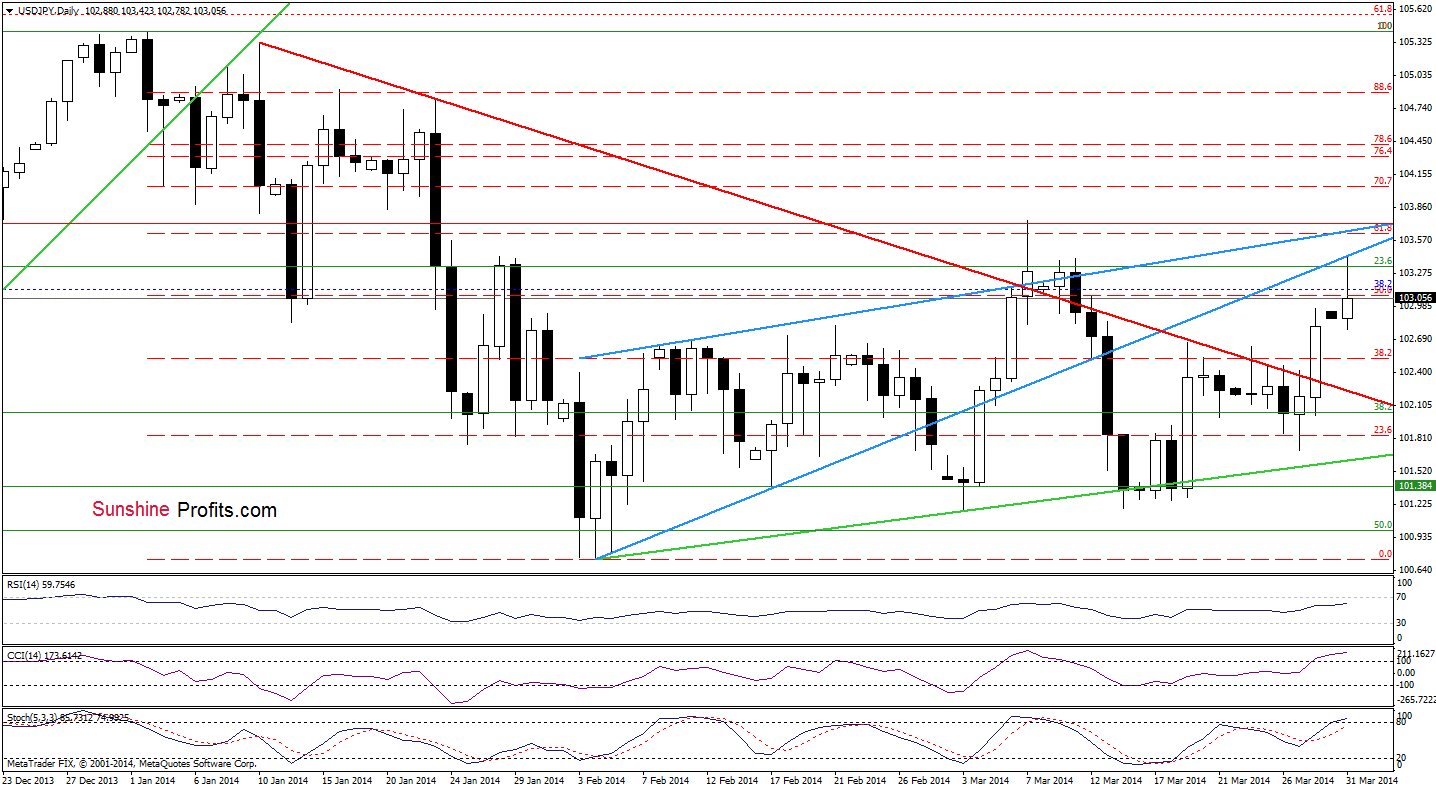
(…) the exchange rate climbed above the 38.2% Fibonacci retracement, which is a bullish signal. Taking this fact into account and combining it with the current position of the indicators (they still have some space for further growth), it seems that we may see an increase to the next Fibonacci retracement level (around 103.07) in the near future.
On the above chart, we see that USD/JPY extended gains and not only reached the 50% Fibonacci retracement, but also climbed to the previously-broken lower line of the blue rising wedge. If this resistance encourages the sellers to act, we will likely see a pullback to the March 19 high. However, if it is broken, we may see an increase to a strong resistance zone created by the 61.8% Fibonacci retracement, the upper line of the blue rising wedge and the March 7 high. Looking at the current position of the indicators, we see that the CCI and Stochastic Oscillator are overbought, which suggests that the space for further growth seems to be limited.
Before we summarize this currency pair, let’s take a look at the 4-hour chart.
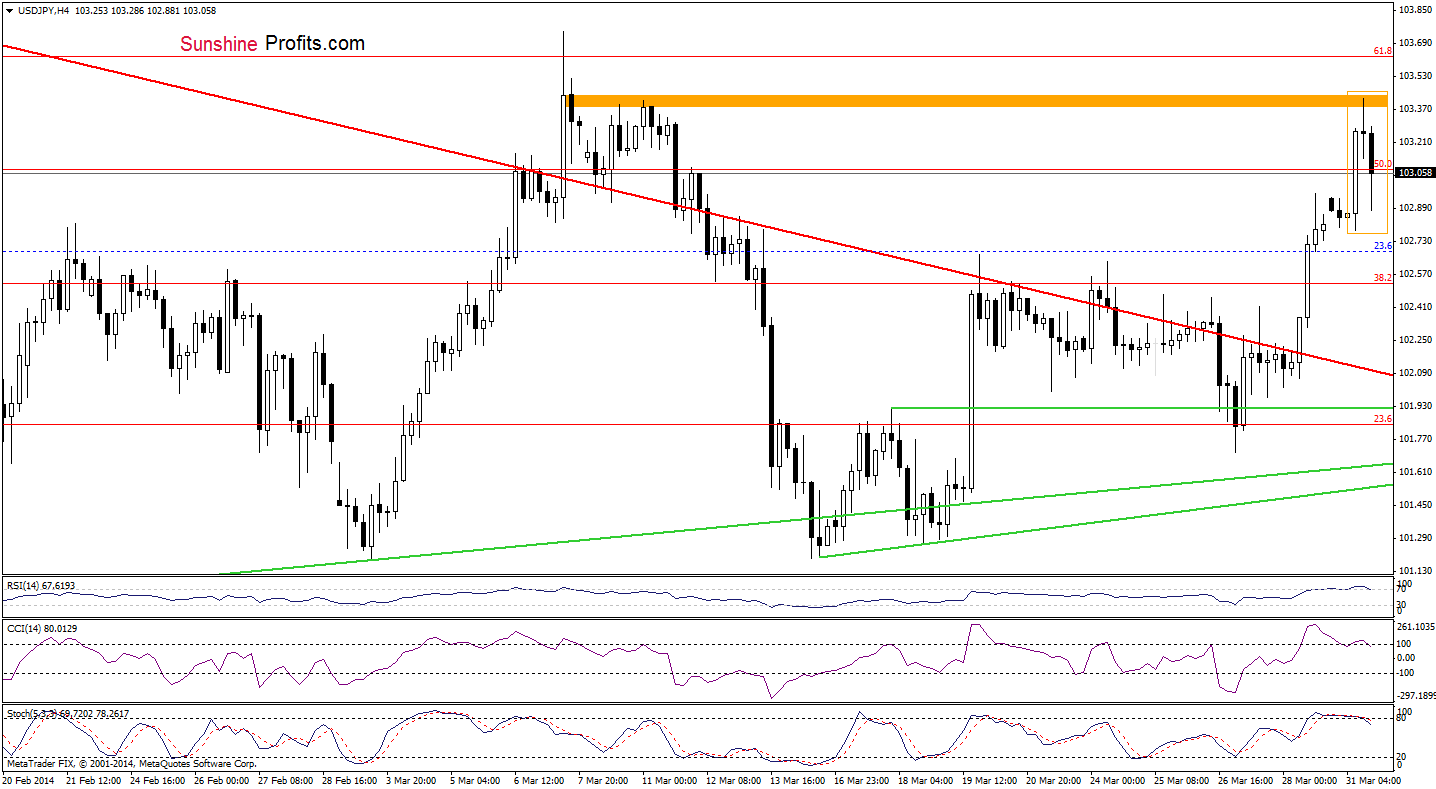
From this perspective, we see that the pair reached a resistance zone (marked with orange). Additionally, if USD/JPY extends declines, we may see a bearish candlesticks pattern (an evening star), which will reinforce this area. This scenario is quite likely to be seen - especially when we factor in sell signals generated by the indicators.
Very short-term outlook: mixed
Short-term outlook: mixed
MT outlook: bullish
LT outlook: bearish
Trading position (short-term): In our opinion no positions are justified from the risk/reward perspective at the moment. We will keep you informed should anything change, or should we see a confirmation/invalidation of the above.
USD/CAD
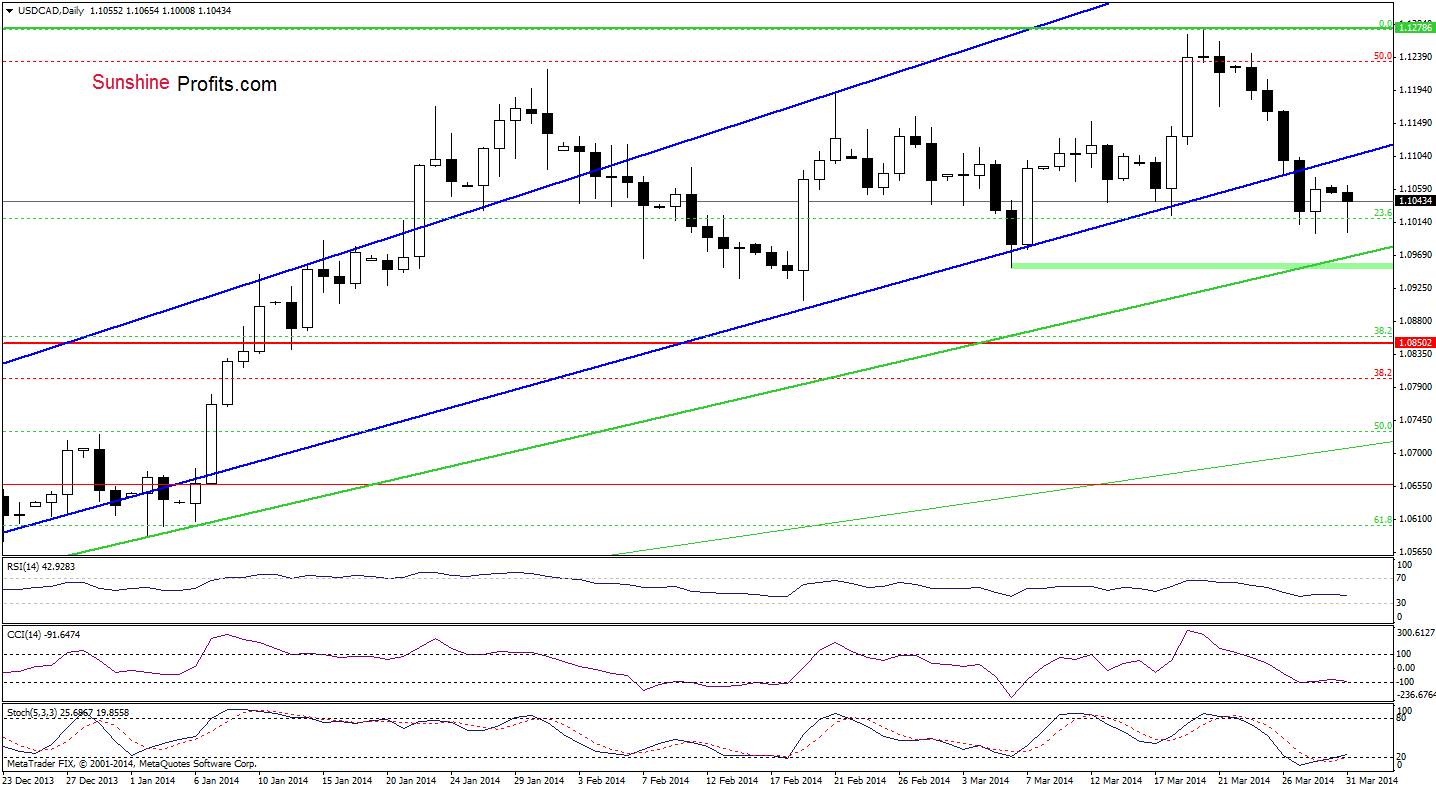
As you see on the above chart, the situation hasn’t changed much as USD/CAD remains between Friday’s high and low. If the pair extends gains, we will likely see another attempt to reach the previously-broken lower border of the rising trend channel. Please note that even if the exchange rate drops below Friday’s low, the medium-term green support line will likely stop further deterioration. At this point, it’s worth noting that the CCI and Stochastic Oscillator generated buy signals, which reinforces a pro growth scenario.
Very short-term outlook: mixed with bullish bias
Short-term outlook: mixed
MT outlook: bullish
LT outlook: bearish
Trading position (short-term): In our opinion no positions are justified from the risk/reward perspective. We will keep you informed should anything change, or should we see a confirmation/invalidation of the above.
USD/CHF
In our last Forex Trading Alert, we wrote the following:
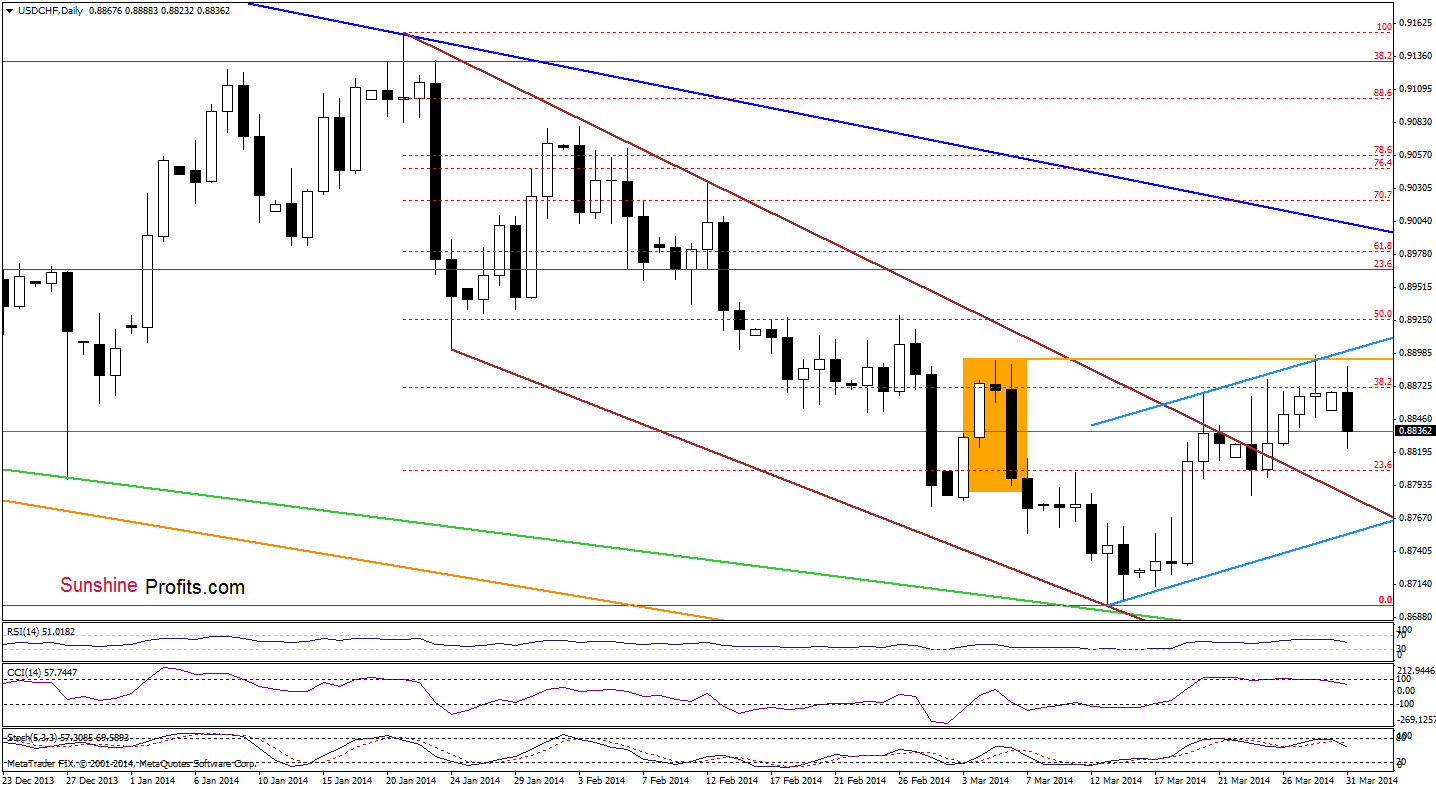
(…) the pair invalidated a breakout above the resistance level, which is a bearish signal. Therefore, if the buyers do not invalidate the bearish evening star (marked with an orange rectangle), it will likely have a negative impact on the exchange rate in the near future.
As you see on the above chart, the buyers failed on Friday, which triggered a pullback earlier today. Taking into account the current position of the indicators, it seems that further deterioration is likely to be seen. Where the exchange rate could drop in the near future? Let’s take a look at the 4-hour chart.
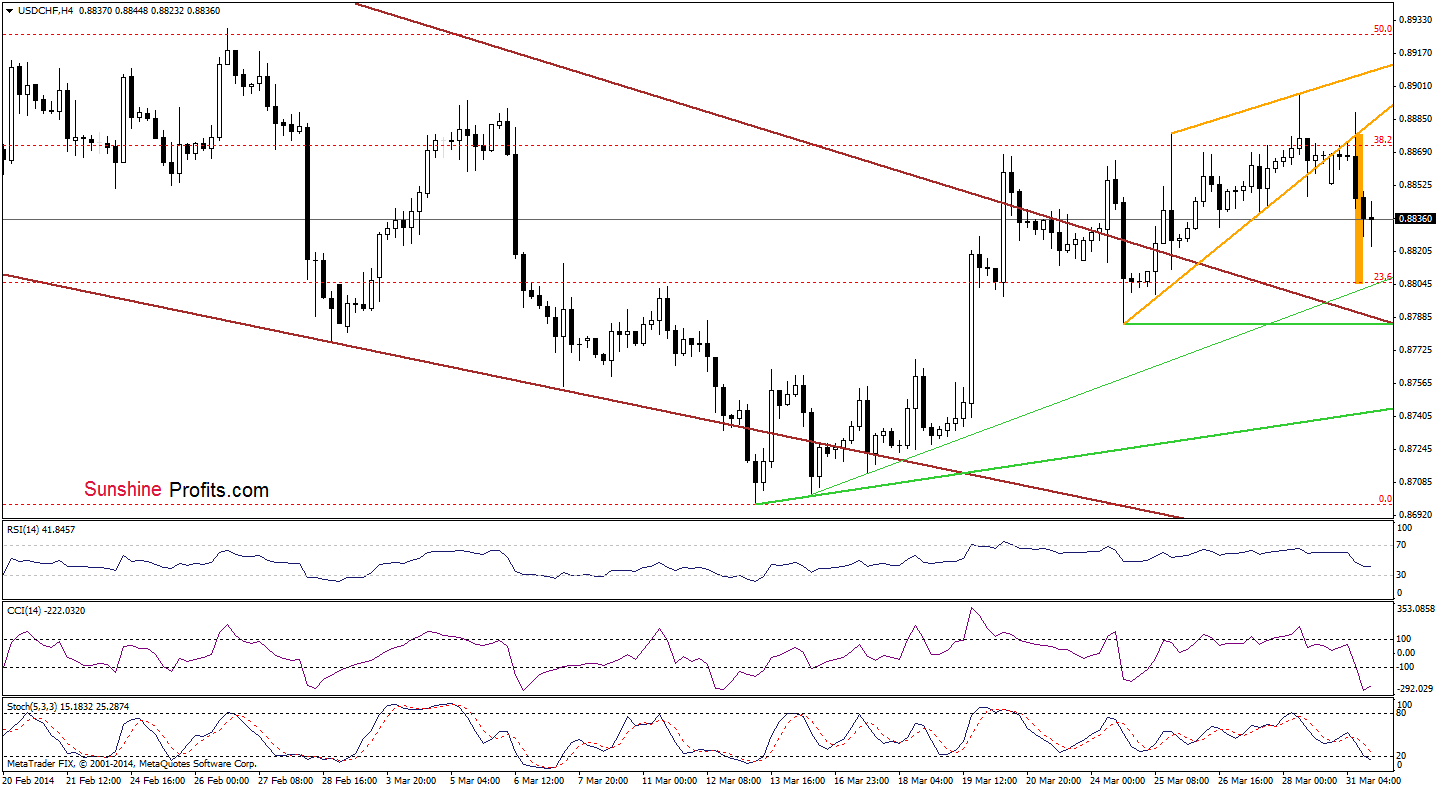
From this perspective, we see that the exchange rate declined below the lower border of the rising wedge (marked with orange), which is a bearish signal. According to theory, the downside target (after a breakdown below the lower line of this formation) is around 0.8805 – slightly above the very short-term support line. Please note that if this area doesn’t stop sellers, the next downside target will be the short-term brown declining line, which is currently slightly above the March 24 low.
Very short-term outlook: bearish
Short-term outlook: mixed with bearish bias
MT outlook: bearish
LT outlook: bearish
Trading position (short-term): In our opinion no positions are justified from the risk/reward perspective. We will keep you informed should anything change, or should we see a confirmation/invalidation of the above.
AUD/USD
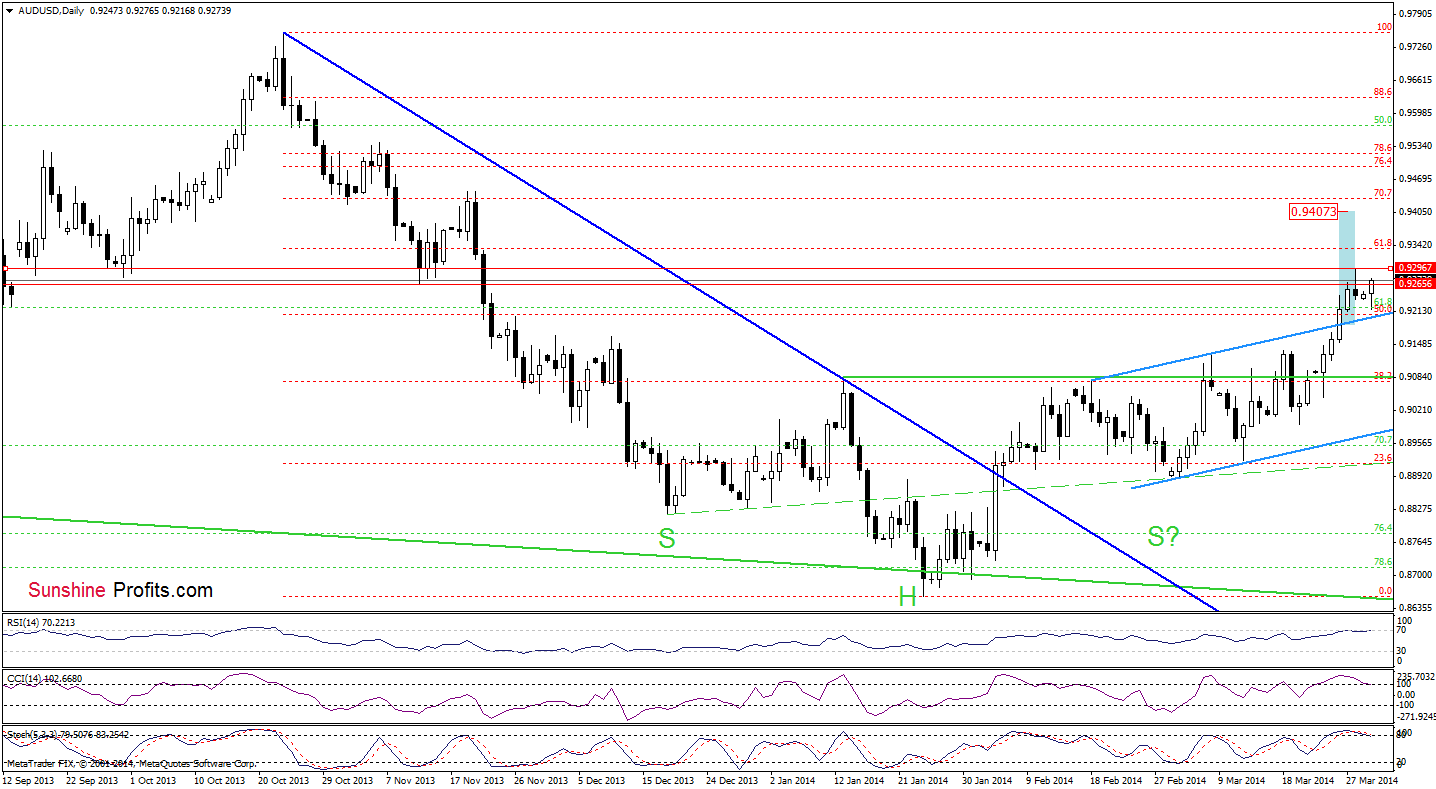
Looking at the above chart, we see that the situation hasn’t changed much as AUD/USD remains between a resistance zone created by lows from mid-November and the previously-broken upper line of the trend channel. If the pair extends gains, we may see an increase to the 61.8% Fibonacci retracement based on the entire decline. However, if the buyers fail and the exchange rate declines once again, we may see an attempt to break below the upper line of the trend channel. Please keep in mind that the indicators are overbought, which suggests that a pause should not surprise us.
Very short-term outlook: mixed
Short-term outlook: bullish
MT outlook: bearish
LT outlook: bearish
Trading position (short-term; our opinion): In our opinion no positions are justified from the risk/reward perspective at the moment. We will keep you informed should anything change, or should we see a confirmation/invalidation of the above.
Thank you.
Nadia Simmons
Forex & Oil Trading Strategist
Forex Trading Alerts
Oil Investment Updates
Oil Trading Alerts

