
The U.S. dollar moved higher against major currency pairs after the Fed said it would reduce its monthly bond purchases by another $10 billion a month in April, to $55 billion. What impact did it have on major currency pairs? What is their current outlook? If you want to know our take on this question, we invite you to read our today's Forex Trading Alert.
In our opinion the following forex trading positions are justified - summary:
- EUR/USD: short (stop-loss order: 1.4008)
- GBP/USD: none
- USD/JPY: none
- USD/CAD: none
- USD/CHF: none
- AUD/USD: short (stop-loss order: 0.9166 and the initial price target: 0.8955)
EUR/USD
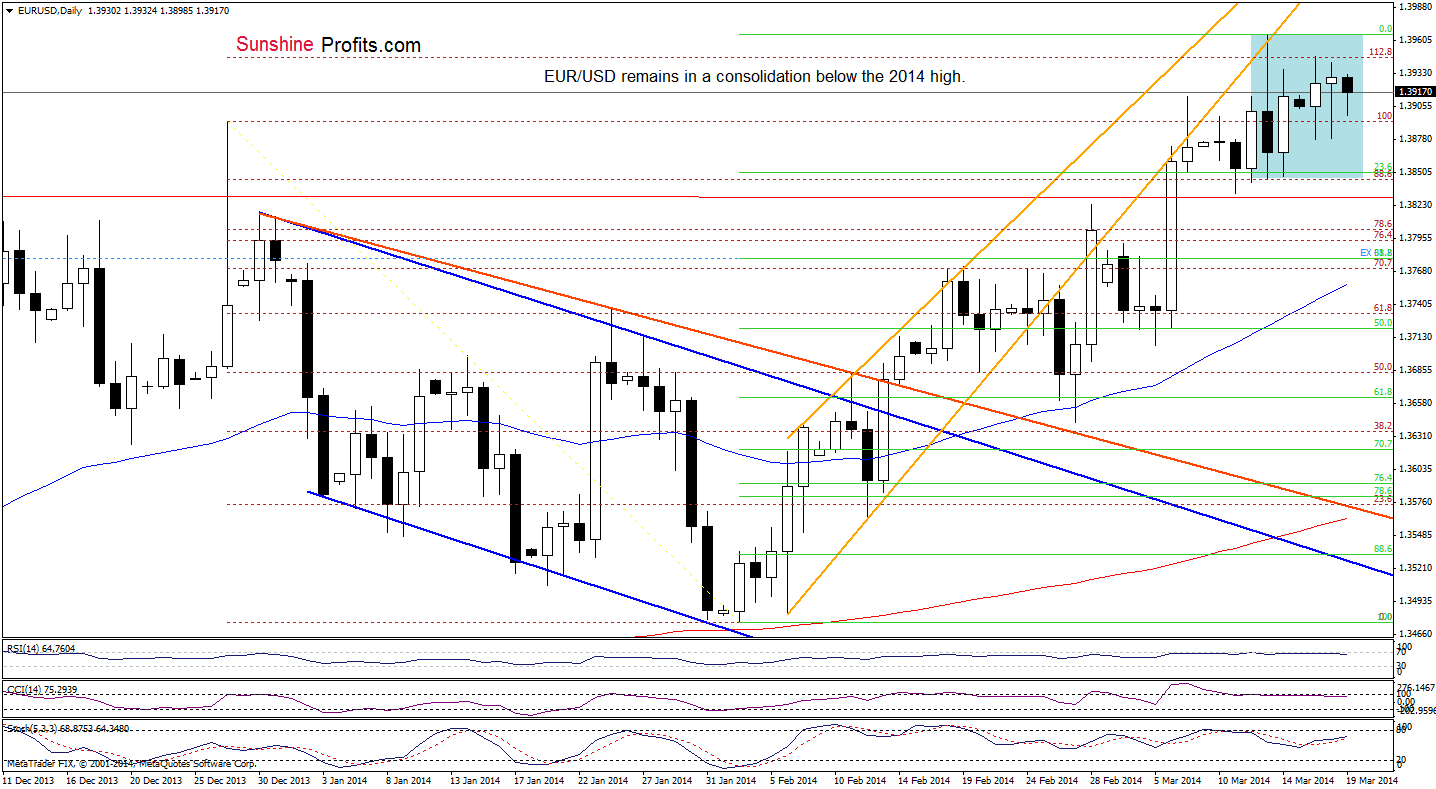
As you see on the above chart, although EUR/USD declined earlier today, the exchange rate still remains between Thursday high and low. From this perspective the situation is a bit unclear as the CCI and Stochastic Oscillator move in the opposite directions. Nevertheless, if the exchange rate extends losses, the next downside target will be the lower border of the consolidation range. On the other hand, if the pair climbs above the 2014 high, the next upside target will be the 127.2% Fibonacci extension level slightly above the psychological barrier of 1.4000. Will the 4-hour chart give us any interesting clues?
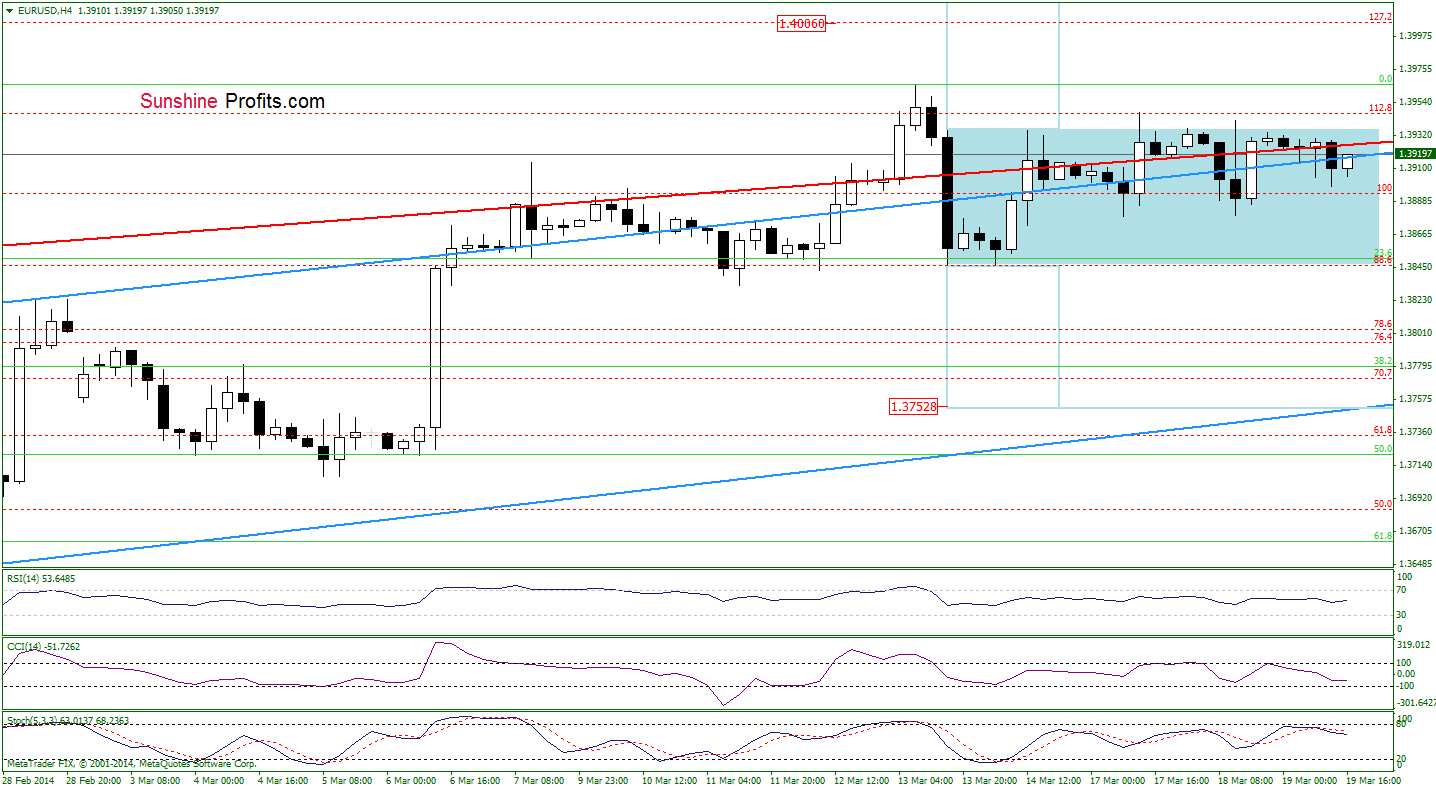
From this perspective, we see that EUR/USD declined below the upper line of the rising trend channel. Additionally, the current position of the indicator favors sellers, which suggests that we may see another attempt to move lower in the following hours. The first downside target is the 23.6% Fibonacci retracement level. If it is broken, we may see a drop to the 38.2% retracement or even to the lower border of the trend channel (currently around 1.3753).
Very short-term outlook: mixed with bearish bias
Short-term outlook: mixed with bearish bias
MT outlook: mixed
LT outlook: bearish
Trading position (short-term) in our opinion: Short. Stop-loss order: 1.4008. We will keep you informed should anything change as far as our opinion is concerned, or should we see a confirmation/invalidation of the above. The above is not an investment / trading advice and please note that trading (especially using leveraged instruments such as futures or on the forex market) involves risk.
GBP/USD
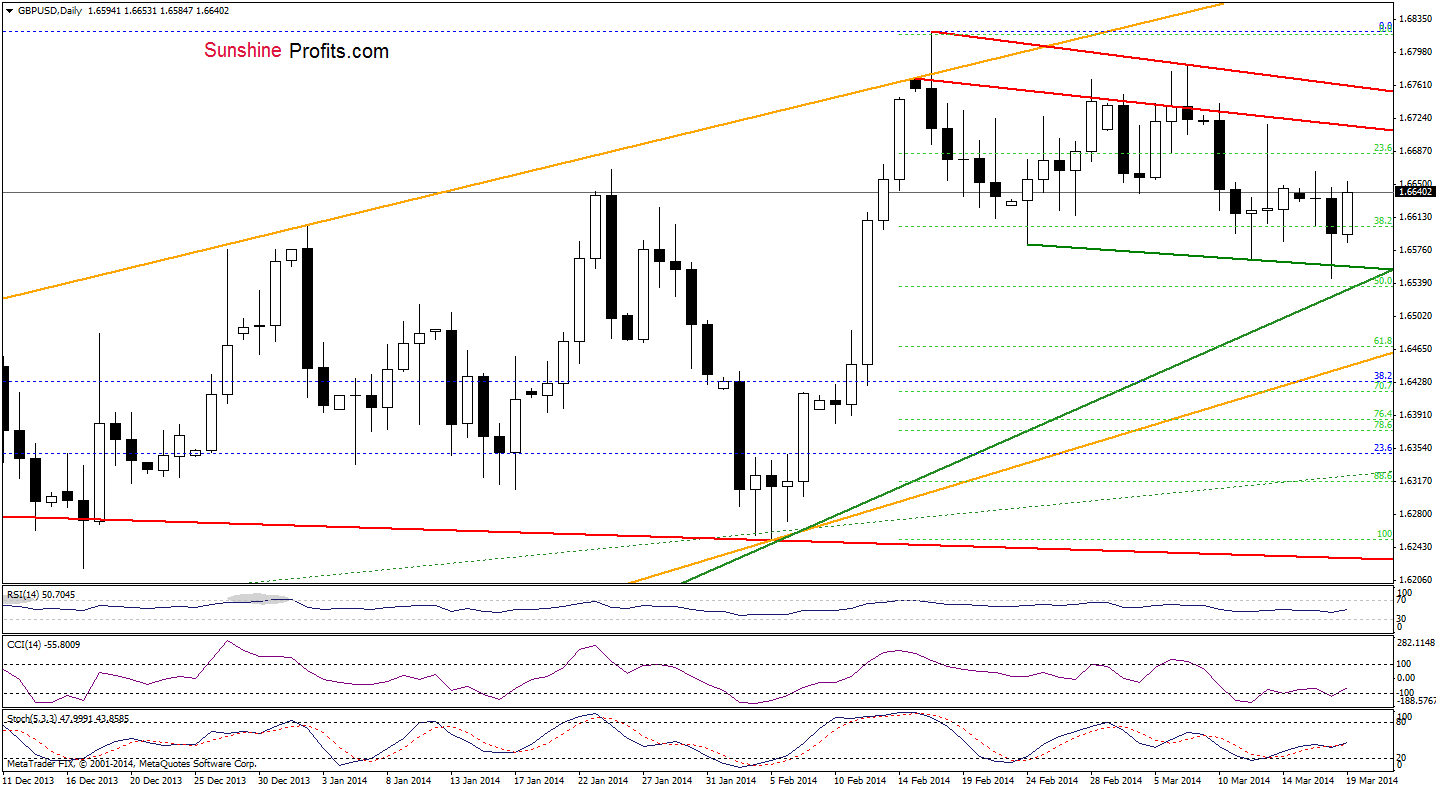
Looking at the daily chart, we see that the exchange rate rebounded after a drop to the green line based on recent lows (which serves as major support at the moment). Despite this increase, GBP/USD still remains in a narrow range between this support line and two red declining resistance lines. From this perspective, as long as there is no successful breakout/breakdown above/below one of these lines, a bigger upswing/downswing is not likely to be seen.
Very short-term outlook: mixed
Short-term outlook: mixed
MT outlook: mixed
LT outlook: mixed
Trading position (short-term): In our opinion no positions are justified from the risk/reward perspective at the moment. We will keep you informed should anything change, or should we see a confirmation/invalidation of the above.
USD/JPY
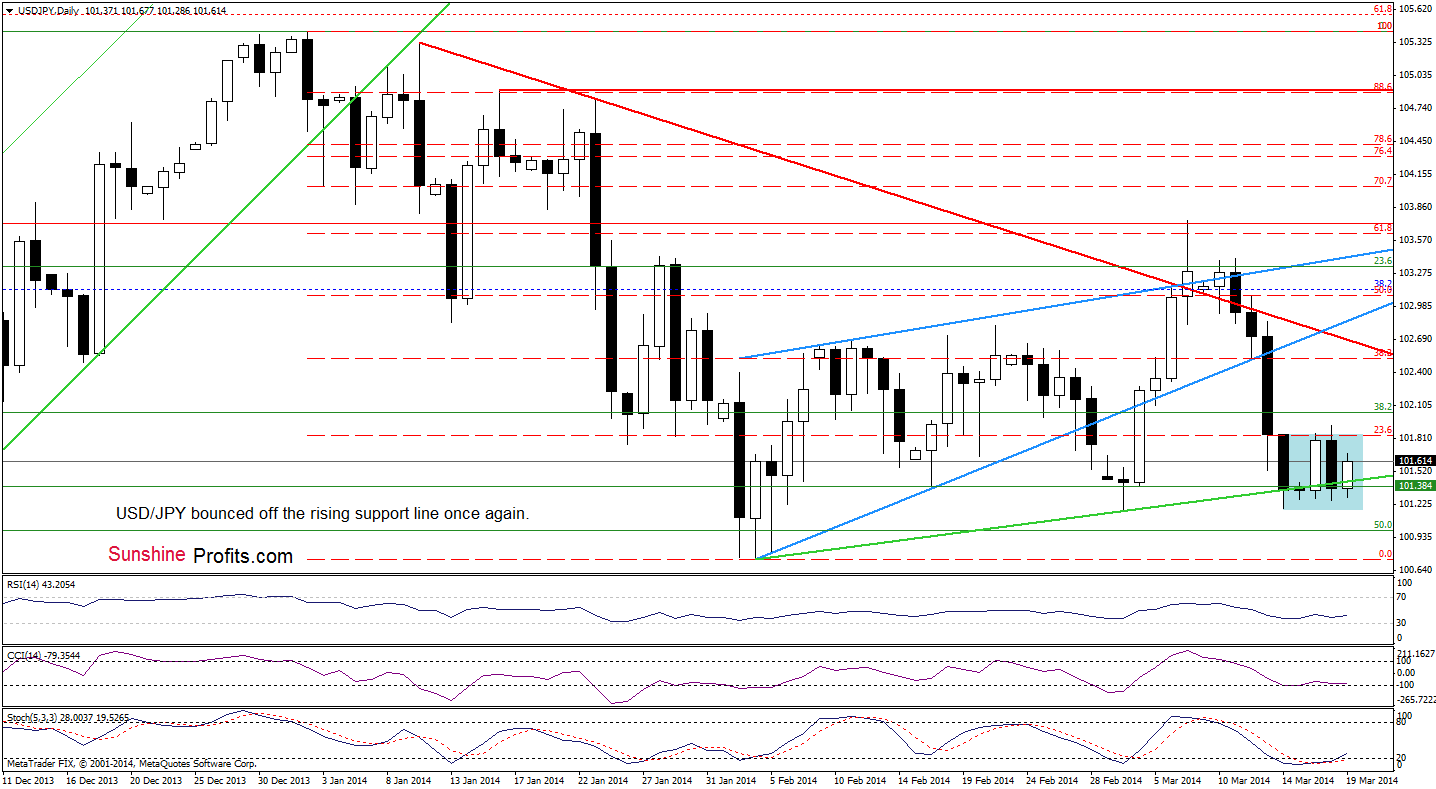
As you see on the above chart, USD/JPY rebounded after a small drop below the green support line. If the buyers do not give up, we may see further improvement (similarly to what we saw on Monday) and the initial upside target will be yesterday’s high, which corresponds to the 23.6% Fibonacci retracement based on the entire recent decline. If this resistance level is broken (which is quite possible when we factor in the current position of the indicators), we may see an increase to the 38.2 Fibonacci retracement (which corresponds to the red declining resistance line at the moment).
Very short-term outlook: mixed
Short-term outlook: mixed
MT outlook: bullish
LT outlook: bearish
Trading position (short-term): In our opinion no positions are justified from the risk/reward perspective at the moment. We will keep you informed should anything change, or should we see a confirmation/invalidation of the above.
USD/CAD
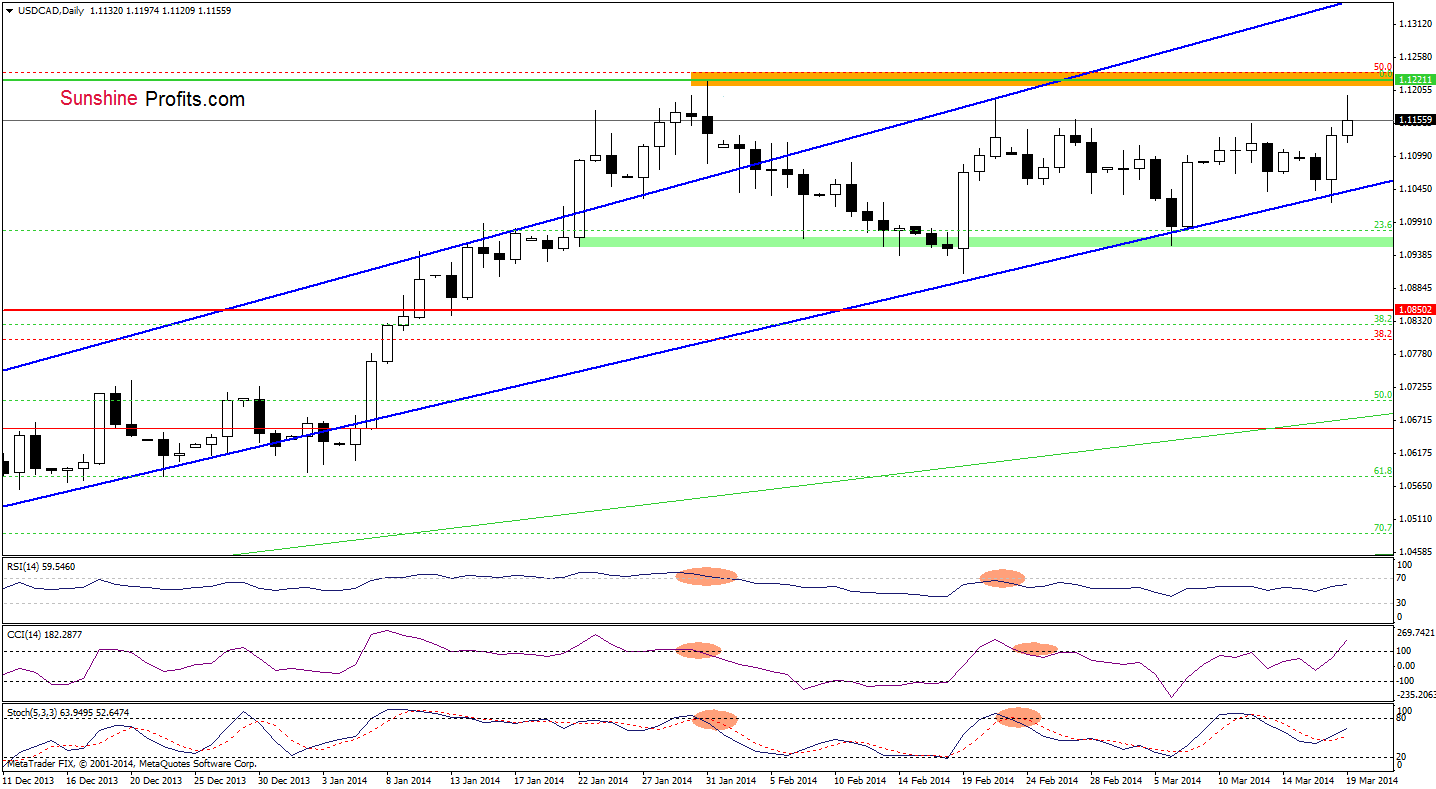
Looking at the above chart, we see that USD/CAD extended gains and approached the 2014 high. If the proximity to this resistance level encourages sellers to act, we may see a pullback in the near future. However, taking into account the current position of the indicator, it seems that further improvement is more likely. If this is the case the first upside target will be the 50% Fibonacci retracement around 1.1234. If this resistance zone is broken, the next upside target will be the upper line of the rising trend channel.
Very short-term outlook: mixed with bullish bias
Short-term outlook: mixed
MT outlook: bullishv
LT outlook: bearish
Trading position (short-term): In our opinion no positions are justified from the risk/reward perspective. We will keep you informed should anything change, or should we see a confirmation/invalidation of the above.
USD/CHF
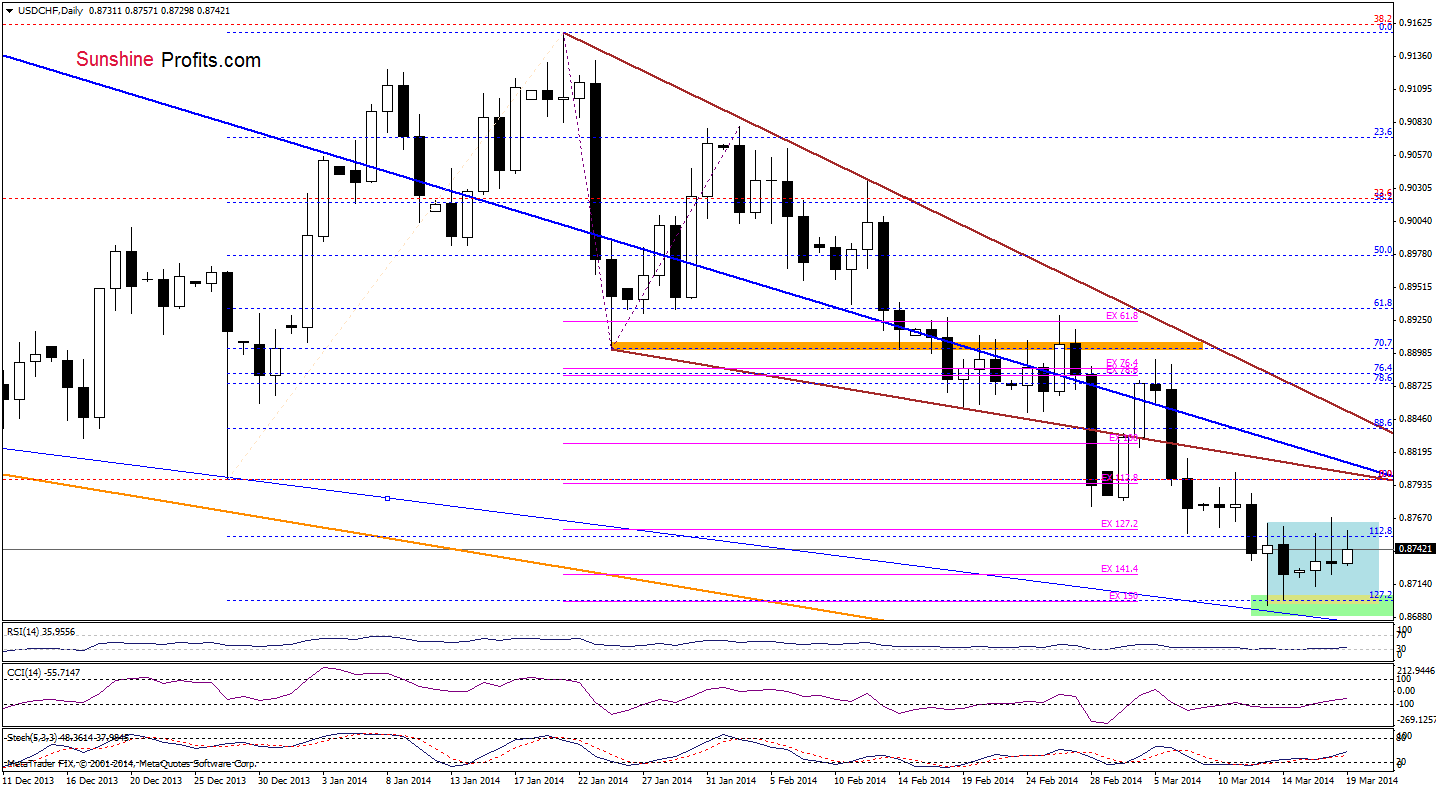
Looking at the above chart, we see that the situation hasn’t changed much as USD/CHF remains between Thursday high and low. If the pair climbs higher, the initial upside target will be the lower border of the declining wedge, which is slightly below the short-term declining resistance line (marked with blue). If this resistance zone is broken, the next target for the buyers will be the upper line of this formation. Please note that this scenario is reinforced by the position of the indicators, which generated buy signals and support buyers at the moment.
Very short-term outlook: mixed
Short-term outlook: bearish
MT outlook: bearish
LT outlook: bearish
Trading position (short-term): In our opinion, the space for further declines seems limited, so opening short positions at the moment is not a good idea. We will keep you informed should anything change, or should we see a confirmation/invalidation of the above.
AUD/USD
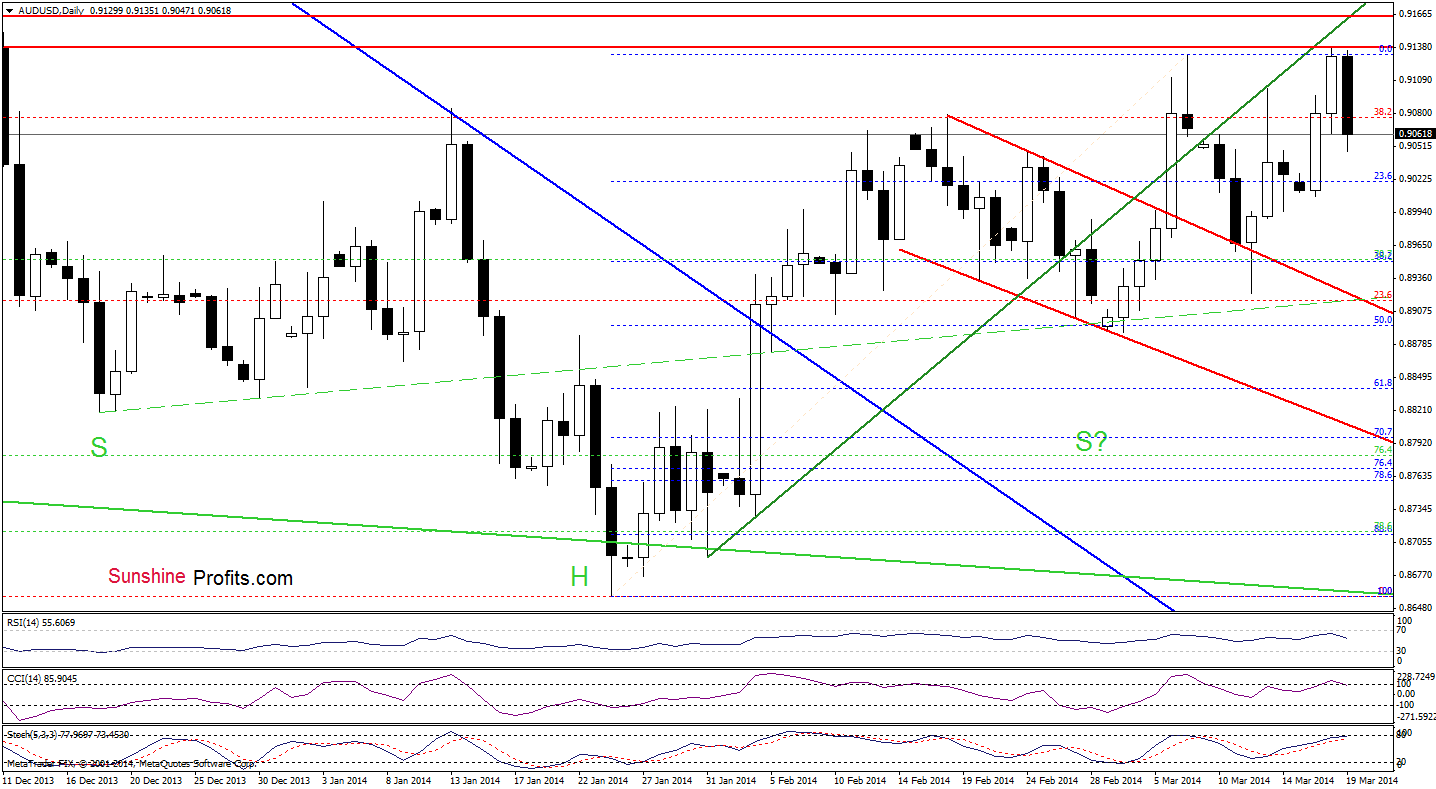
Looking at the above chart, we see that the combination of green resistance line and the 2014 high encouraged sellers to act, which resulted in a pullback earlier today. Looking at the current position of the indicators, we see that the RSI and CCI generated sell signals, which suggests that further deterioration is just around the corner. If this is the case, the initial downside target will be the 23.6% Fibonacci retracement based on the recent rally. If this support level is broken, we may see a drop to the 38.2% retracement, or even to the upper line of the declining trend channel (currently around 0.8923.
Very short-term outlook: mixed with bearish bias
Short-term outlook: bullish
MT outlook: bearish
LT outlook: bearish
Trading position (short-term): In our opinion, opening short positions at the following terms is a good idea: stop-loss order: 0.9166 and the initial price target: 0.8955. We will keep you informed should anything change as far as our opinion is concerned, or should we see a confirmation/invalidation of the above. The above is not an investment / trading advice and please note that trading (especially using leveraged instruments such as futures or on the forex market) involves risk.
Thank you.
Nadia Simmons
Forex & Oil Trading Strategist
Forex Trading Alerts
Oil Investment Updates
Oil Trading Alerts

