
Earlier today, the U.S. dollar declined to slightly above a seven-week low against the euro after the IFO German business climate index increased to 111.3 in February, the highest level since mid-2011. However , in the following hours the greenback erased some losses against the common currency. What happened with other currency pairs? What is their current outlook? We invite you to read our today's Forex Trading Alert.
In our opinion the following forex trading positions are justified - summary:
- EUR/USD: short after a drop below 1.3684 (a stop-loss order: 1.3773, a downside price target: 1.3600)
- GBP/USD: none
- USD/JPY: none
- USD/CAD: short (stop-loss order: 1.1223, an initial price target: 1.0953)
- USD/CHF: none
- AUD/USD: none
EUR/USD
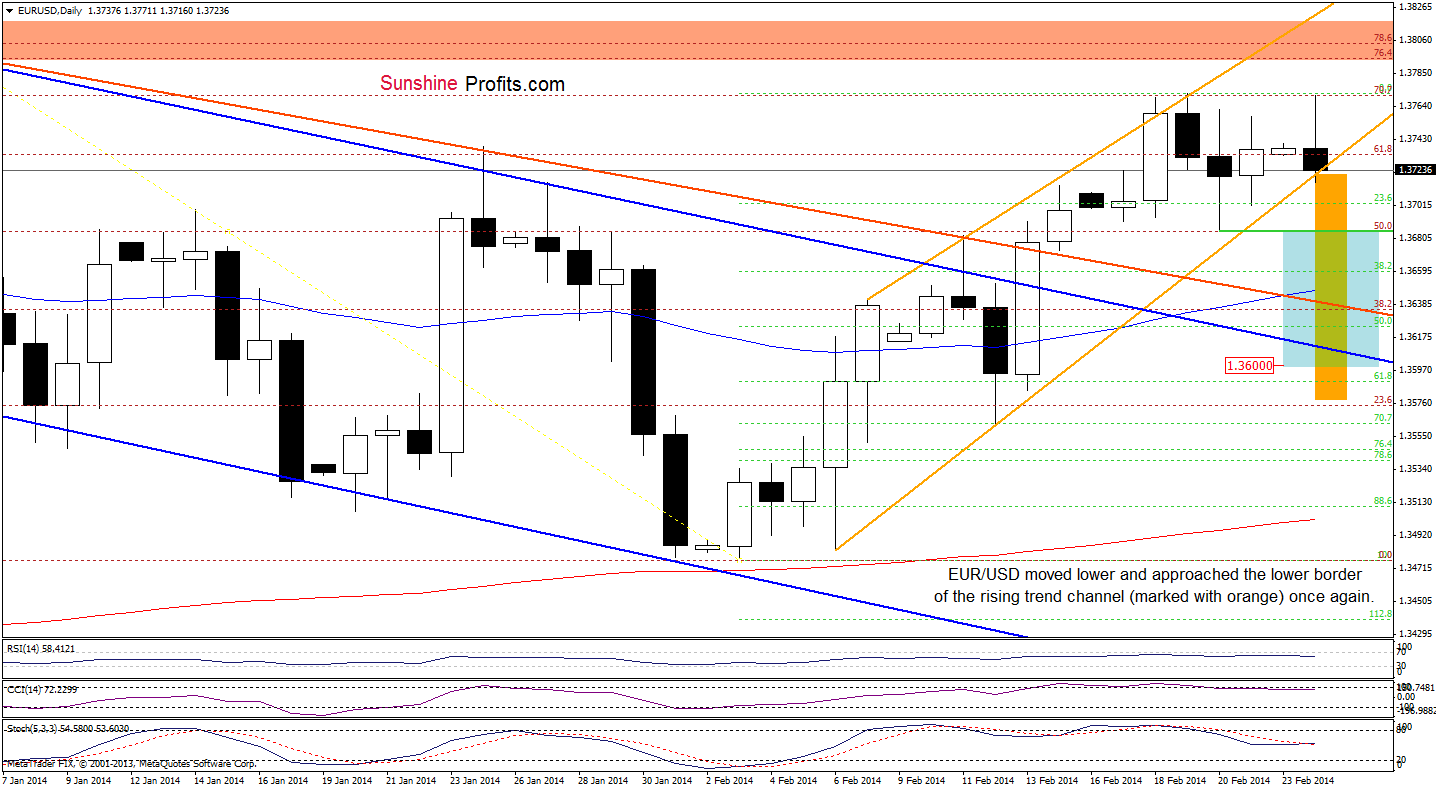
Earlier today, EUR/USD moved higher and almost touched the February high. Despite this improvement, a resistance level created by the monthly high successfully stopped further growth and the pair reversed. With today’s downswing, the exchange rate dropped to the lower border of the rising trend channel (marked with orange). At this point, we should consider two scenarios. If this support encourages buyers to act, we may see another attempt to climb above the February high. On the other hand, if this support line is successfully broken, we may see a decline even to around 1.3580, where the price target for the pattern is (please note that it corresponds to a height of the trend channel). More importantly, if the pair drops below the Feb. 20 low, we will likely see a post double top decline. In this case, the price target for the sellers will be around 1.3600 (marked with a light blue rectangle). From this perspective, in both cases we will likely see a decline below the upper border of the declining trend channel (marked with blue), which will be a strong negative signal that could trigger further deterioration.
As a reminder, the upper line of the rising trend channel is still reinforced by the medium-term support/resistance line (marked with brown on the weekly chart below).
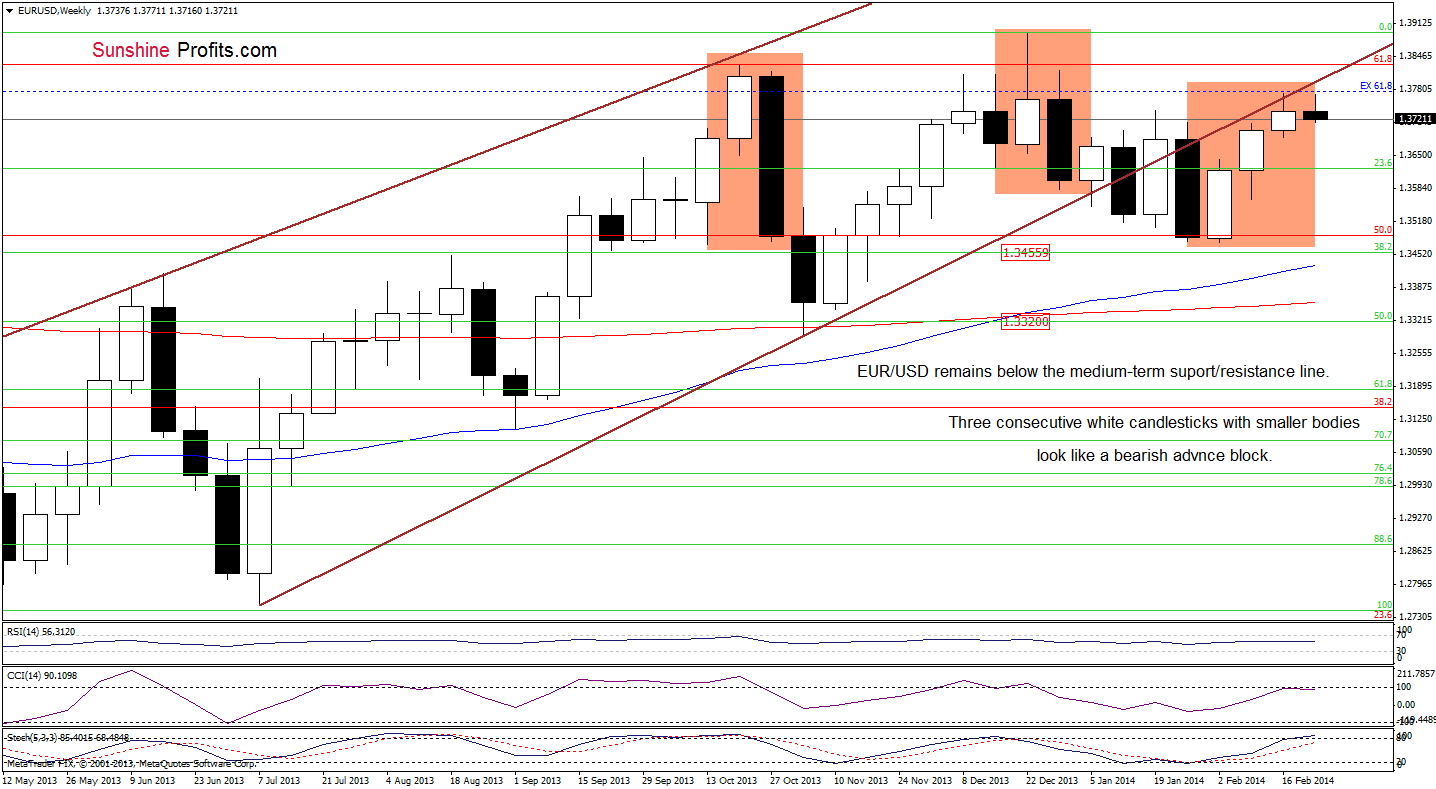
Looking at the above chart, we see that the recent white candlesticks have visibly smaller bodies. Such pattern remains a bearish advance block, which alerts traders to the weakness of the uptrend. Additionally, the CCI and Stochastic Oscillator reached their highest levels since late December, which suggests that we may see a bigger correction in the coming week (or weeks).
Very short-term outlook: mixed
Short-term outlook: mixed
MT outlook: mixed
LT outlook: bearish
Trading position (short-term): In our opinion, opening short positions after a drop below 1.3684 will be a good idea justified from the risk/reward perspective. In this case, a stop-loss order will be at 1.3773 and a downside price target will be at 1.3600. We will keep you informed should anything change, or should we see a confirmation/invalidation of the above.
GBP/USD
Quoting our last Forex Trading Alert:
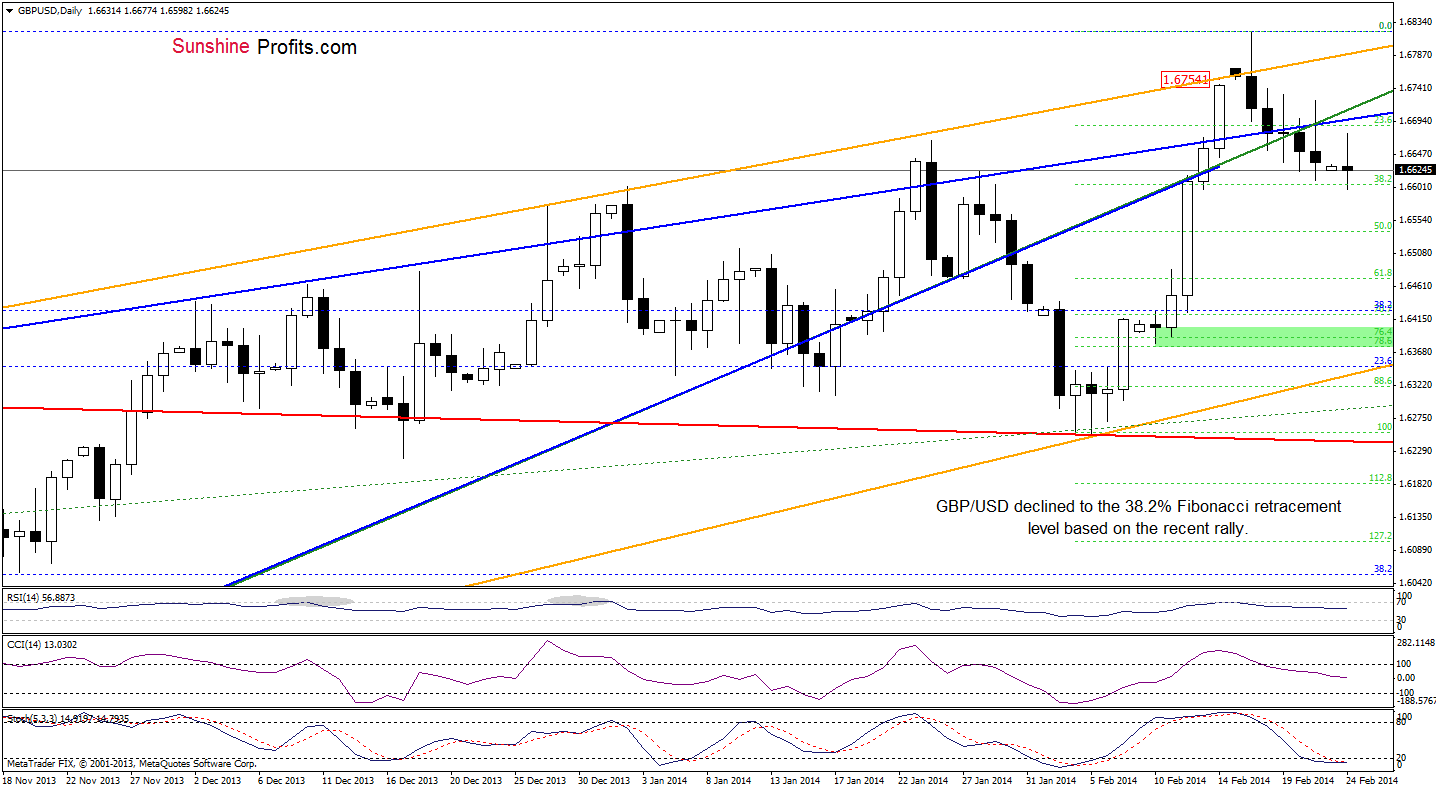
(…) the pair declined to the 38.2% Fibonacci retracement level based on the recent rally. (…) if GBP/USD drops below this level, we will likely see further deterioration (especially if the exchange rate closes the day below the lower border of the rising wedge once again). If this is the case, the nearest support level will be the next Fibonacci retracement.
As you see on the above chart, the pair dropped below the 38.2% Fibonacci retracement level earlier today, which is a negative signal. Additionally, the exchange rate closed three times in a row below the lower border of the rising wedge, which means that the breakdown below this support line is confirmed. All the above provide us with bearish implications and suggest that further deterioration is likely to be seen. Nevertheless, we should keep in mind that the Stochastic Oscillator is overbought and a pause before further declines should not surprise us.
Very short-term outlook: bearish
Short-term outlook: mixed
MT outlook: mixed
LT outlook: mixed
Trading position (short-term): In our opinion no positions are justified from the risk/reward perspective at the moment. We will keep you informed should anything change, or should we see a confirmation/invalidation of the above.
USD/JPY
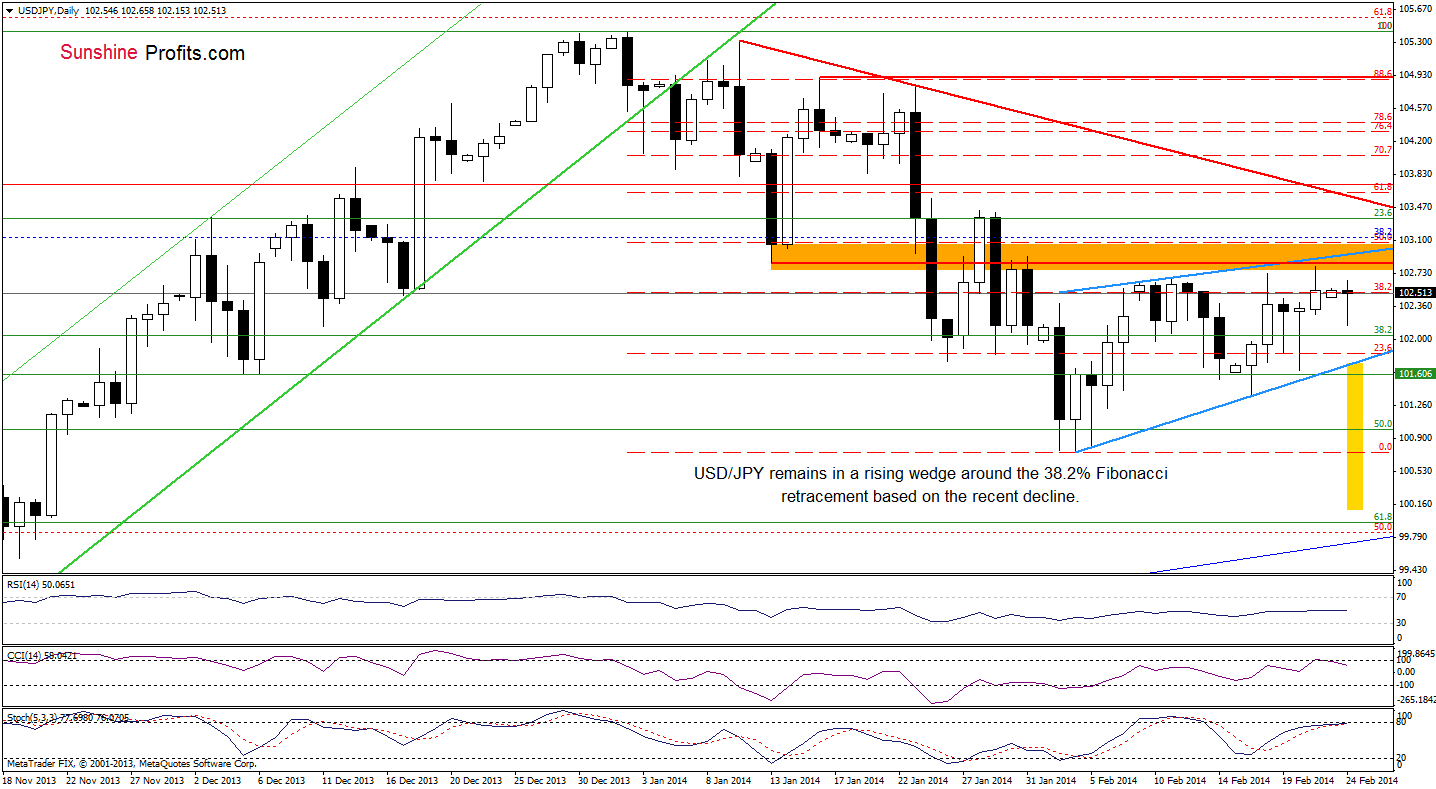
As you see on the above chart, the situation hasn’t changed much as USD/JPY remains around the 38.2% Fibonacci retracement level (based on the recent decline). Additionally, the pair is still trading in the rising wedge (marked with light blue). From this perspective, as long as there is no breakout above the upper line (or a breakdown below the lower border) a bigger upswing (or downswing) is not likely to be seen. Please note that the upper line is currently reinforced by a resistance zone created by the Jan.13 low and Jan.31 high (marked with orange). If this resistance is broken, we will likely see an upward move to at least the declining resistance line based on the Jan.10 and Jan.23 highs (marked with red). However, if this strong resistance encourages sellers to act, we will see a drop to the lower border of the rising wedge in the near future. If the pair drops below this important support line, we will probably see a re-test of the strength of the February low. At this point it’s worth noting that the price target after a breakdown is a bit lower than the monthly low and we marked it with a yellow rectangle. Looking at the position of the indicators, we see that the CCI generated a sell signal and Stochastic Oscillator is close to doing it. So, a bearish scenario is more likely at the moment.
Very short-term outlook: mixed
Short-term outlook: mixed with bearish bias
MT outlook: bullish
LT outlook: bearish
Trading position (short-term): In our opinion, the situation is too unclear to go short or long at the moment. So, no positions are justified from the risk/reward perspective. We will keep you informed should anything change, or should we see a confirmation/invalidation of the above.
USD/CAD
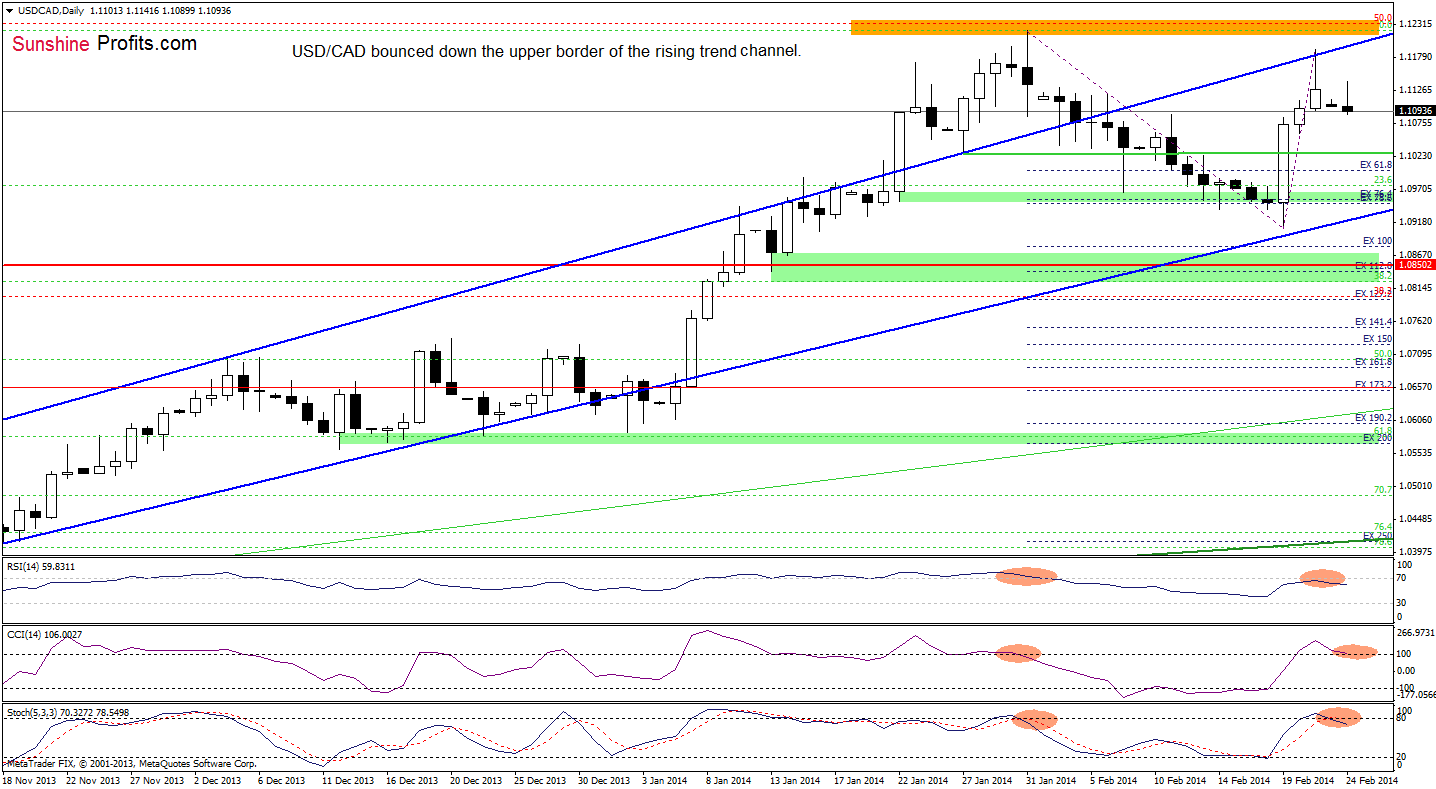
Quoting our previous Forex Trading Alert:
(…) USD/CAD extended gains (…) and reached the upper line of the rising trend channel. In our last Forex Trading Alert, we wrote that the space for further growth could be limited by this important resistance line in the coming days. If this is the case, we may see a decline to the lower line of the rising trend channel in the coming week. However, we should keep in mind that although the indicators are overbought, they didn’t generate sell signals.
Looking at the above chart, we see that the pair gave up the gains and declined earlier today. With this downswing, the exchange rate dropped below Friday’s low and all indicators generated sell signals. Please note that we saw similar price action at the end of January. If history repeats itself once again, we will likely see further deterioration in the coming day (or days). As mentioned earlier, the downside price target for the sellers would be the lower line of the rising trend channel (currently around 1.0923).
Very short-term outlook: mixed with bearish bias
Short-term outlook: mixed
MT outlook: bullish
LT outlook: bearish
Trading position (short-term): In our opinion opening short positions at the following terms is a good idea: stop-loss order: 1.1223, and an initial price target: 1.0953. We will keep you informed should anything change, or should we see a confirmation/invalidation of the above.
USD/CHF
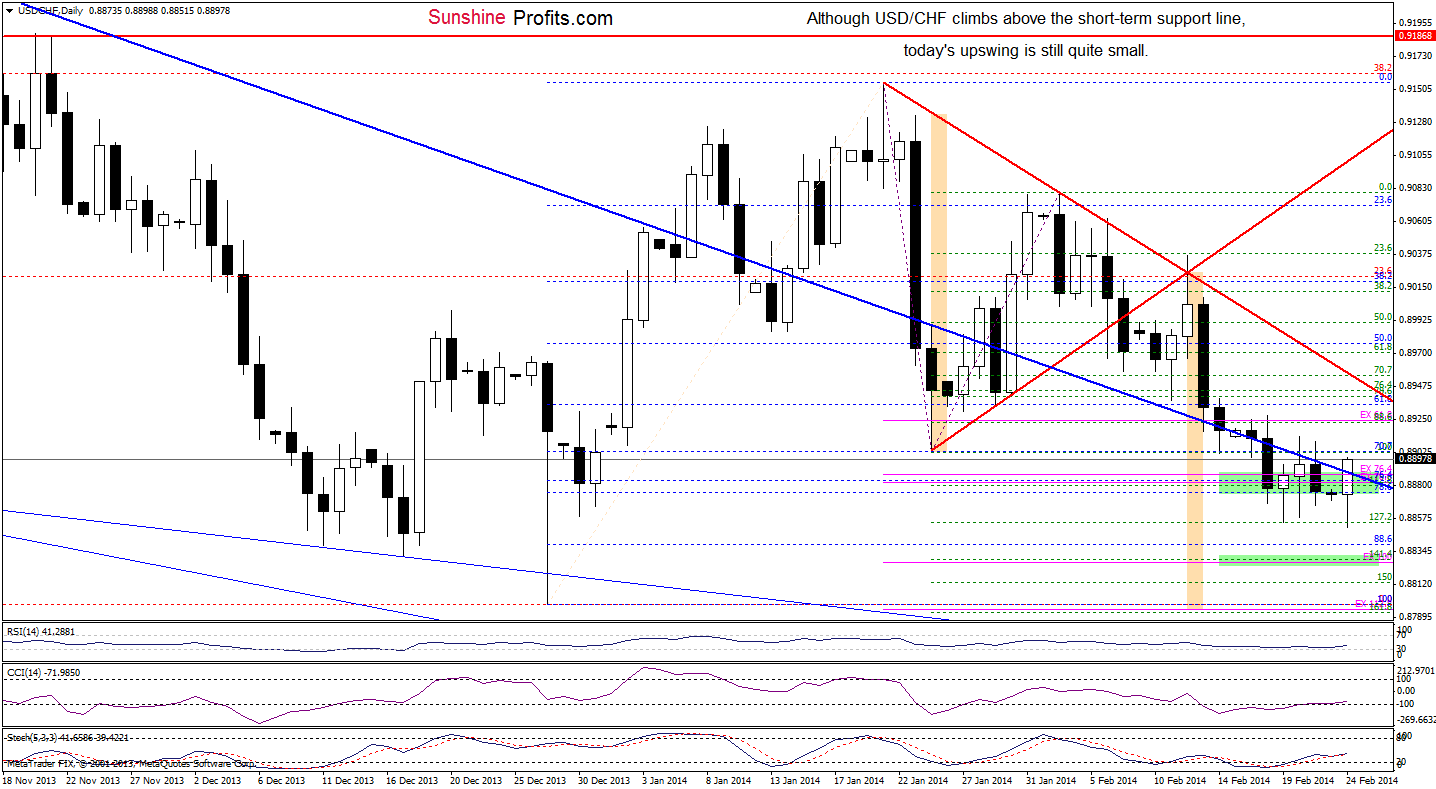
In our last Forex Trading Alert, we wrote:
(…) USD/CHF still remains between a support zone created (…) and the short-term declining support/resistance line (marked with blue) (…) if this line encourage the sellers to act, we will likely see a re-test of the strength of the support zone.
As you see on the above chart, we noticed such price action earlier today. However, although USD/CHF extended losses and hit a fresh monthly low, the pair rebounded sharply and climbed above the short-term declining support/resistance line (marked with blue). If the buyers manage to push the exchange rate higher and the pair closes the day above this major resistance line (invalidating the breakdown below this important line), we may see further improvement in the coming day (or days). At this point it’s worth noting that buy signals generated by the indicators remain in place, supporting the bullish case. Nevertheless, we should keep in mind that despite today’s increase, the breakout above the short-term declining support/resistance line is not confirmed at the moment and the very short-term outlook remains mixed. So, another attempt to move lower should not surprise us.
Very short-term outlook: mixed
Short-term outlook: mixed
MT outlook: bearish
LT outlook: bearish
Trading position (short-term): In our opinion, the situation is too unclear to go long as there is no confirmed invalidation of the breakdown below the short-term declining support line. We will keep you informed should anything change, or should we see a confirmation/invalidation of the above.
AUD/USD
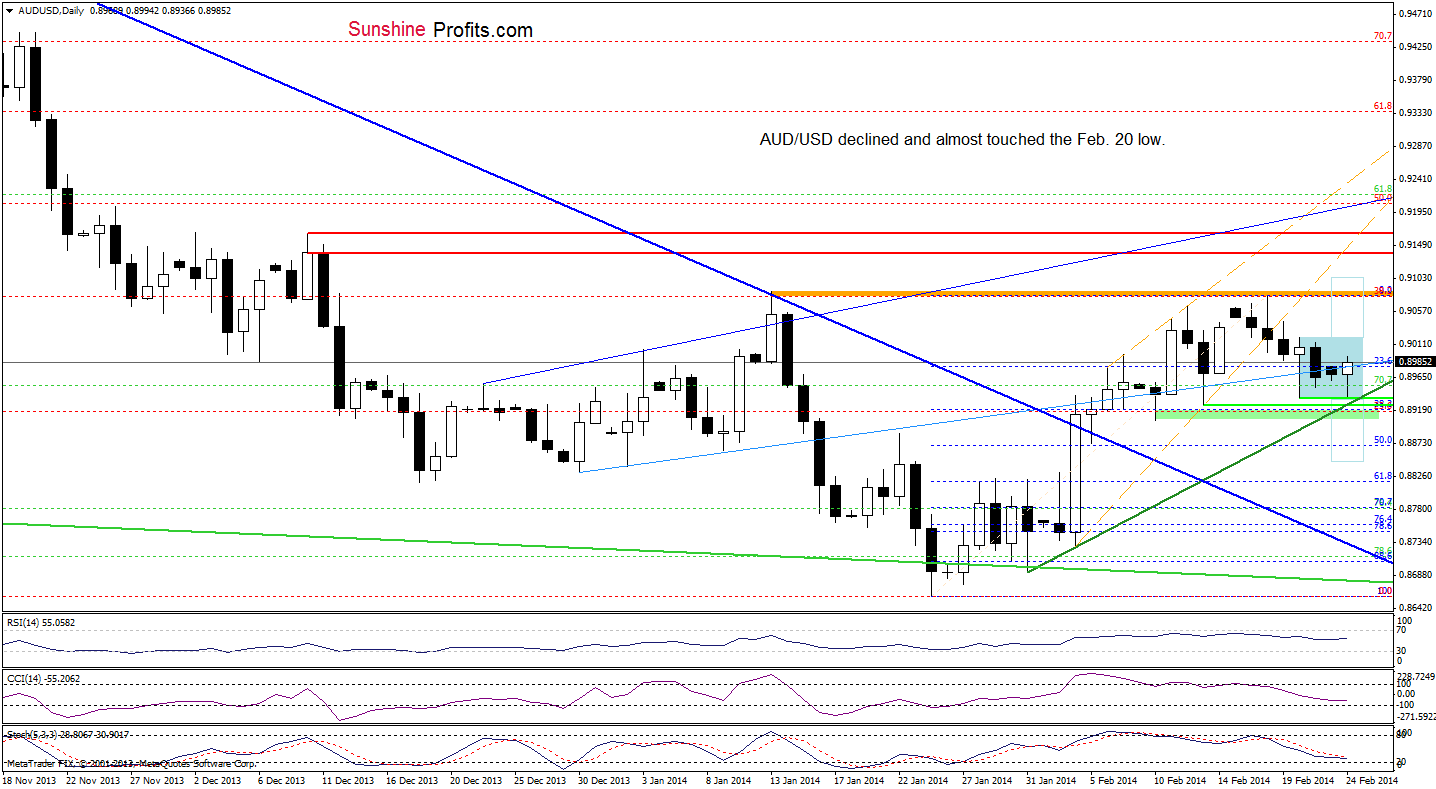
Looking at the above chart, we see that AUD/USD declined and almost touched the Feb. 20 low. With this drop, the pair also approached the very short-term rising support line (marked with dark green). If this support area encourages buyers to act, we may see a corrective upswing in the coming day (or days). Additionally, if the pair increases above the upper line of a consolidation range (marked with a light blue rectangle), we could see a post double bottom rally. If this is the case, the upside price target would be slightly above the February high (around 0.9104). Nevertheless, before the buyers realize this pro-growth scenario they will have to push the exchange rate above the 38.2% Fibonacci retracement level, which successfully stopped increases earlier this month.
Before we summarize this currency pair, please note that the current correction is similar to the previous one, which means that the very short-term uptrend is not threatened at the moment.
Very short-term outlook: mixed
Short-term outlook: mixed with bullish bias
MT outlook: bearish
LT outlook: bearish
Trading position (short-term): In our opinion, if the pair drops below the February 10 low, we might consider opening short positions. However, as long as AUD/USD remains between this level and the 38.2% Fibonacci retracement level, no positions are justified from the risk/reward perspective. We will keep you informed should anything change, or should we see a confirmation/invalidation of the above.
Thank you.
Nadia Simmons
Forex & Oil Trading Strategist
Forex Trading Alerts
Oil Investment Updates
Oil Trading Alerts

