
Earlier today, the U.S. currency declined against most of major currencies as concerns over economic growth in emerging markets weighed on investor sentiment ahead of the Federal Reserve’s policy statement later in the day. What impact did these circumstances have on major currency pairs? If you want to know our take on this question, we invite you to read our today's Forex Trading Alert.
Forex Trading Positions - Summary:
EUR/USD
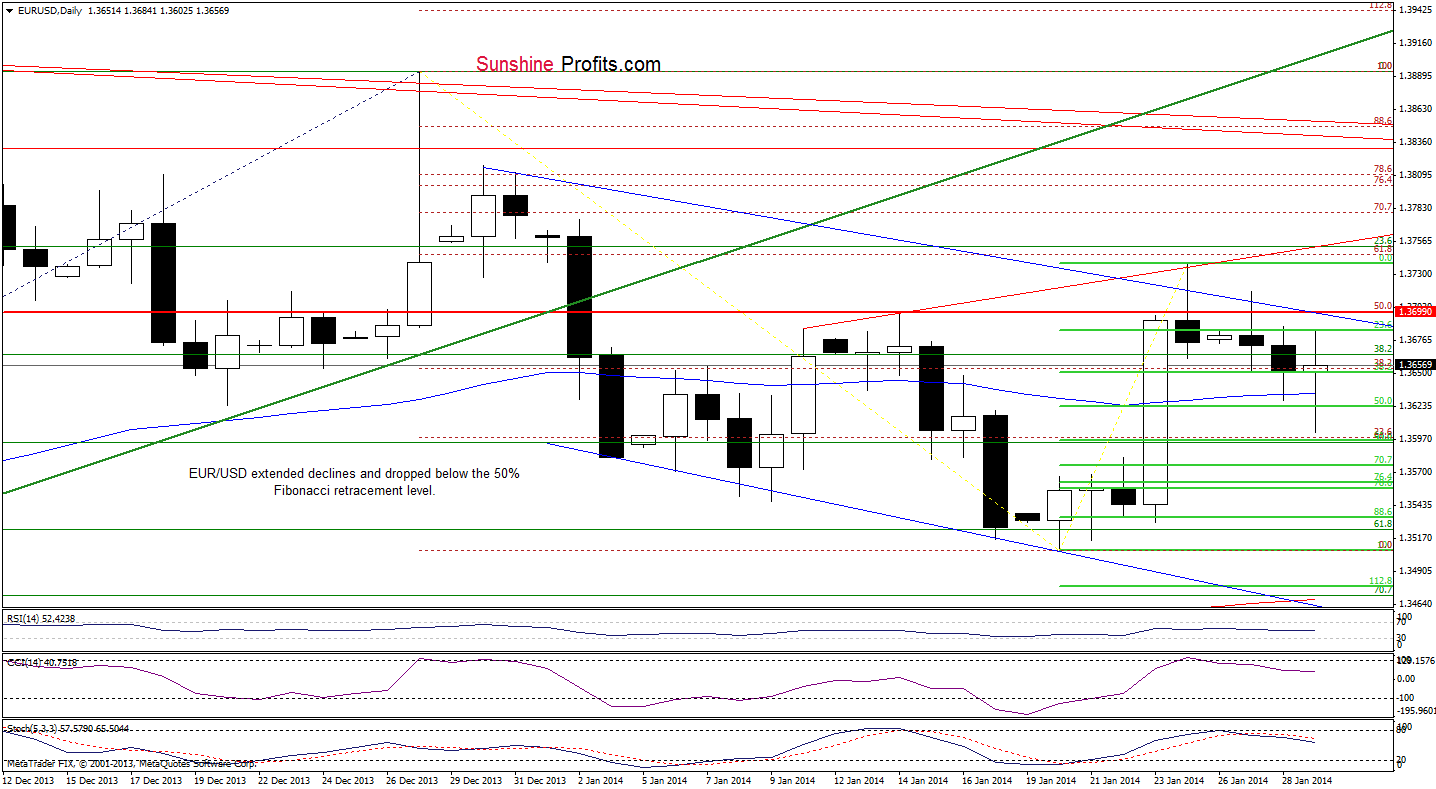
Looking at the above chart, we see that EUR/USD extended declines and approached the 61.8% Fibonacci retracement level (based on the recent rally) earlier today. The proximity to this strong support level encouraged the buyers to act and resulted in a sharp upswing. Although the pair reversed and came back above the 50-day moving average, it still remains below the upper line of the declining trend channel (marked with blue). As you see on the daily chart, this resistance line successfully stopped recent attempts to reach the 61.8% Fibonacci retracement level based on the entire Dec.-Jan. decline. Additionally, sell signals generated by the CCI and Stochastic Oscillator remain in place supporting the bearish case.
Very short-term outlook: mixed
Short-term outlook: mixed
MT outlook: mixed
LT outlook: bearish
Trading position (short-term): we do not suggest opening any trading positions at the moment. We will keep you informed should anything change, or should we see a confirmation/invalidation of the above.
GBP/USD
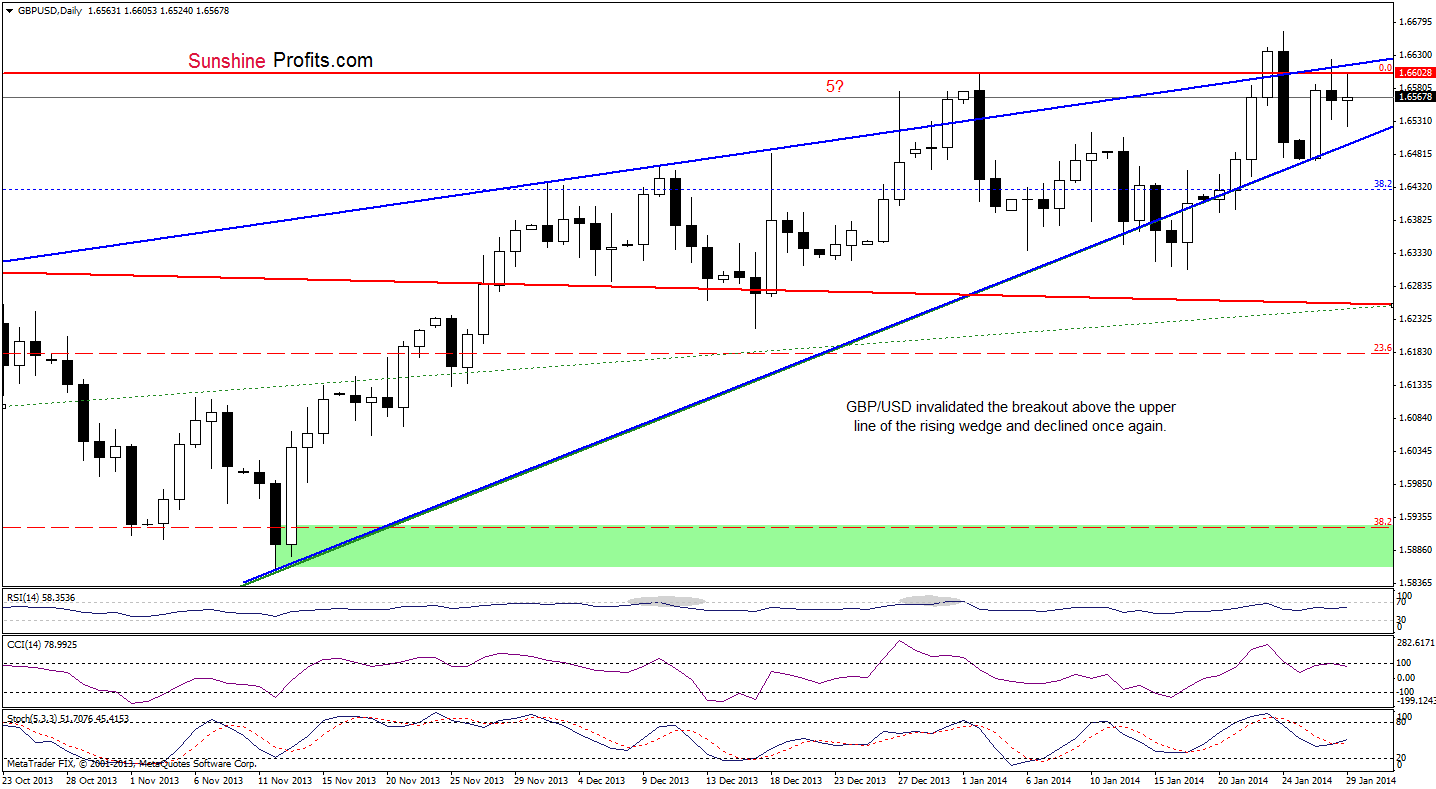
Looking at the above chart, we clearly see that the situation hasn’t changed much. Although GBP/USD approached the upper line of the rising wedge earlier today, the pair quickly reversed and declined below yesterday’s low. Despite this drop, GBP/USD remains in a rising wedge (marked with blue). Therefore, what we wrote in our last Forex Trading Alert remains up-to-date also today.
(…) from this perspective, it seems that as long as GBP/USD remains in a rising wedge (marked with blue), we won’t see bigger upside (or downside) move. However, taking into account the fact that the upper and lower border of the rising wedge approaching each other, it seems that a breakthrough is just around the corner.
Very short-term outlook: mixed with bearish bias
Short-term outlook: mixed
MT outlook: mixed
LT outlook: mixed
Trading position (short-term): we do not suggest opening any trading positions at the moment. We will keep you informed should anything change, or should we see a confirmation/invalidation of the above.
USD/JPY
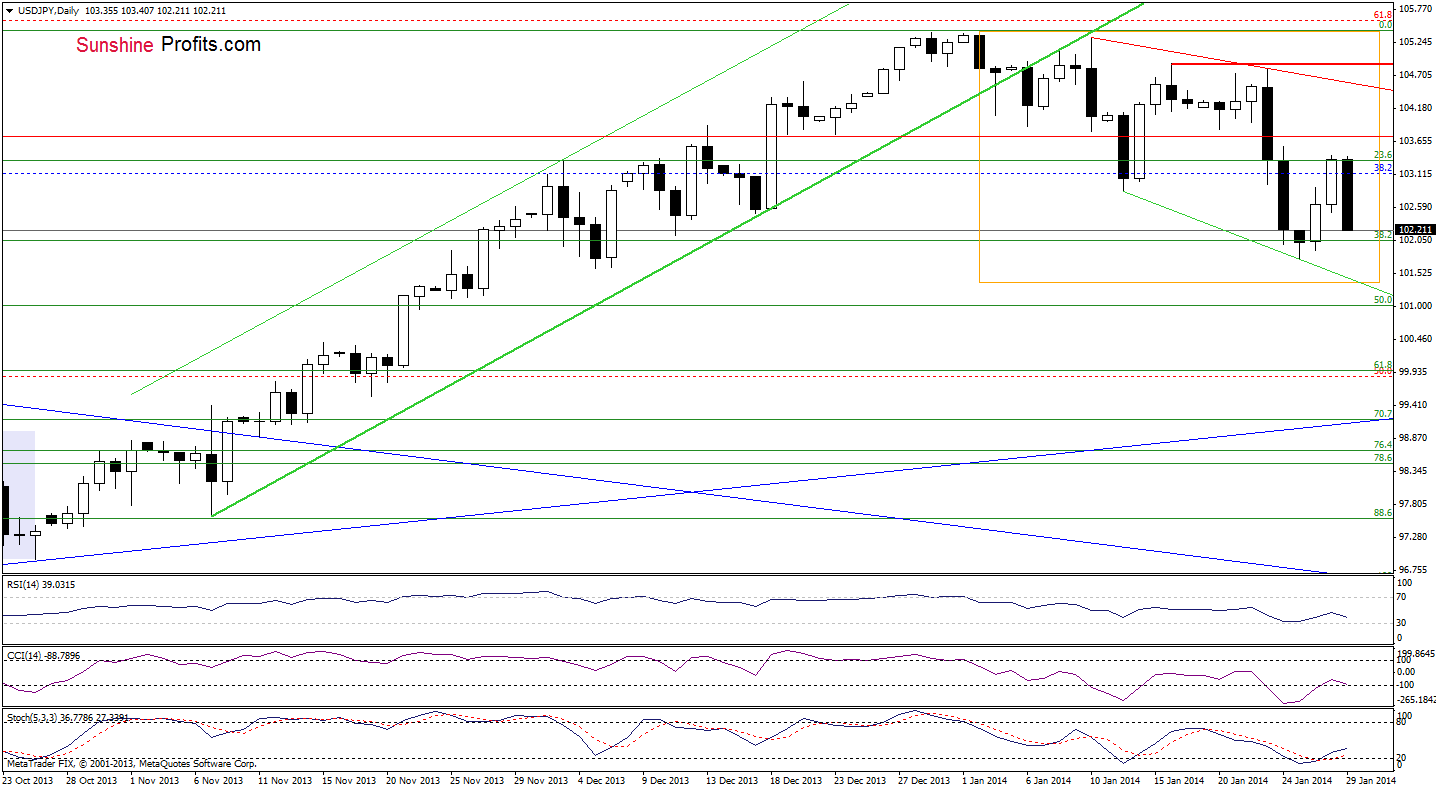
As you see on the above chart, although USD/JPY invalidated the breakdown below previous lows (which was a bullish signal) and almost reached its first upside target (Friday’s high), the pair gave up the gains and declined sharply earlier today. With this downswing USD/JPY erased most of recent increases and reached the 38.2% Fibonacci retracement level once again. If this support level (in combination with Monday’s low) encourages the buyers to act we will likely see a corrective upswing in the following hours. In this case, the upside target will be yesterday’s high. However, if the buyers fail, we will likely see further deterioration and the downside target for the sellers will be the next Fibonacci retracement level.
Very short-term outlook: mixed with bearish bias
Short-term outlook: mixed
MT outlook: bullish
LT outlook: bearish
Trading position (short-term): we do not suggest opening any trading positions at the moment. We will keep you informed should anything change, or should we see a confirmation/invalidation of the above.
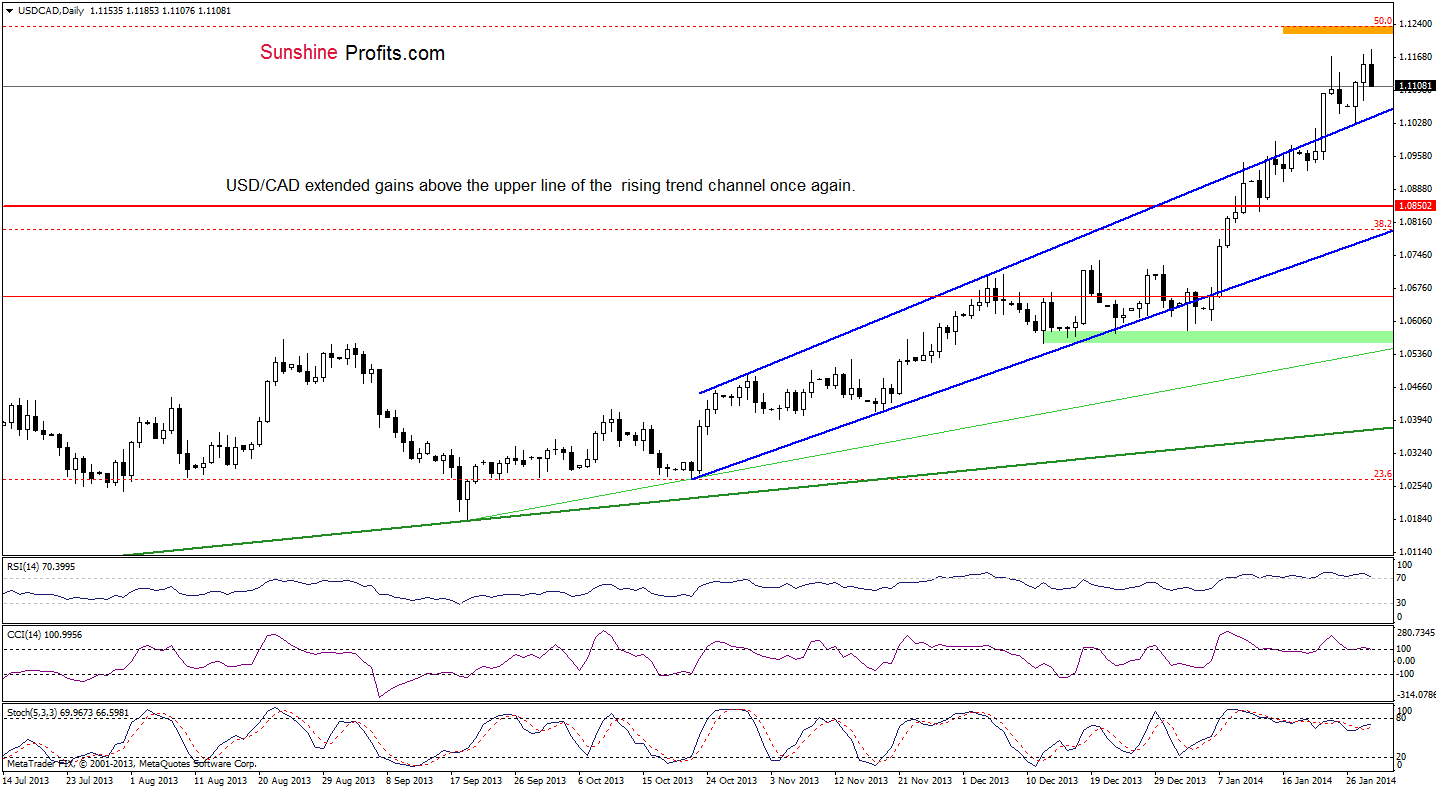
USD/CAD
Quoting our last Forex Trading Alert:
(…) USD/CAD bounced off the upper line of the rising trend channel (in our last Forex Trading Alert we emphasized that this strong support line keeps further declines in check) and erased 50% of earlier losses. This is a positive sign, which will likely trigger further improvement (at least) in the following hours and the first upside target will be the annual high at 1.1172.
As you see on the above chart, USD/CAD extended gains and not only reached the 2014 high, but also hit a fresh four and a half year high and approached the 50%Fibonacci retracement level (based on entire 2009-2011 decline). Despite this growth, we should keep in mind that there are negative divergences between indicators and the exchange rate, which suggest that correction is just around the corner. Additionally, the CCI and RSI are still overbought, which supports the bearish case.
Very short-term outlook: mixed
Short-term outlook: bullish
MT outlook: bullish
LT outlook: bearish
Trading position (short-term): we do not suggest opening any positions at the moment. We will keep you informed should anything change, or should we see a confirmation/invalidation of the above.
USD/CHF
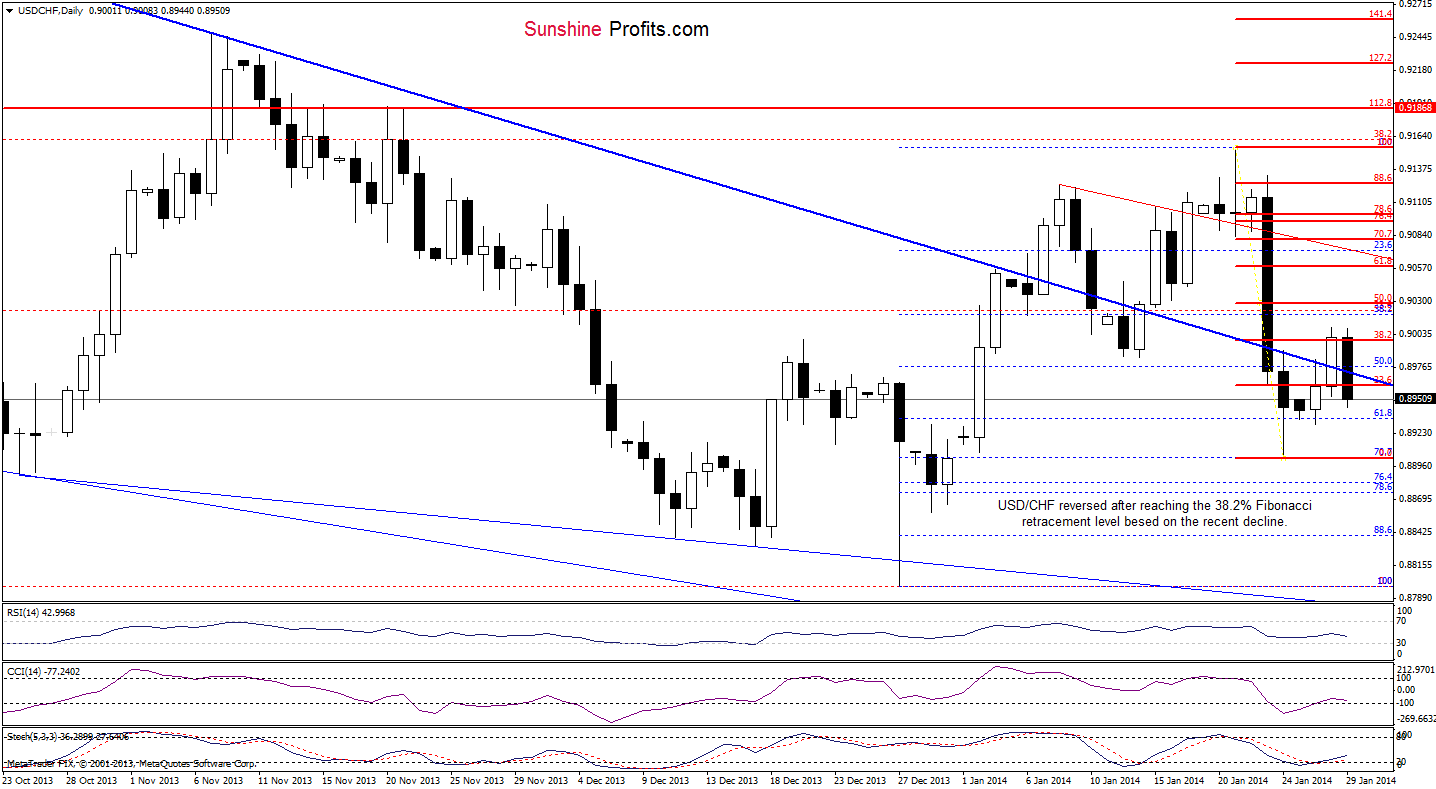
On the above chart, we see that although the pair broke above Friday’s high (which was also the upper border of a consolidation range) and the short-term declining support/resistance line (marked with blue), this improvement was only temporary. Earlier today, USD/CHF dropped below the 38.2% Fibonacci retracement level (based on the recent decline) which triggered a sharp decline that pushed the pair below the short-term declining support/resistance line once again. This is a bearish signal and further deterioration should not surprise us – especially if the pair closes the day below this resistance line.
Very short-term outlook: mixed with bearish bias
Short-term outlook: bearish
MT outlook: bearish
LT outlook: bearish
Trading position (short-term): we do not suggest opening any trading positions at the moment. We will keep you informed should anything change, or should we see a confirmation/invalidation of the above.
AUD/USD
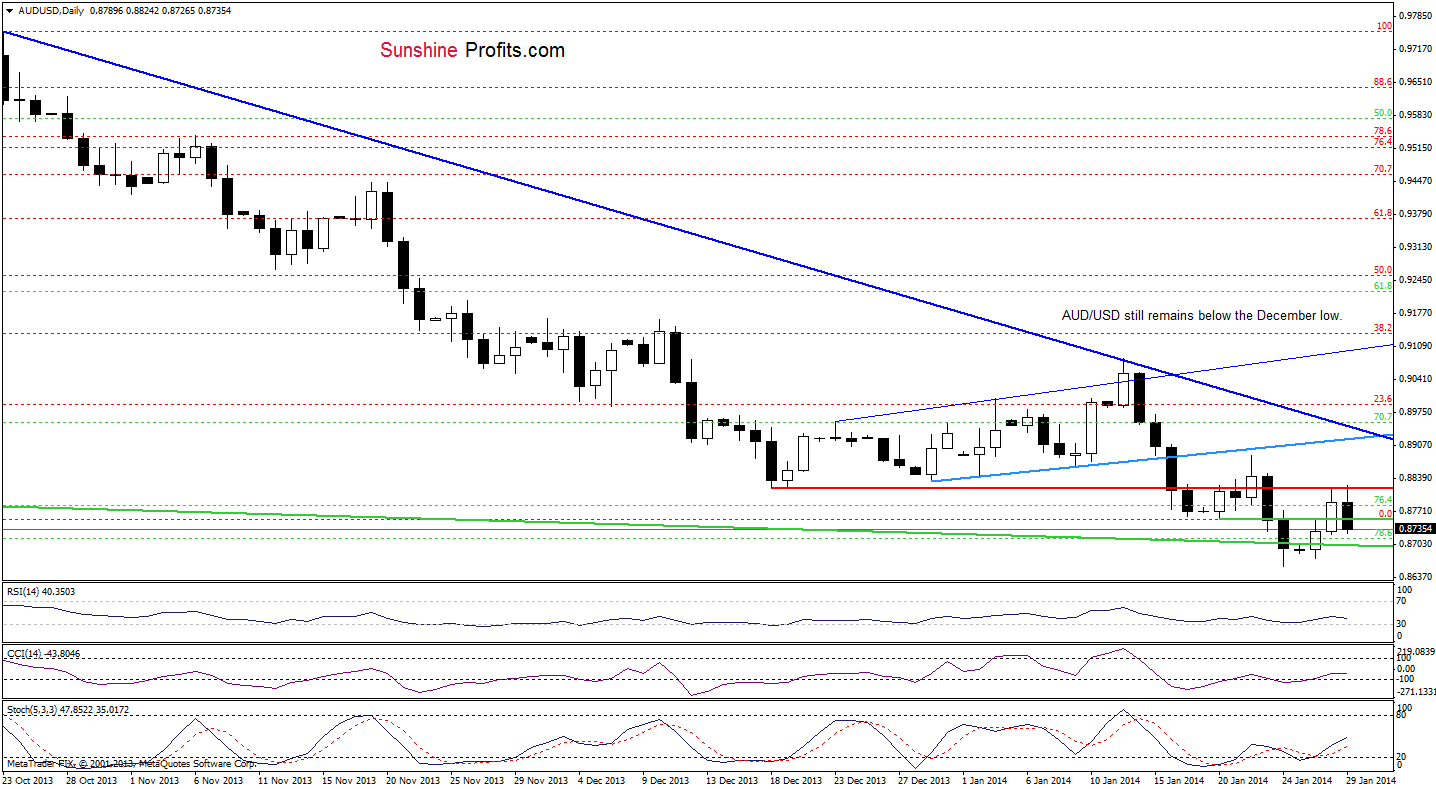
On the above chart, we see that the situation has deteriorated once again as AUD/USD gave up the gains after reaching its first upside target. As you see on the daily chart, the strong resistance zone created by December lows and Wednesday high successfully stopped further growth and triggered a downswing. From this perspective, we clearly see that what we wrote in our previous Forex Trading Alert is still up-to-date.
(…) it is still too early to say that the worst is behind the holders of the Australian currency as the pair remains below this resistance zone and another downswing can’t be rule out.
(…) in our opinion, the first signal of an improvement will be an increase above the very short-term blue rising resistance line and a breakout above the short-term declining resistance line based on the Oct.23 and Jan.13 highs (marked with dark blue).
Very short-term outlook: mixed with bearish bias
Short-term outlook: bearish
MT outlook: bearish
LT outlook: bearish
Trading position (short-term): we do not suggest opening any positions at the moment. We will keep you informed should anything change, or should we see a confirmation/invalidation of the above.
Thank you.
Nadia Simmons
Forex & Oil Trading Strategist
Forex Trading Alerts
Oil Investment Updates
Oil Trading Alerts

