
Earlier today, the U.S. currency was steady against the euro, Swiss franc and yen. Meanwhile, the British pound extended gains after data showed that the U.K. unemployment rate fell to 7.1% in November (it was the largest drop in unemployment since 1997). Thanks to this news, the pound climbed to a three-week high against the greenback. Another currency that increased against the U.S. dollar was its Australian counterpart. The Australian dollar rebounded sharply after better-than-expected fourth quarter inflation data. What happened with our last currency pair? The greenback rose to a four-year highs against the Canadian dollar after the Bank of Canada left interest rates unchanged. What impact did these moves have on major currency pairs? If you want to know our take on this question, we invite you to read our today's Forex Trading Alert.
Forex Trading Positions - Summary:
- EUR/USD: short position (stop-loss level: 1.3699)
- GBP/USD: none
- USD/JPY: none
- USD/CAD: none
- USD/CHF: long position (stop-loss level: 0.8985)
- AUD/USD: none
EUR/USD
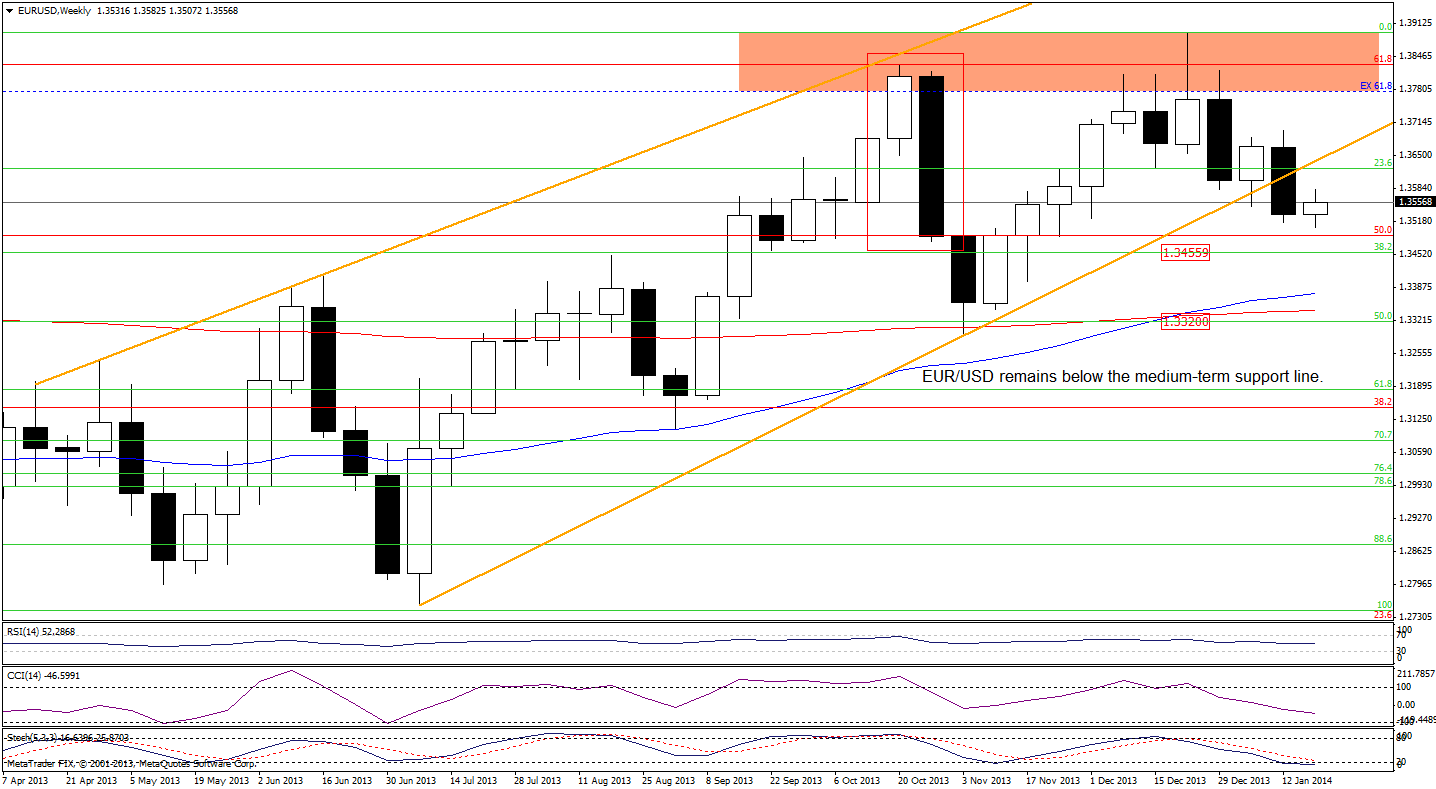
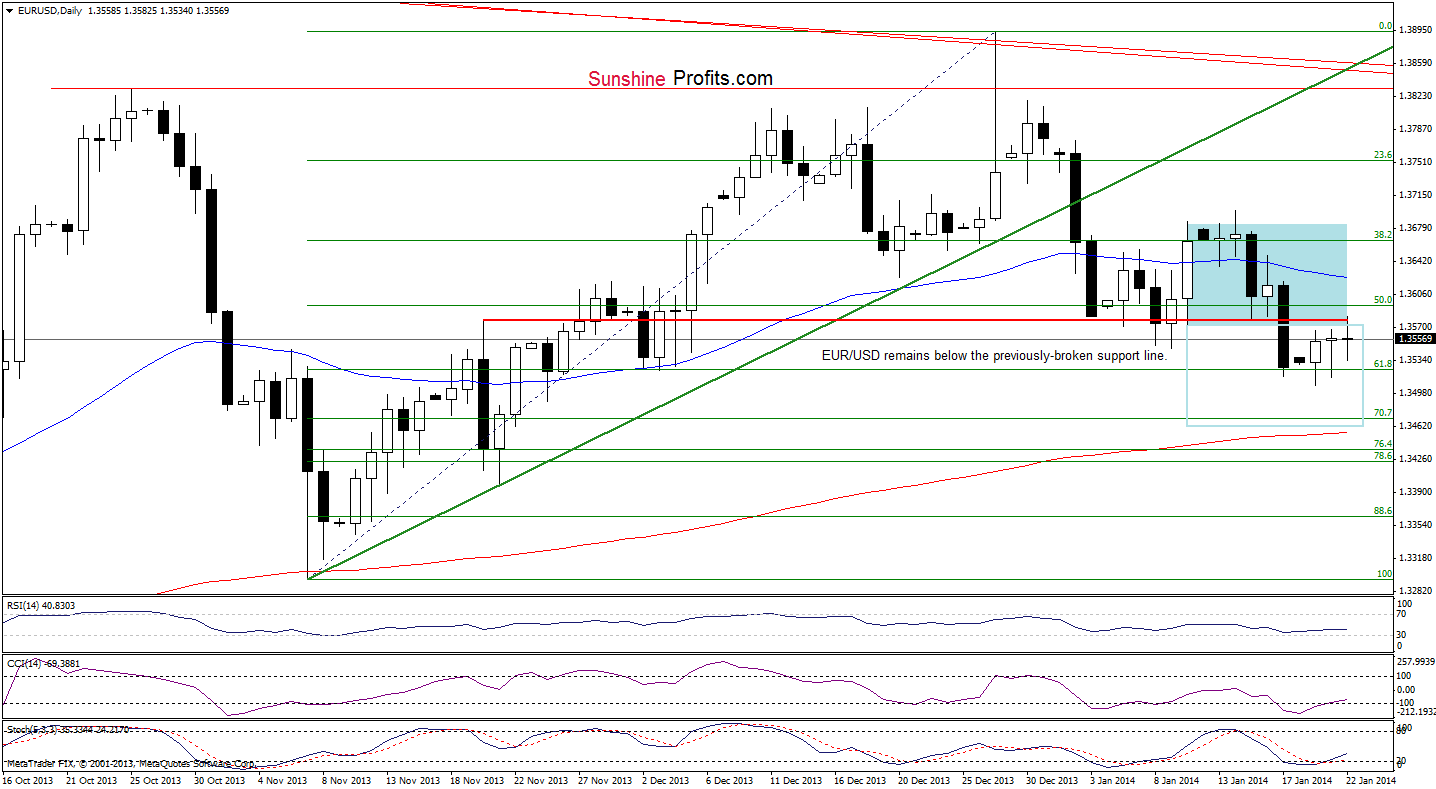
On the above charts, we see that the situation hasn’t changed much as EUR/USD still remains below the previously-broken lower border of the consolidation range (marked in blue) and the medium-term support/resistance line.
As you see on the daily chart, although the buyers tried to push the exchange rate higher (which resulted in an increase to the resistance level created by the lower border of the consolidation range), their attempt failed and the pair slipped once again. From this perspective, it seems that this increase may be nothing more than a verification of the breakdown. If this is the case, another downswing should not surprise us and the first price target will be Monday’s low (slightly below the 61.8% Fibonacci retracement level). If this support level encourages buyers, we may see another attempt to come back above the lower border of the consolidation range, but if it is broken, we will likely see further deterioration and the first downside target will be around 1.3457 (this level corresponds to the 38.2% Fibonacci retracement level based on the entire March-December rally).
Please note that as long as the pair doesn’t invalidate the breakdowns below lower border of the consolidation range and medium-term support/resistance line, further deterioration is likely to be seen. Additionally, a bearish engulfing pattern created by Thursday’s and Friday’s candlesticks pattern still supports sellers.
Very short-term outlook: bearish
Short-term outlook: bearish
MT outlook: mixed with bearish bias
LT outlook: bearish
Trading position (short-term): short. The stop-loss level for this position is at 1.3699. The first downside price target is around 1.3457. We will keep you informed should anything change, or should we see a confirmation/invalidation of the above.
GBP/USD
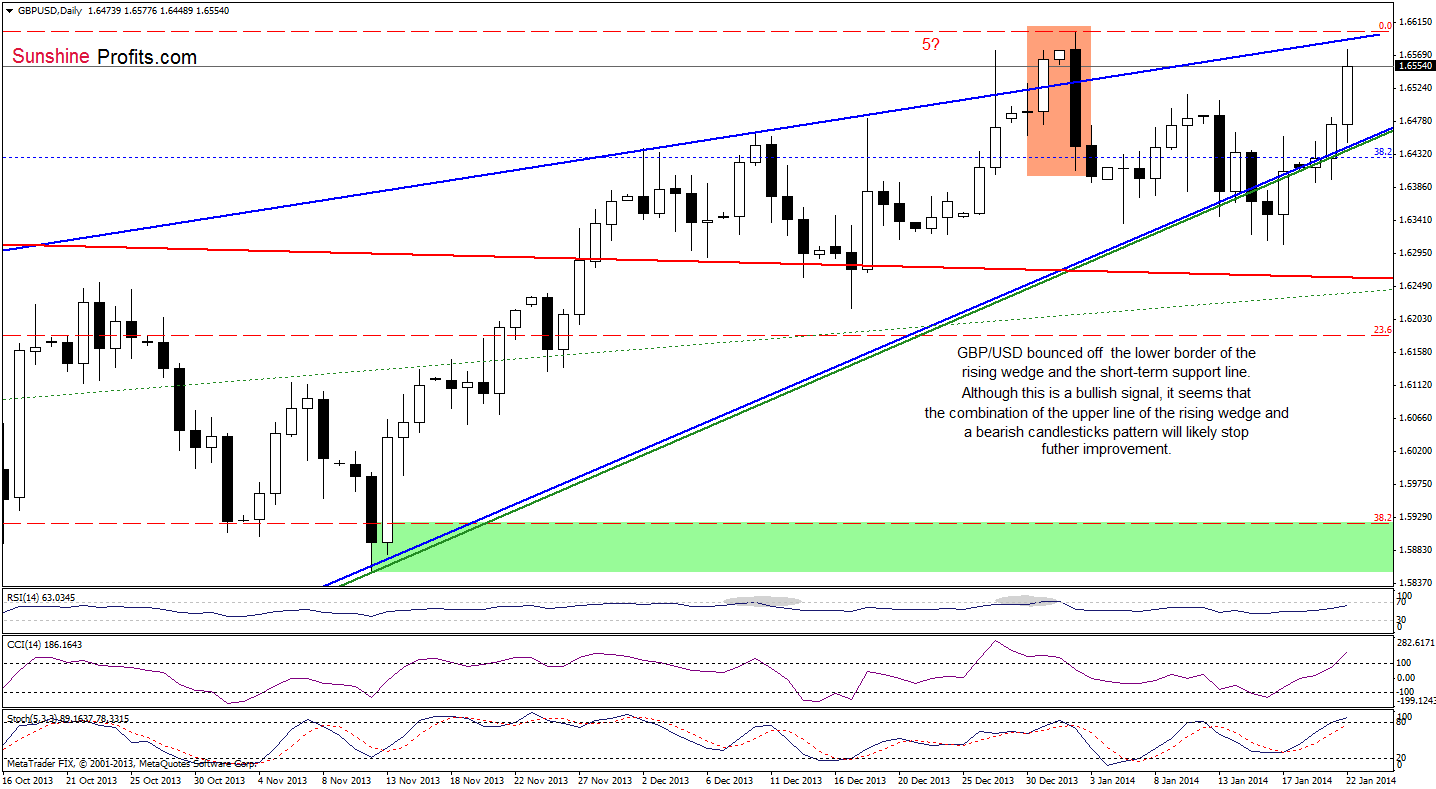
Looking at the above chart, we see that the situation has improved significantly as GBP/USD bounced off the lower border of the rising wedge and the short-term declining support line. Yesterday, the pair closed the day above these levels and invalidated the breakdown, which was a bullish signal that triggered further improvement during the European session earlier today. With this upswing, cable not only broke above the upper line of the consolidation range, but also approached the upper border of the rising wedge (marked with blue). Although this is a bullish signal, it seems that the combination of this resistance line and a bearish candlesticks pattern (marked with the orange rectangle) will likely pause or even stop further improvement. Taking this fact into account, it seems that the space for further growth is limited.
Very short-term outlook: bullish
Short-term outlook: mixed
MT outlook: mixed
LT outlook: mixed
Trading position (short-term): the short position in the GBP/USD pair was closed at 1.6515, which is where our stop-loss order was triggered. Thanks to the stop-loss order, the loss was small. It was certainly much smaller than the current gain on the long position in the USD/CHF pair, not to mention the positive results of the EUR/USD trade. Please note that thanks to the fact that we cover 6 currency pairs, the variability of returns on all of them (if one is trading all of them) is much smaller than if one simply bet on one pair's moves. In this case, we're seeing a loss being more than offset by gains on 2 other trades. Anyway, we'll keep our eyes open for another speculative opportunity in the GBP/USD pair.
USD/JPY
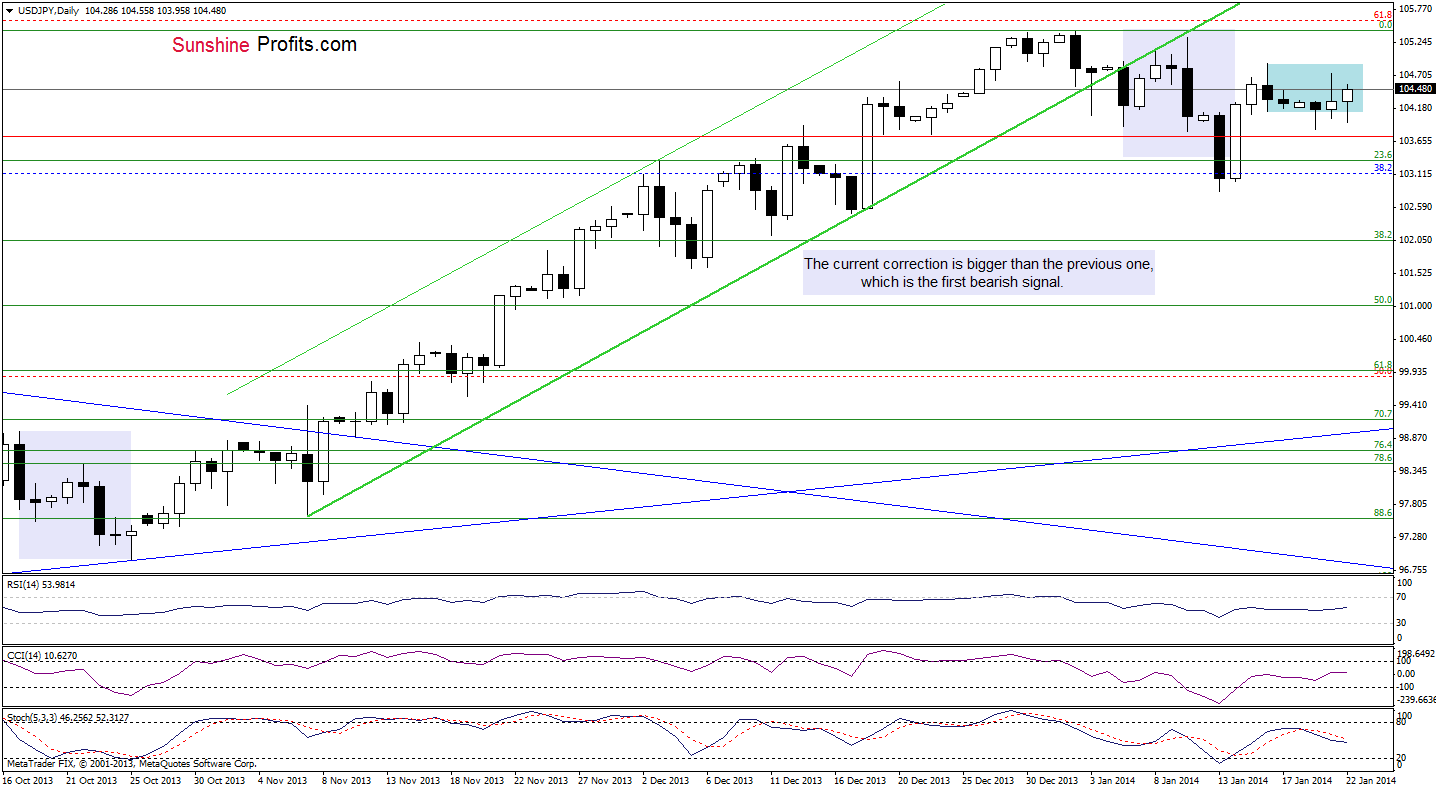
On the above chart, we see that the situation hasn’t changed much and what we wrote in our last Forex Trading Alert remains up-to-date.
(…) recent days had formed a consolidation on the chart (…) USD/JPY (…) climbed to slightly below Thursday’s high at 104.91. If this resistance level is broken, we will likely see another upswing to around the Jan. 10 high (or even to the annual peak). At this point, it’s worth noting that these levels are slightly below the 61.8% Fibonacci retracement level, which supports the sellers and successfully stopped further gains at the beginning of the year.
On the other hand, if the pair drops below yesterday’s low we will likely see further declines and the first downside target will be the January low at 102.84. Please note that the sell signal generated by the Stochastic Oscillator remains in place supporting sellers.
Very short-term outlook: mixed with bearish bias
Short-term outlook: mixed
MT outlook: bullish
LT outlook: bearish
Trading position (short-term): we do not suggest opening any trading positions at the moment. We will keep you informed should anything change, or should we see a confirmation/invalidation of the above.
USD/CAD
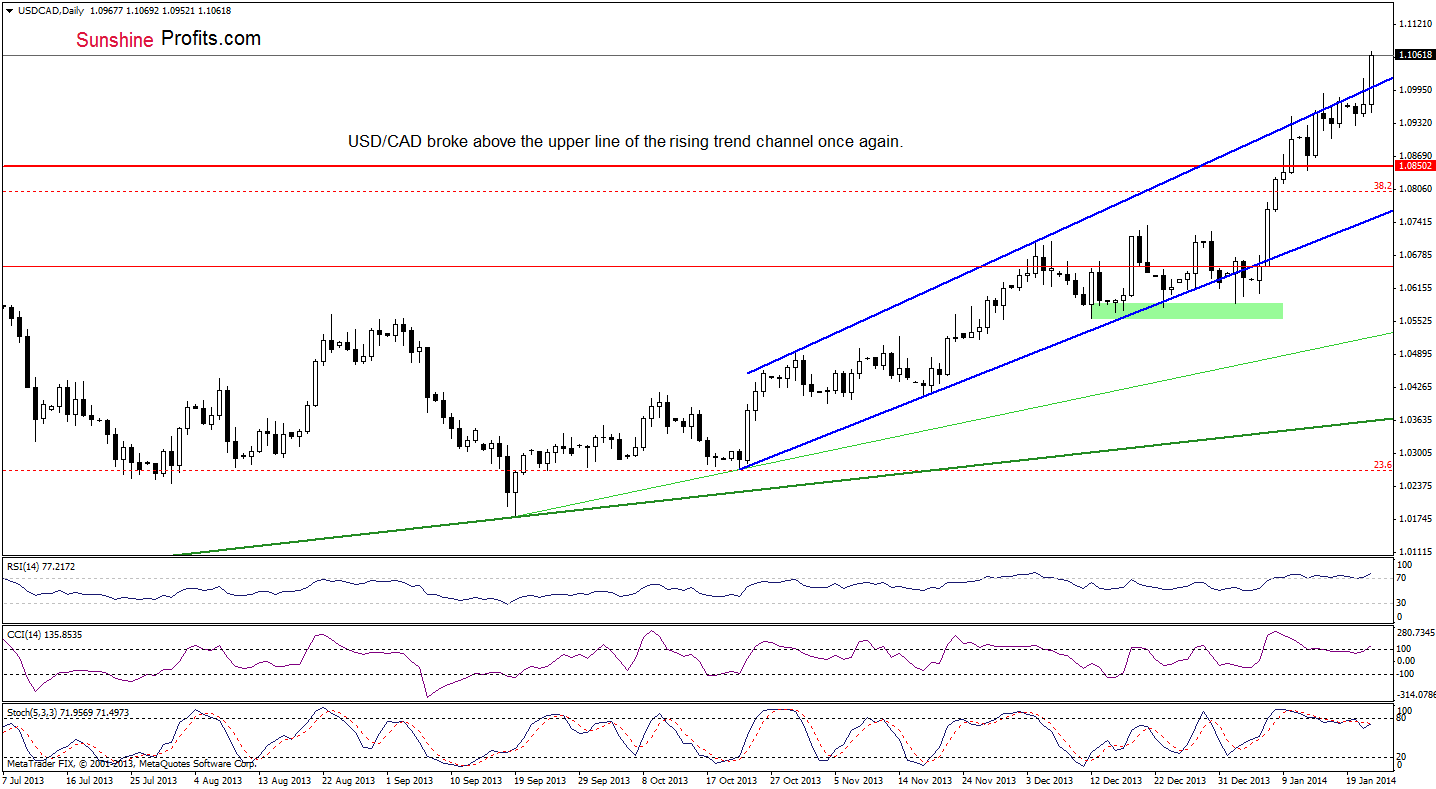
As you see on the above chart, USD/CAD invalidated the breakout broke above the upper line of the rising trend channel yesterday. Although this was a bearish signal, the pair reversed and broke above the upper line of the rising trend channel once again earlier today. Taking into account, the fact that we saw similar moves in recent days and combining it with negative divergences between the indicators and the exchange rate it’s hard to say whether this breakout is reliable or not.
On one hand, if the pair closes the day above this line, we will likely see further improvement. However, looking at the position of the RSI, which is overbought (well above the level of 70) it seems that a pause or a correction is just around the corner. Please note that sell signals generated by the two other indicators remain in place, which reinforces this assumption.
Very short-term outlook: mixed
Short-term outlook: bullish
MT outlook: bullish
LT outlook: bearish
Trading position (short-term): we do not suggest opening any positions at the moment. We will keep you informed should anything change, or should we see a confirmation/invalidation of the above.
USD/CHF
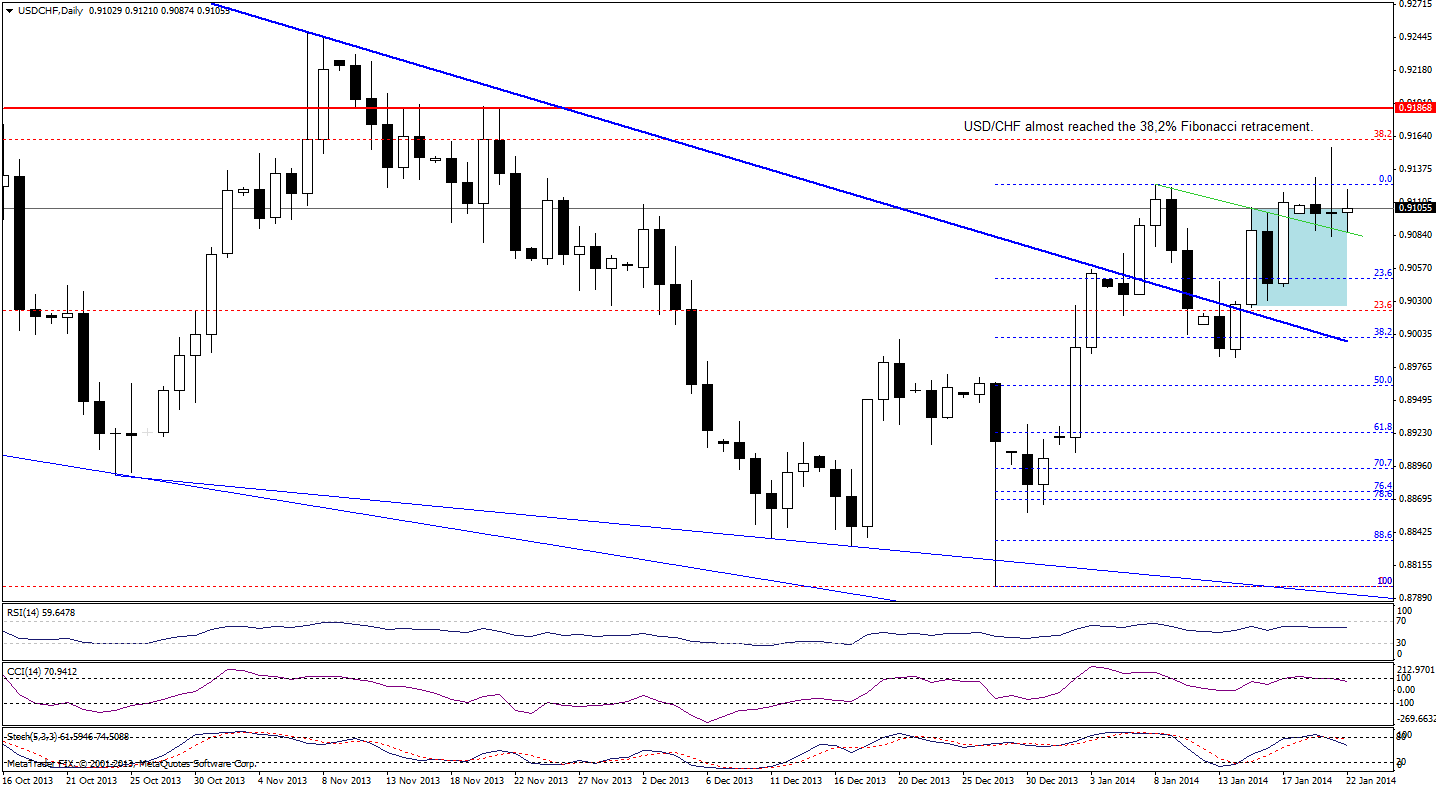
Looking at the above chart, we see that USD/CHF reached the very short-term support/resistance line (marked in green) and rebounded once again earlier today. However, the pair came back to the consolidation range, which is not a positive signal – especially when we factor in the position of the indicators. Please keep in mind that the CCI and Stochastic Oscillator are overbought (the letter generated a sell signal), while the RSI remains slightly below the level of 70, which suggests that a pause or even a correction is just around the corner.
Nevertheless, as long as USD/CHF remains above the very short-term support/resistance line, it seems that the space for further declines is limited.
Very short-term outlook: mixed with bullish bias
Short-term outlook: mixed
MT outlook: bearish
LT outlook: bearish
Trading position (short-term): long. The stop-loss level for this position is at 0.8985. The upside price target is around 0.9160. This position is already quite profitable. We will keep you informed should anything change, or should we see a confirmation/invalidation of the above.
AUD/USD
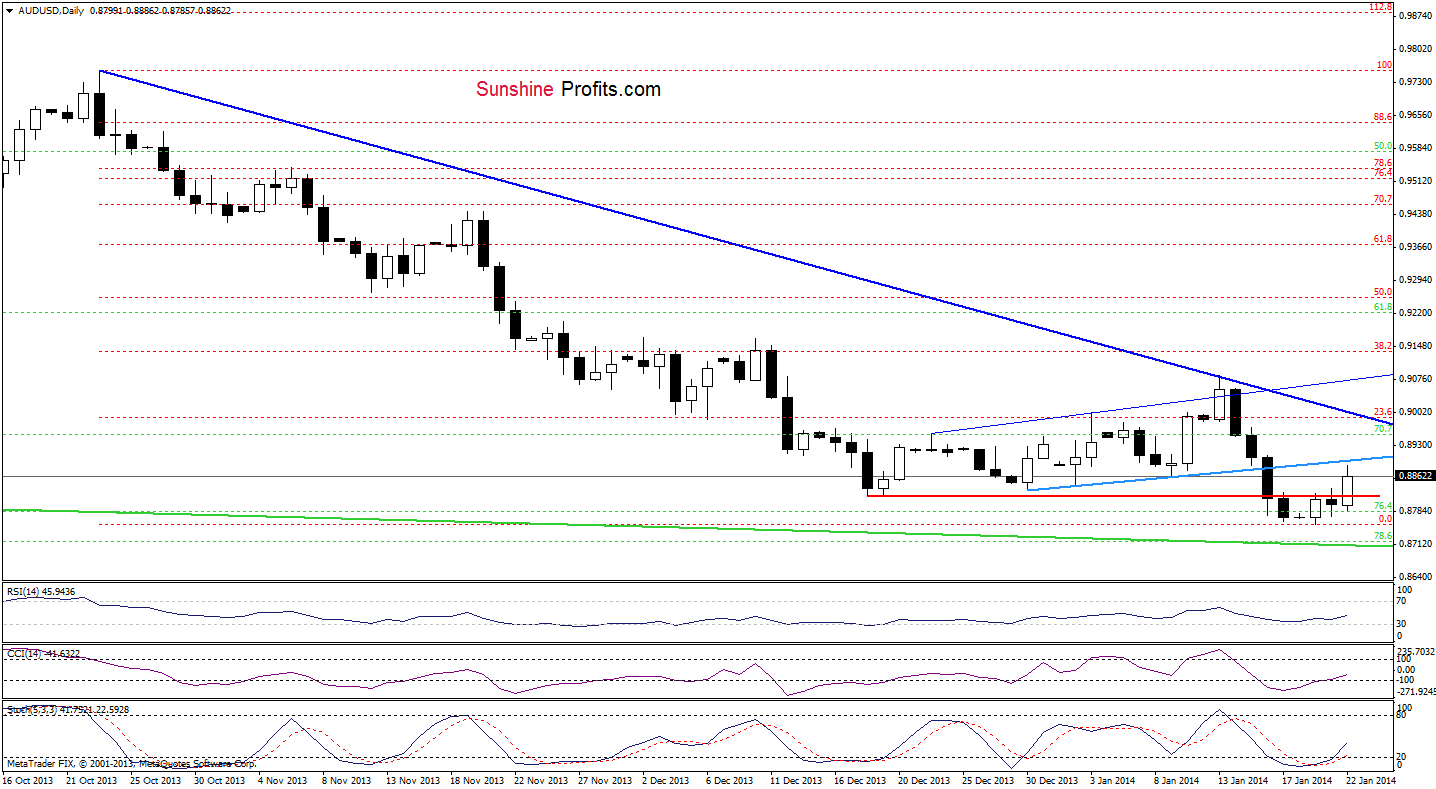
On the above chart, we see that the situation has improved as AUD/USD invalidated the breakdown below the December low. Although this is a bullish signal, the pair still remains below the previously-broken very short-term support line. If this resistance line encourages the sellers, we will likely see a pullback in the following days. In this case, the first downside target will be the January low at 0.8755.
On the other hand, if it is broken, the pair will likely extend gains, which is in tune with the position of the indicators (the CCI and Stochastic Oscillator generated buy signals). In this case, the first upside target will be the previously broken short-term declining resistance line (currently around 0.9000).
Very short-term outlook: mixed
Short-term outlook: bearish
MT outlook: bearish
LT outlook: bearish
Trading position (short-term): we do not suggest opening any positions at the moment. The space for further declines is limited by the strong support zone created by the 78.6% Fibonacci retracement and the lower border of the declining trend channel, while the space for further increases is limited by the previously broken short-term declining resistance line. We will keep you informed should anything change, or should we see a confirmation/invalidation of the above.
Thank you.
Nadia Simmons
Forex & Oil Trading Strategist
Forex Trading Alerts
Oil Investment Updates
Oil Trading Alerts

