

Last week’s price action took one of our currency pairs to a fresh 2018 low and another one created the right shoulder of the pro-bearish formation. We also noticed a verification of the breakdown, a consolidation and a test of important support area. What can we expect in the coming week?
- EUR/USD: short (a stop-loss order at 1.1746; the initial downside target at 1.1343)
- GBP/USD: none
- USD/JPY: none
- USD/CAD: long (a stop-loss order at 1.3018; the initial upside target at 1.3333)
- USD/CHF: none
- AUD/USD: none
EUR/USD
On Thursday, we wrote the following:
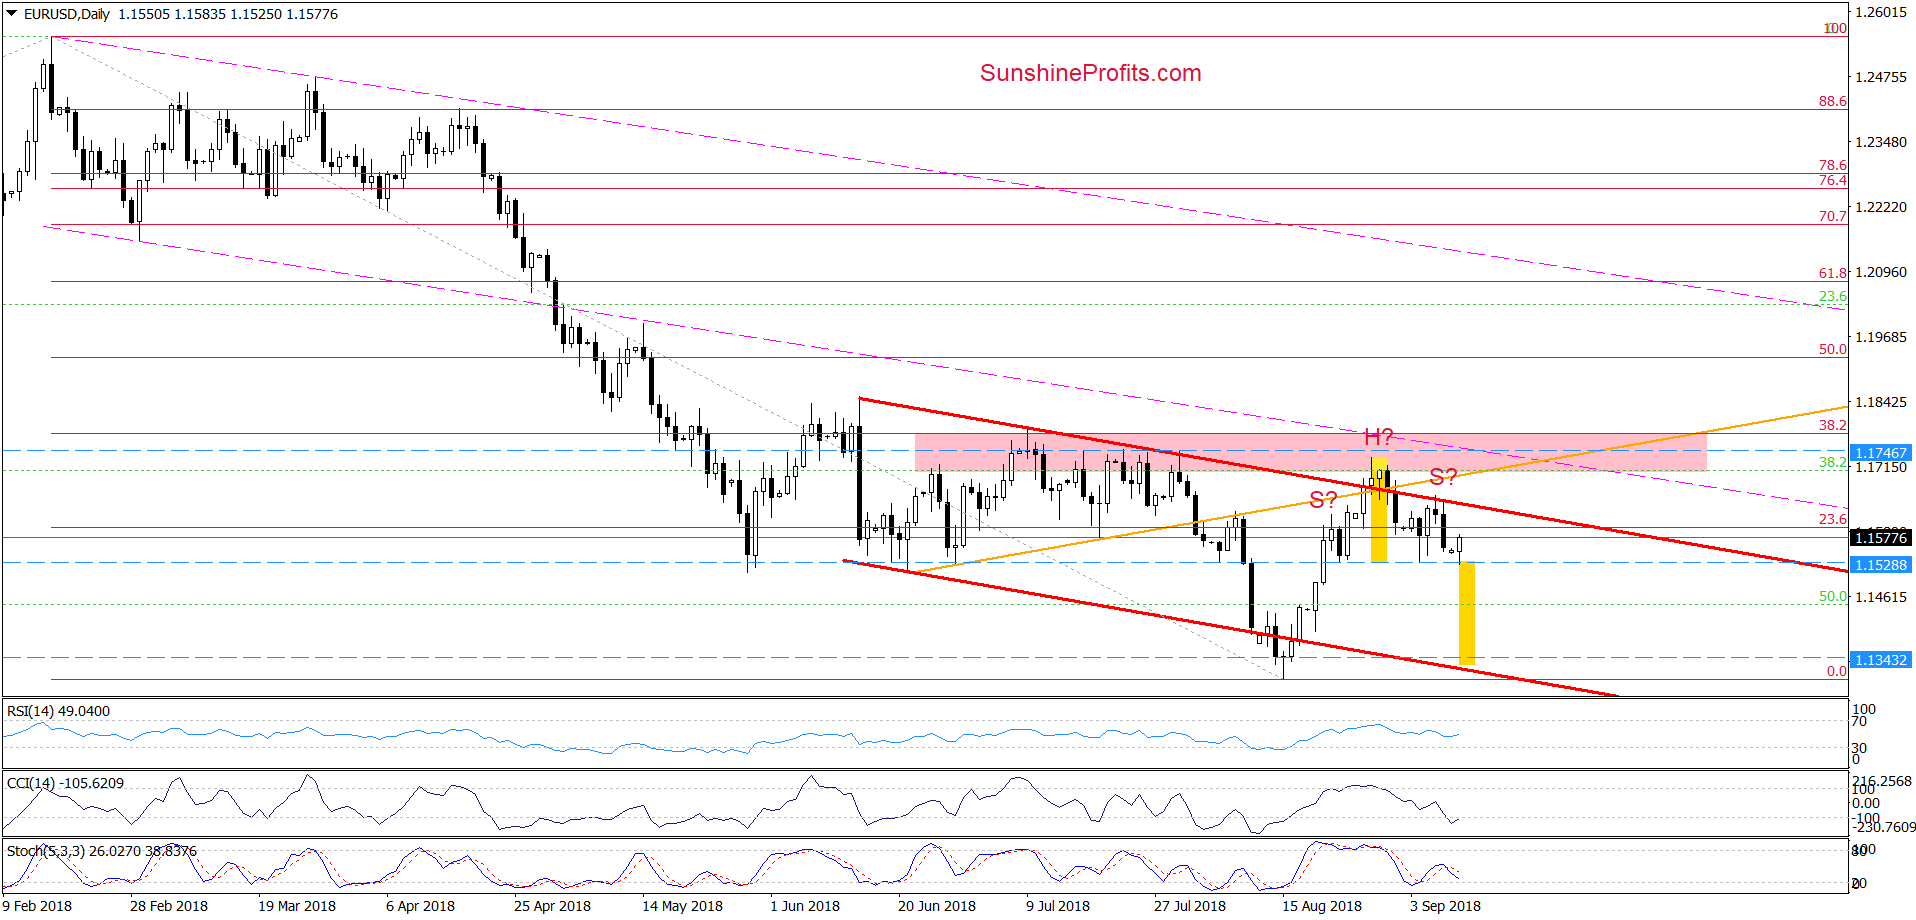
(…) the pair invalidated the earlier tiny breakout, which suggests that currency bears will likely create the right shoulder of the potential head and shoulders top formation in the coming days. If this is the case, EUR/USD will come back to the neck line of the pattern in the very near future.
On the daily chart, we see that the situation developed in tune with the above scenario and EUR/USD slipped to our first downside target. Although the pair rebounded slightly in the following hours, we believe that as long as the exchange rate is trading under the upper border of the red declining trend channel, lower values of EUR/USD are ahead of us and one more test of the blue dashed horizontal line is more likely than not.
What could happen if we see a breakdown under this support?
In our opinion, EUR/USD will extend its decline not only to our initial downside target but will also test the recent lows (in terms of daily closures) or even the lower line of the red declining trend channel.
Trading position (short-term; our opinion): Short positions with a stop-loss order at 1.1746 and the initial downside target at 1.1343 are justified from the risk/reward perspective. We will keep you informed should anything change, or should we see a confirmation/invalidation of the above.
GBP/USD
In our last commentary on this currency pair, we wrote:
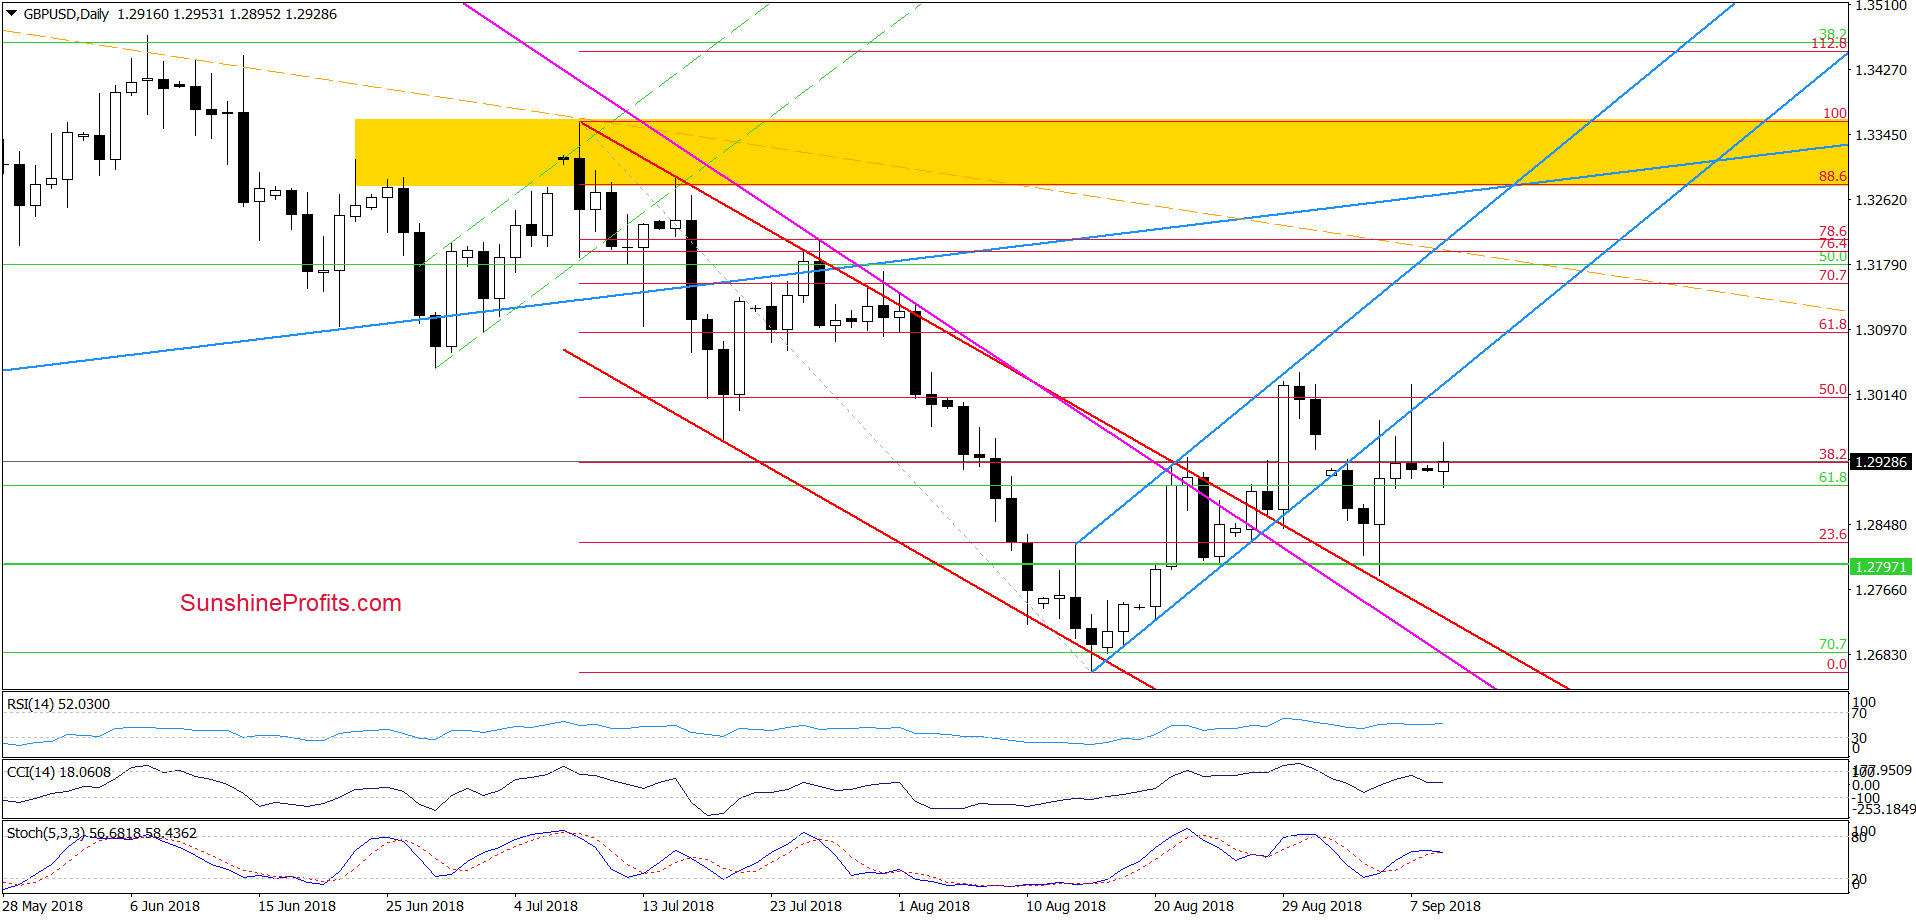
(…) the exchange rate climbed to the previously-broken lower line of the blue rising trend channel, which looks like a verification of the earlier breakdown (at least at the first glance).
Nevertheless, earlier today, currency bulls triggered one more upswing, which increases the likelihood that we’ll see one more test of this nearest resistance in the very near future (…).
As you see on the daily chart, although GBP/USD moved higher on Friday, the proximity to the late-August highs together with under the lower line of the blue trend channel stopped the buyers, triggering a pullback.
Thanks to this downswing the exchange rate closed another day under the blue trend channel, which means that as long as there is no invalidation of the earlier breakdown under the lower line of the formation and a breakout above the recent highs higher values of GBP/USD are not likely to be seen and one more downswing from current levels can’t be ruled out (especially if currency bulls show weakness once again).
Therefore, we think that waiting at the sidelines for a confirmation/invalidation of the above is justified from the risk/reward perspective.
Trading position (short-term; our opinion): No positions are justified from the risk/reward perspective.
USD/JPY
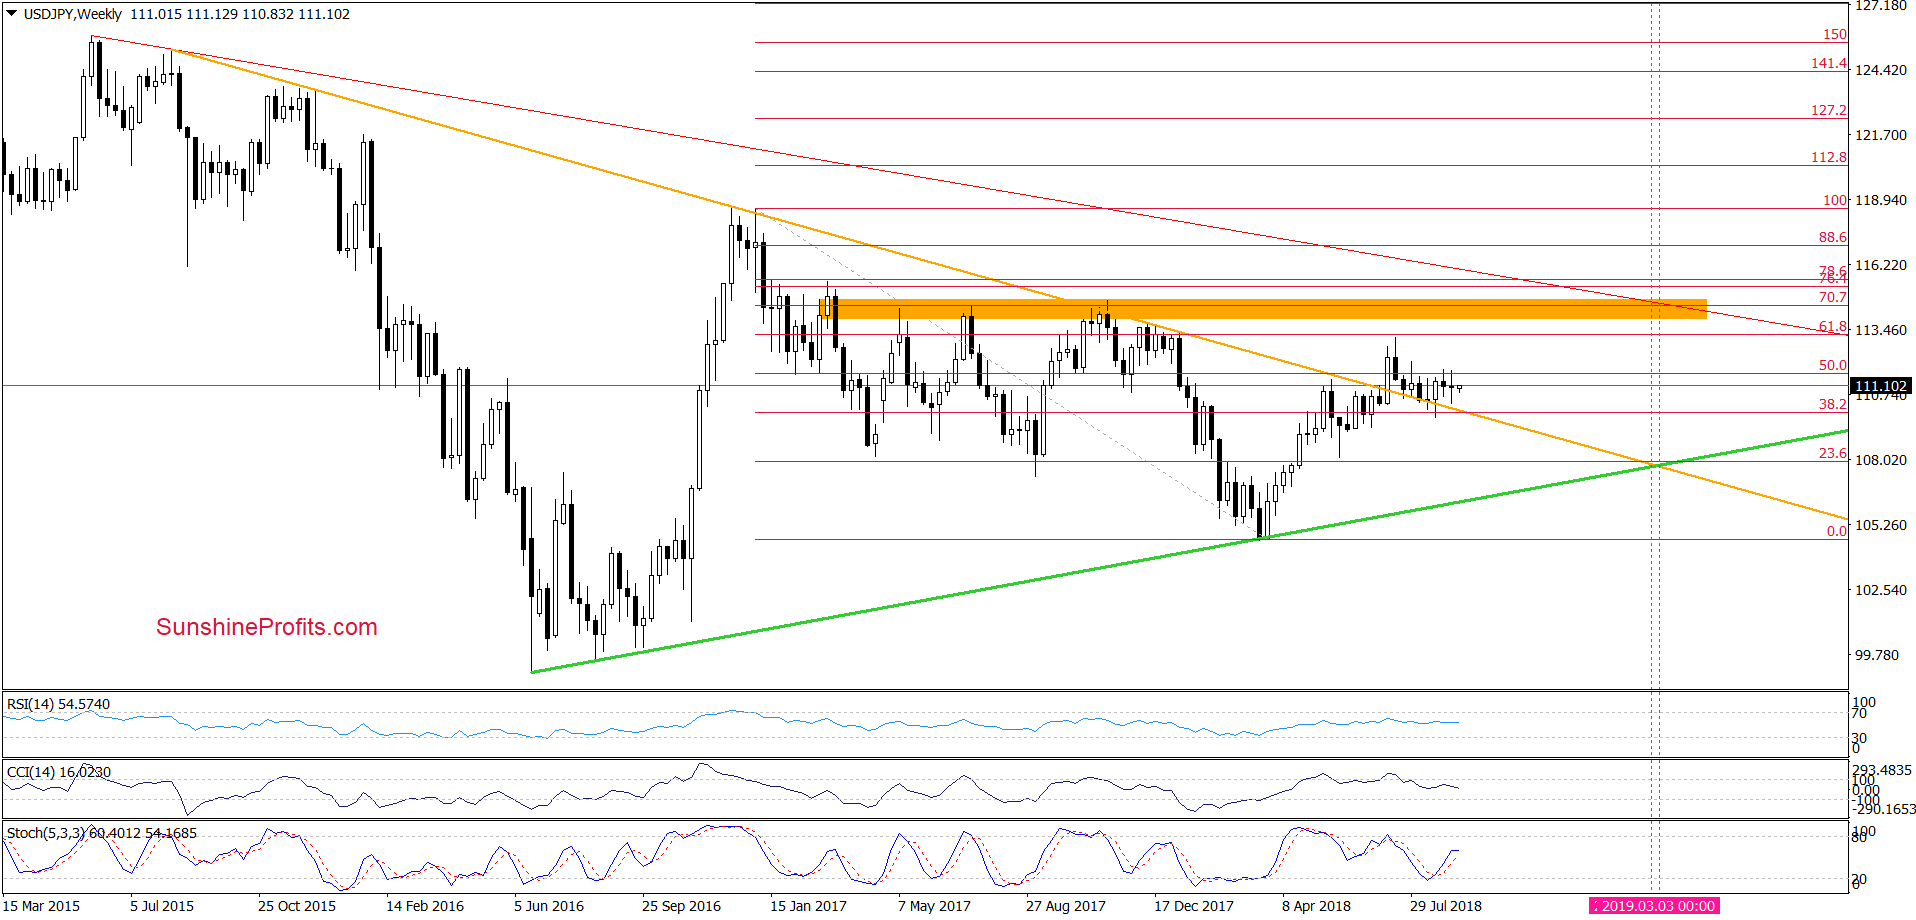
On the weekly chart, we see that USD/JPY closed another week above the previously-broken long-term orange declining line, which means that the medium-term picture remains unchanged and the major support continues to keep declines in check.
Having said that, let’s examine the short-term changes.
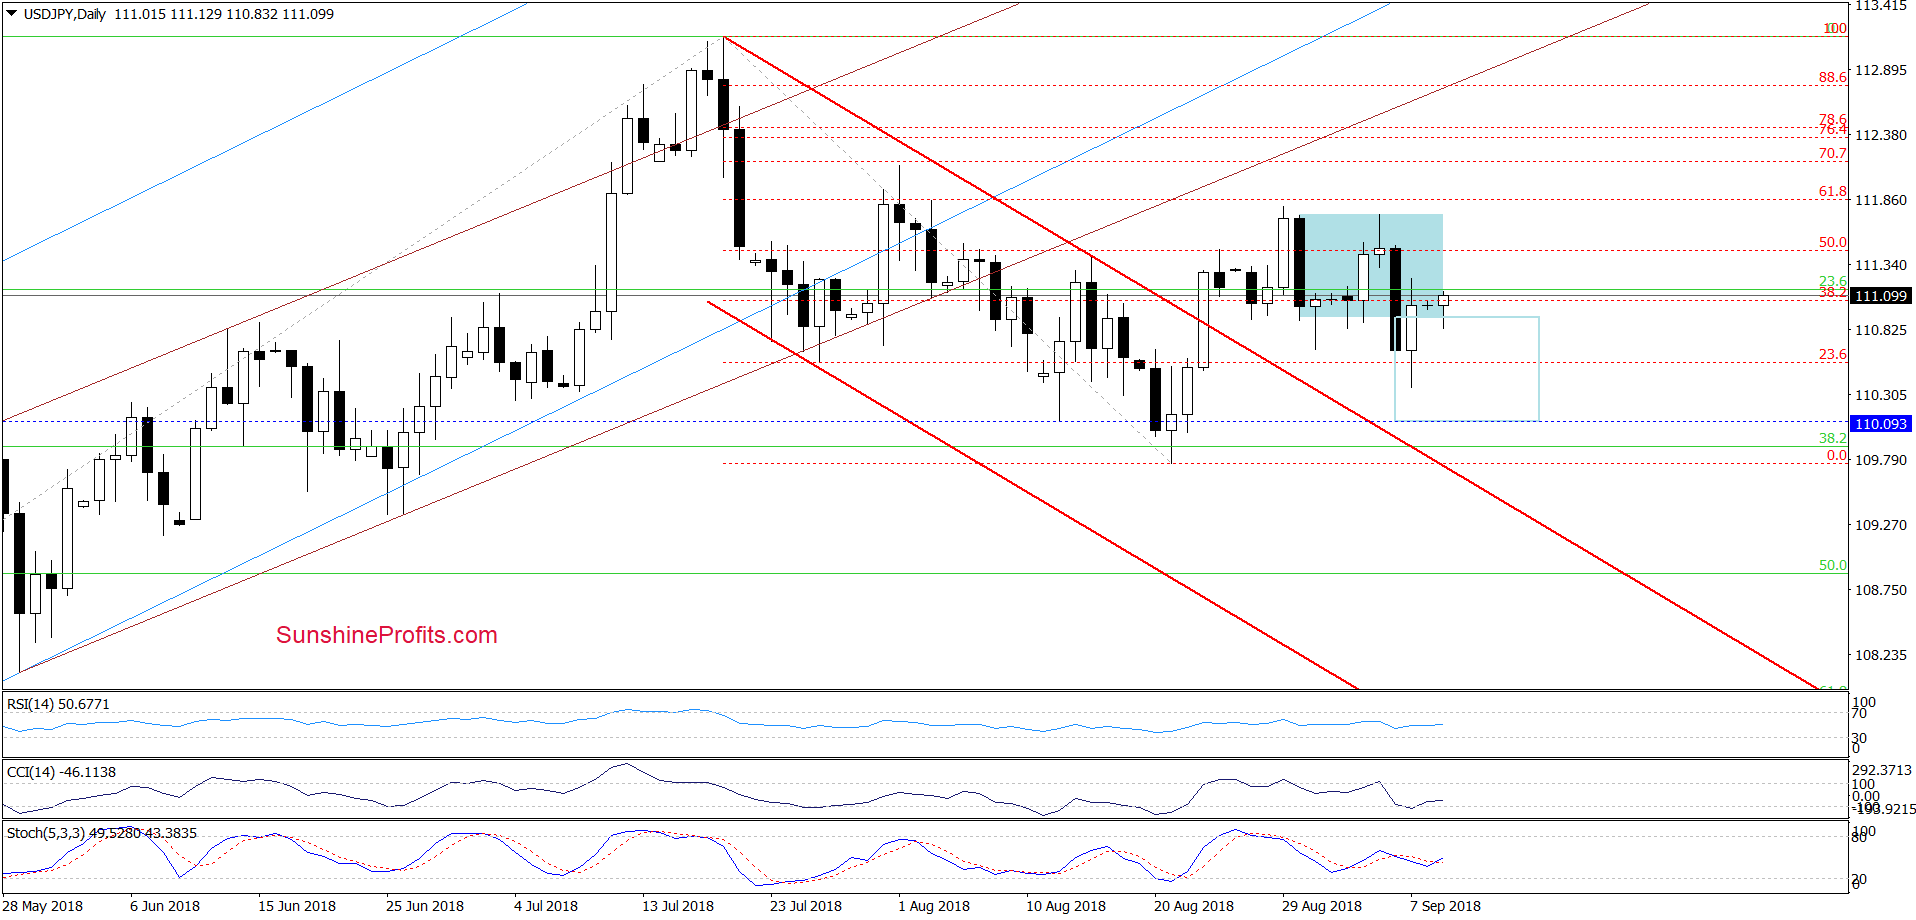
The first thing that catches the eye on the daily chart is an invalidation of Thursday’s breakdown under the lower border of the blue consolidation. This is a positive event, which suggests that we’ll likely see further improvement and a test of the upper line of the formation in the following days.
Nevertheless, if the buyers show strength and manage to break above it, we’ll consider opening long positions.
Trading position (short-term; our opinion): No positions are justified from the risk/reward perspective. We will keep you informed should anything change, or should we see a confirmation/invalidation of the above.
USD/CAD
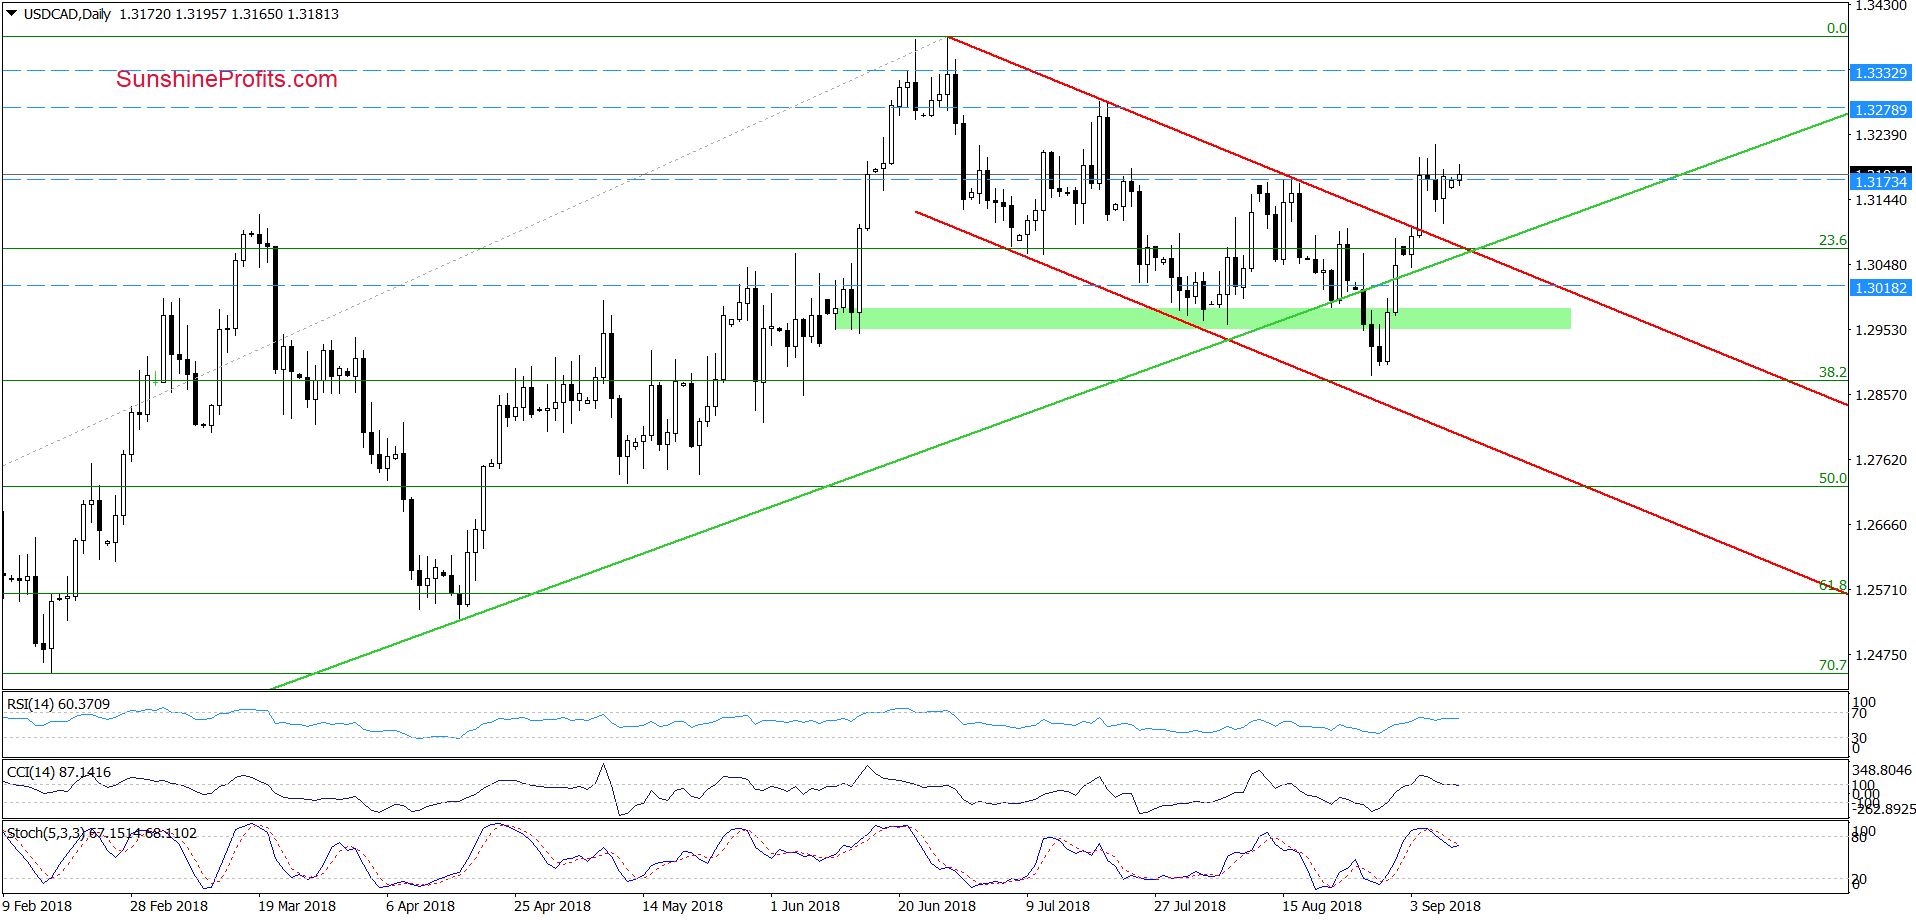
Looking at the daily chart, we see that the overall situation in the short term hasn’t changed much as USD/CAD is still trading above the previously-broken upper line of the red declining trend channel and slightly below the mid-August peaks.
What’s next for the exchange rate?
In our opinion, if the pair extends its trip to the north from here, the next target will be around 1.3278 (July highs) or we’ll even see a test of the June peaks in the coming week(s).
Trading position (short-term; our opinion): Long positions with a stop-loss order at 1.3018 and the initial upside target at 1.3333 are justified from the risk/reward perspective. We will keep you informed should anything change, or should we see a confirmation/invalidation of the above.
USD/CHF
Quoting our Friday’ alert:
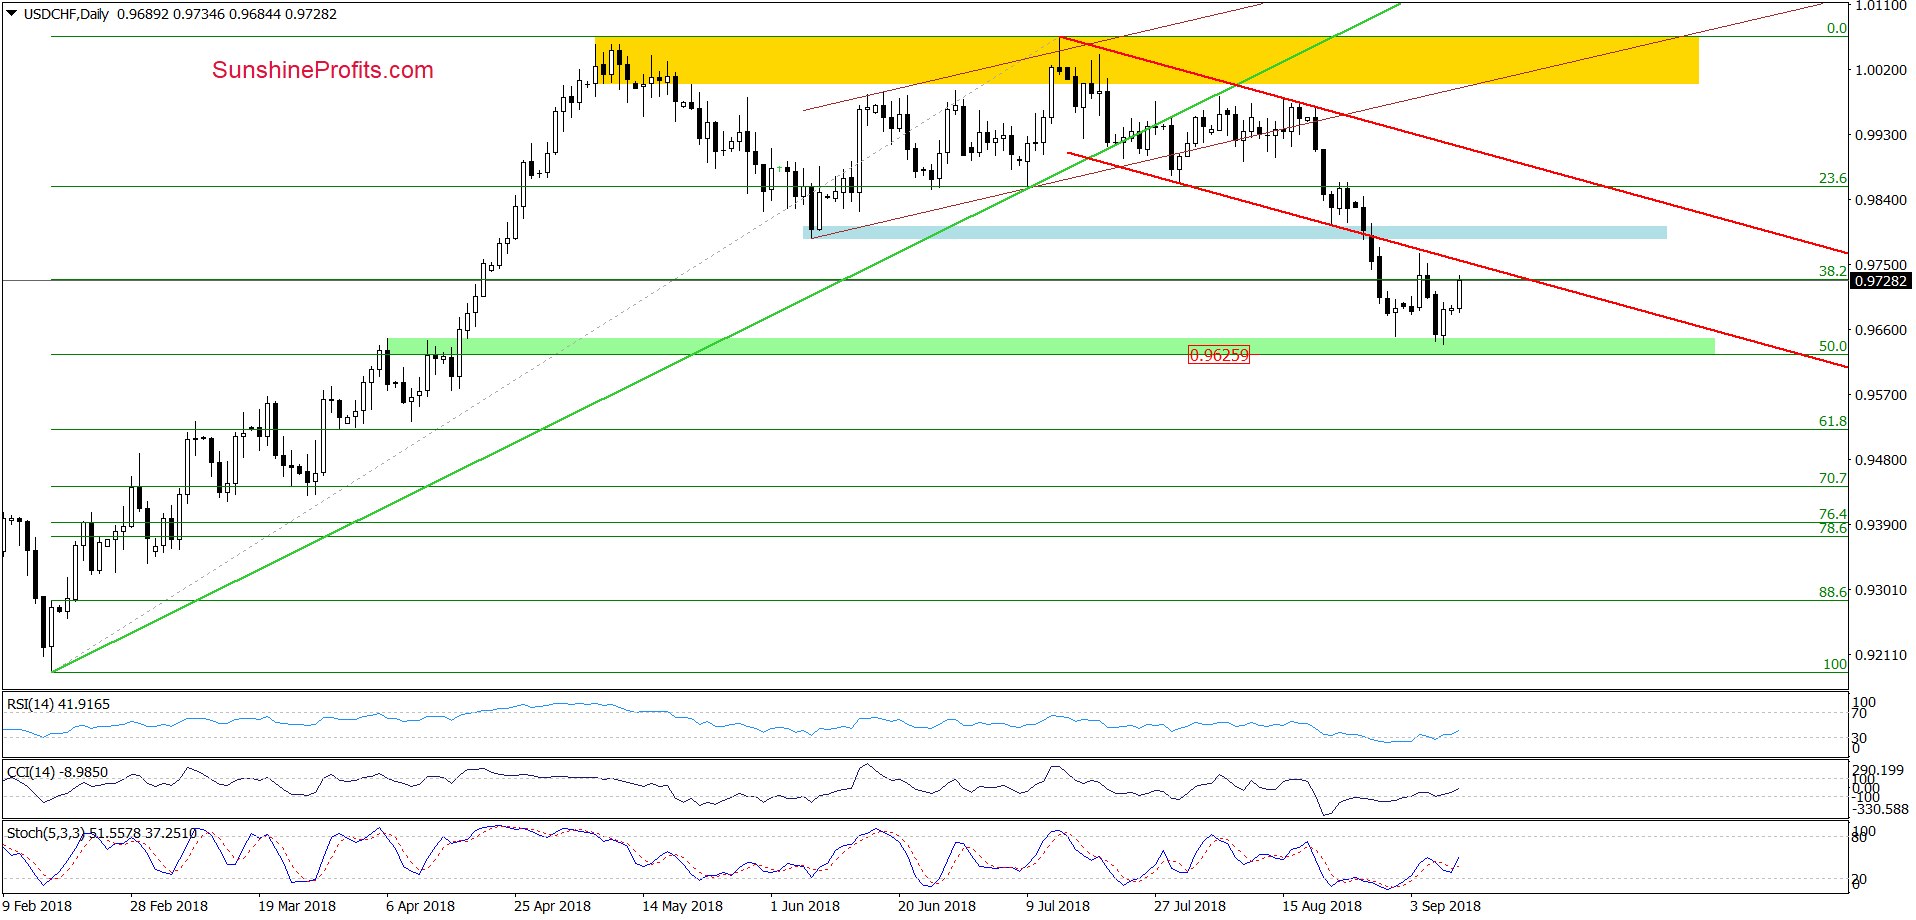
(…) currency bears showed their strength in recent days, which resulted in a test of our first downside target yesterday. Earlier today, the situation remains almost unchanged as USD/CHF is still trading slightly above the green support zone.
What’s next for the exchange rate?
Taking into account, the above-mentioned support area, it seems to us that (…), the space for declines is limited and we’ll see a reversal and rebound at the beginning of the upcoming week.
From todays point of view, we see that the buyers extended Friday’s rebound earlier today, which in combination with the buy signals generated by the indicators suggests that we’ll see a realization of our pro-growth scenario from our last alert:
(…) If the situation develops in line with this assumption, USD/CHF will (…) re-test the strength of the lower border of the red declining trend channel in the very near future.
Trading position (short-term; our opinion): No positions are justified from the risk/reward perspective. We will keep you informed should anything change, or should we see a confirmation/invalidation of the above.
AUD/USD
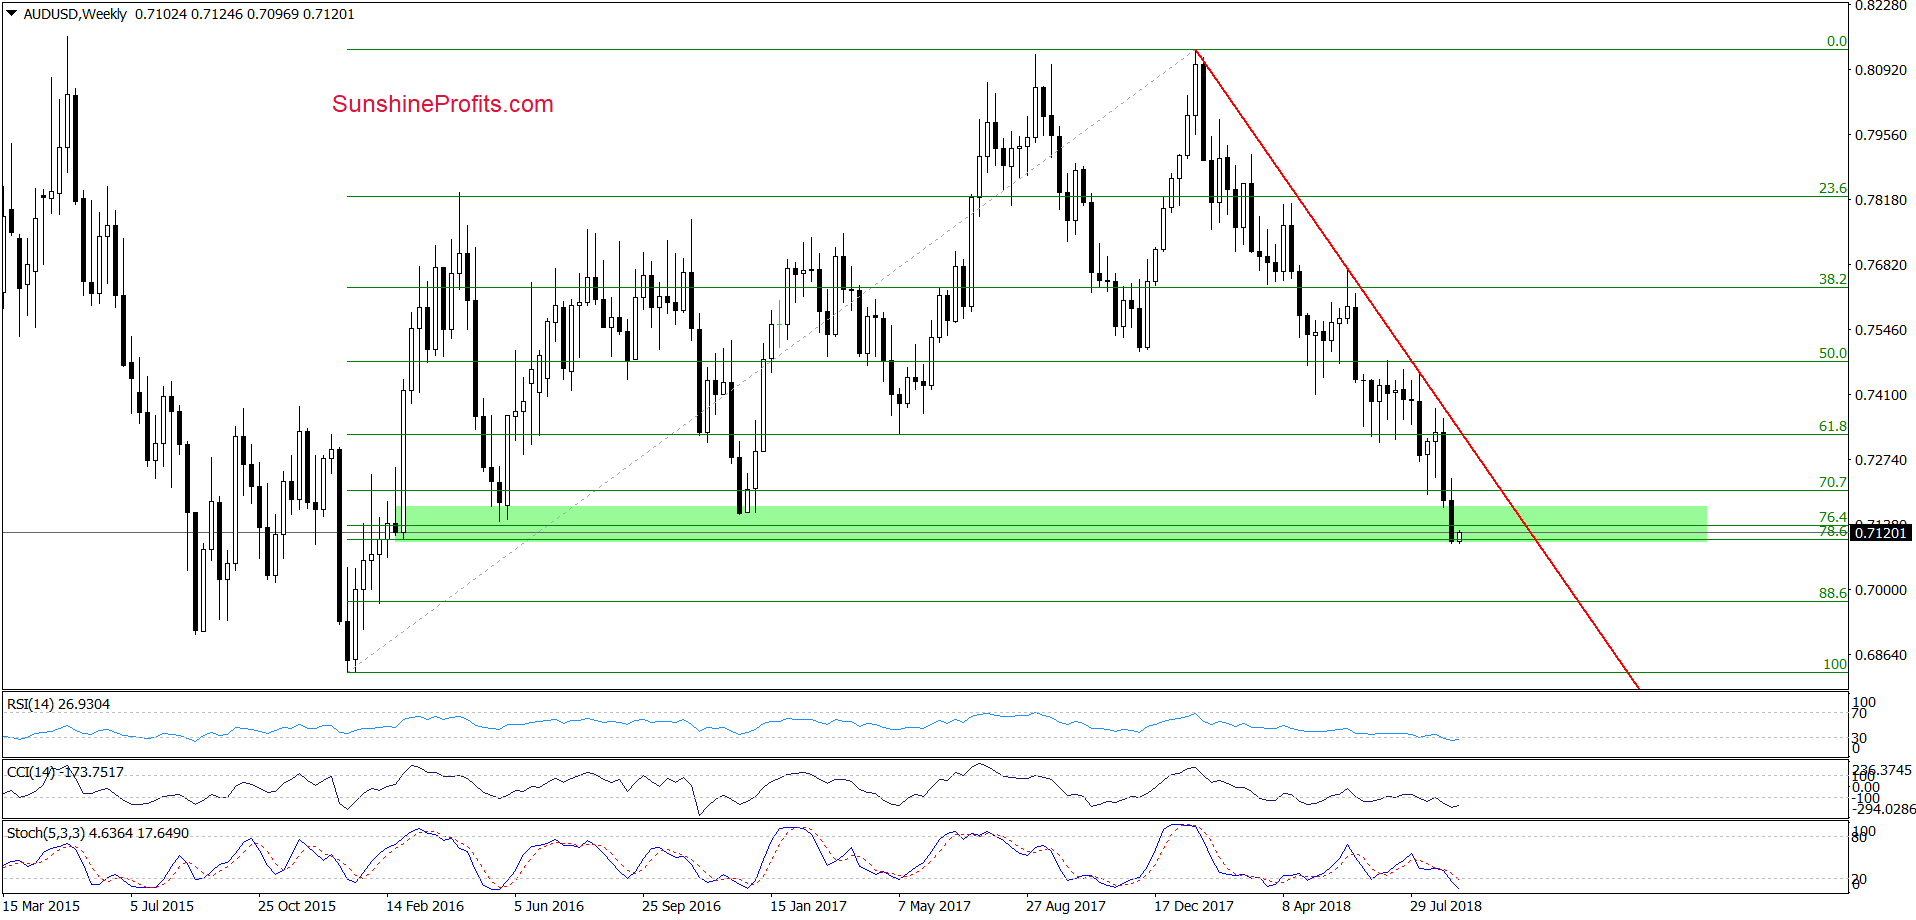
On the weekly chart, we see that AUD/USD extended losses and dropped below the May 2016 and December 2017 lows, hitting a fresh 2018 low in the previous. Thanks to this decline, the exchange rate moved to the lower border of the green support zone based on the 78.6% Fibonacci retracement and the late-February 2016 lows.
Will we finally see a rebound from here? We think that the best answer to this question will be the monthly chart of AUD/USD.
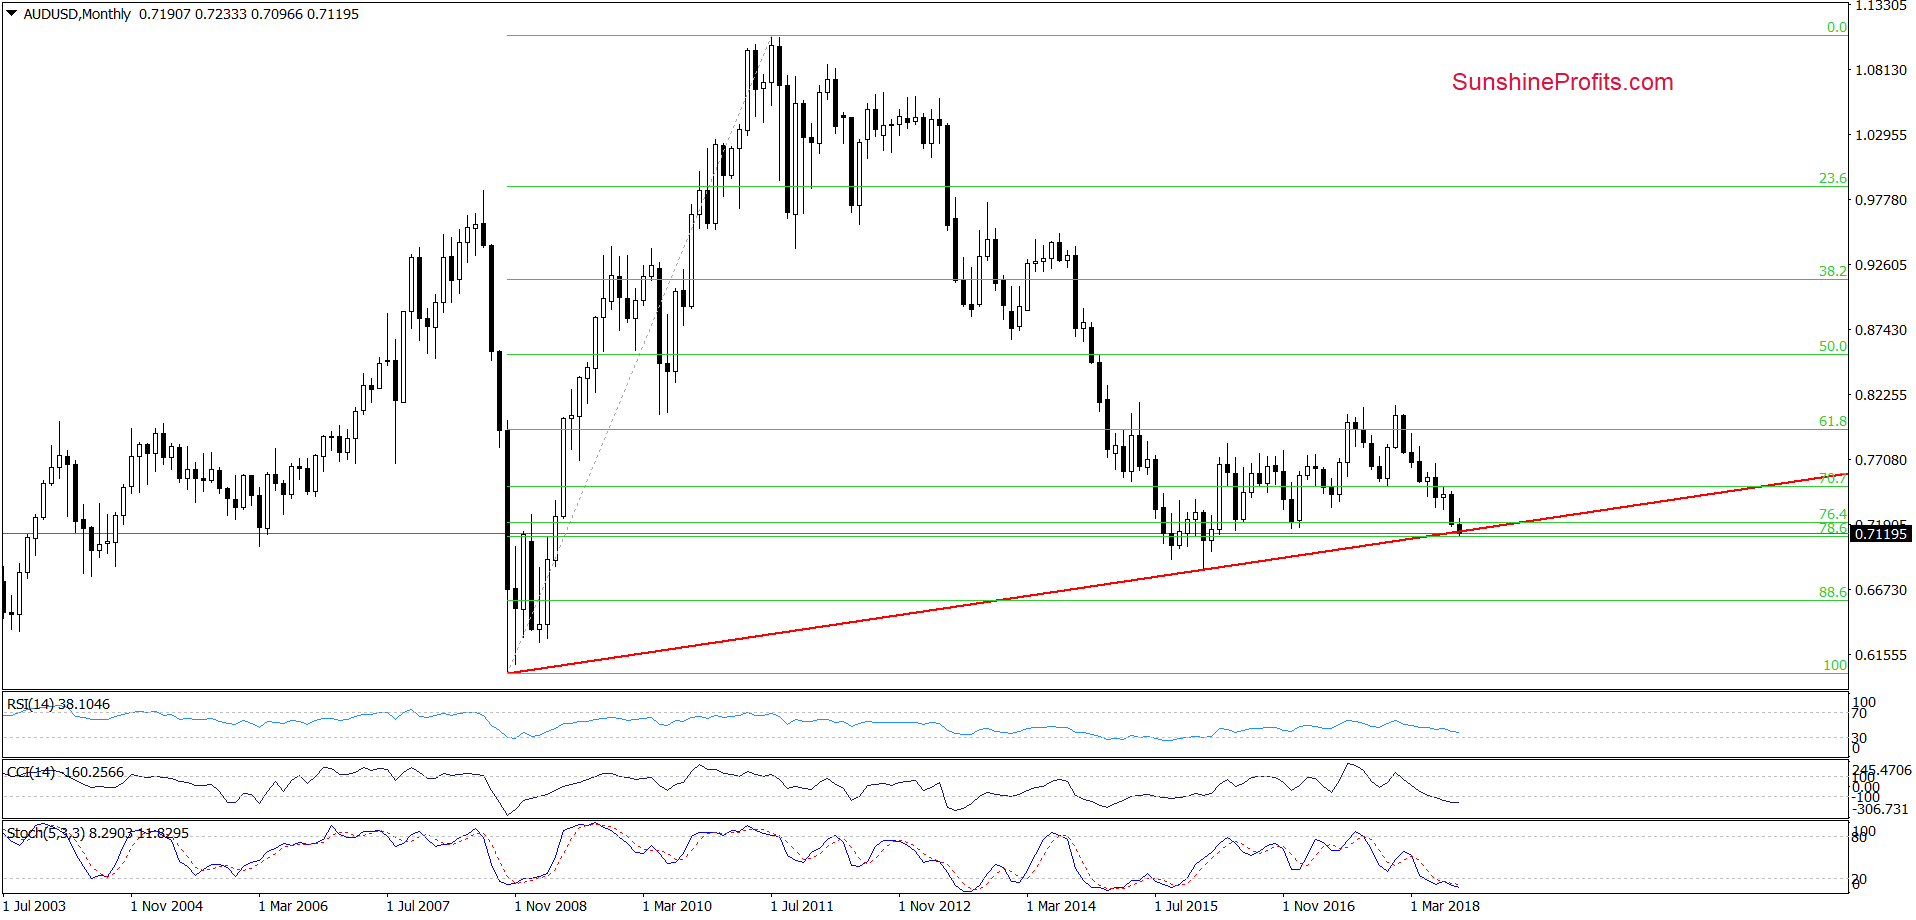
From this perspective, we see that the exchange rate dropped to the long-term red rising support line based on the October 2008 and January 2016 lows, which in combination with the medium-term picture suggests that reversal from this area is very likely – especially when we factor in the fact that the long- and medium-term indicators are not only oversold, but also slipped to their lowest levels in 2018.
Trading position (short-term; our opinion): No positions are justified from the risk/reward perspective. We will keep you informed should anything change, or should we see a confirmation/invalidation of the above.
Thank you.
Nadia Simmons
Forex & Oil Trading Strategist
Przemyslaw Radomski, CFA
Founder, Editor-in-chief, Gold & Silver Fund Manager
Gold & Silver Trading Alerts
Forex Trading Alerts
Oil Investment Updates
Oil Trading Alerts

