

In today’s alert, we take a closer look at the very short-term changes in all our currency pairs. Which ones will increase, and which will fall? Which resistance zones proved to be impossible to pass? Which currency pair invalidated the earlier breakdown? Answers to these and other unasked questions you will find in our analyzes. Have a nice read.
In our opinion the following forex trading positions are justified - summary:
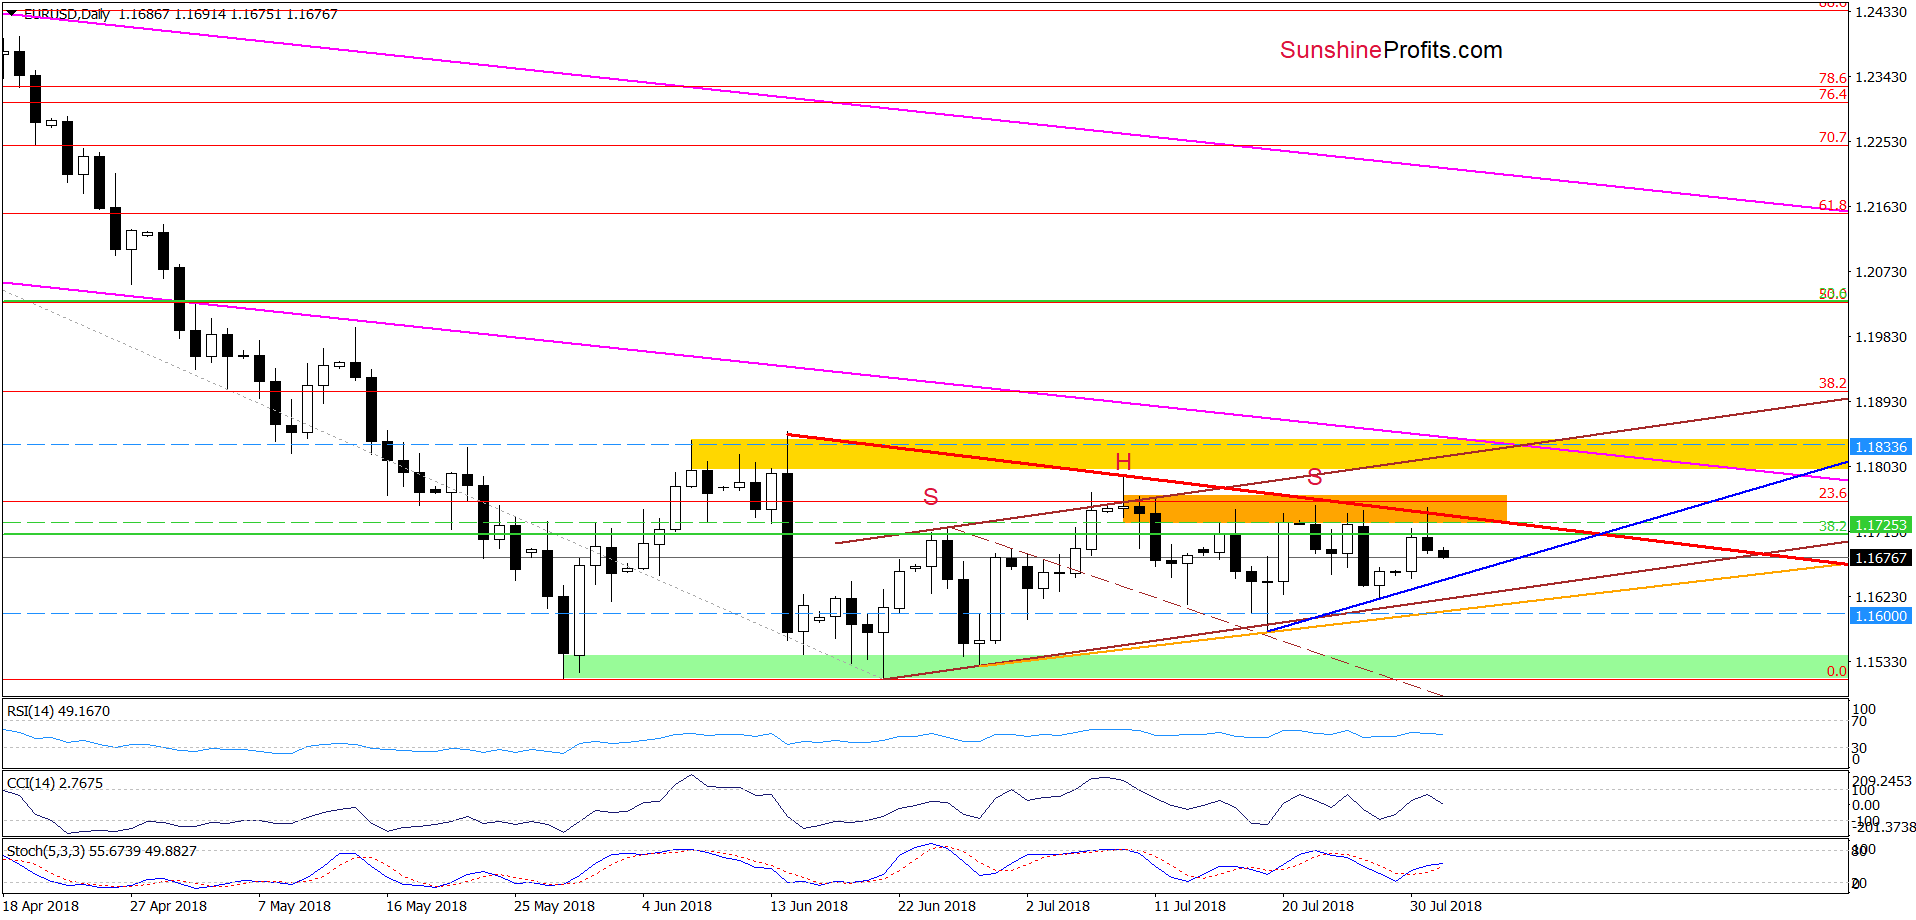
- EUR/USD: short (a stop-loss order at 1.1833; the initial downside target at 1.1588)
- GBP/USD: short (a stop-loss order at 1.3301; the initial downside target at 1.2913)
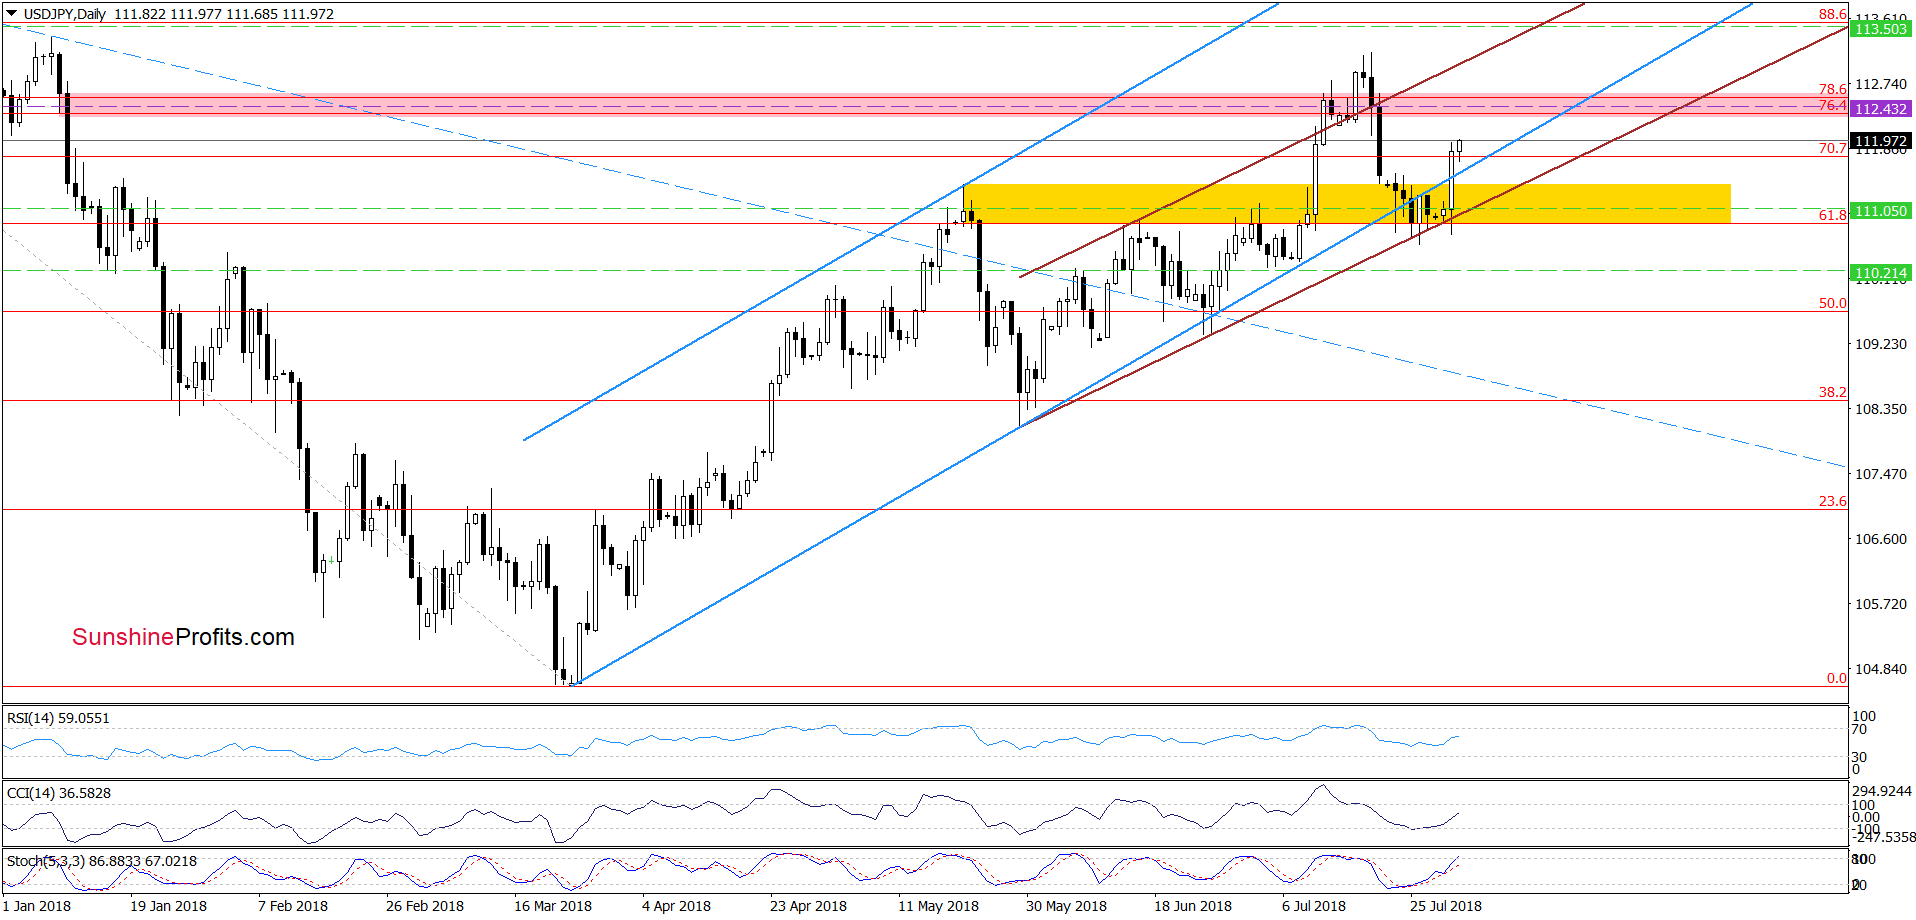
- USD/JPY: long (a stop-loss order at 110.21; the initial upside target at 113.50)
- USD/CAD: none
- USD/CHF: none
- AUD/USD: short (a stop-loss order at 0.7510; the initial downside target at 0.7315)
EUR/USD
Quoting our last alert:
EUR/USD came back to the orange resistance zone created by the previous highs and approached the red declining line based on the mid-June and July peaks.
This is a repeat of what we already saw several times in the past, therefore, we believe that as long as there is no breakout above these resistances higher values of the exchange rate are not likely to be seen and another reversal should not surprise us.
Looking at the daily chart, we see that currency bears took the exchange rate lower as we had expected. Thanks to their yesterday’s attack, the pair invalidated a tiny breakout above the red declining resistance line, which accelerated declines.
Earlier today, EUR/USD extended losses, which suggests that we’ll see (at least) a drop to the blue support line based on recent lows. Nevertheless, if the Stochastic Oscillator generates the sell signal, the pair will likely also test the strength of the lower border of the brown rising trend channel in the coming days.
Trading position (short-term; our opinion): short positions with a stop-loss order at 1.1833 and the initial downside target at 1.1588 are justified from the risk/reward perspective. We will keep you informed should anything change, or should we see a confirmation/invalidation of the above.
GBP/USD
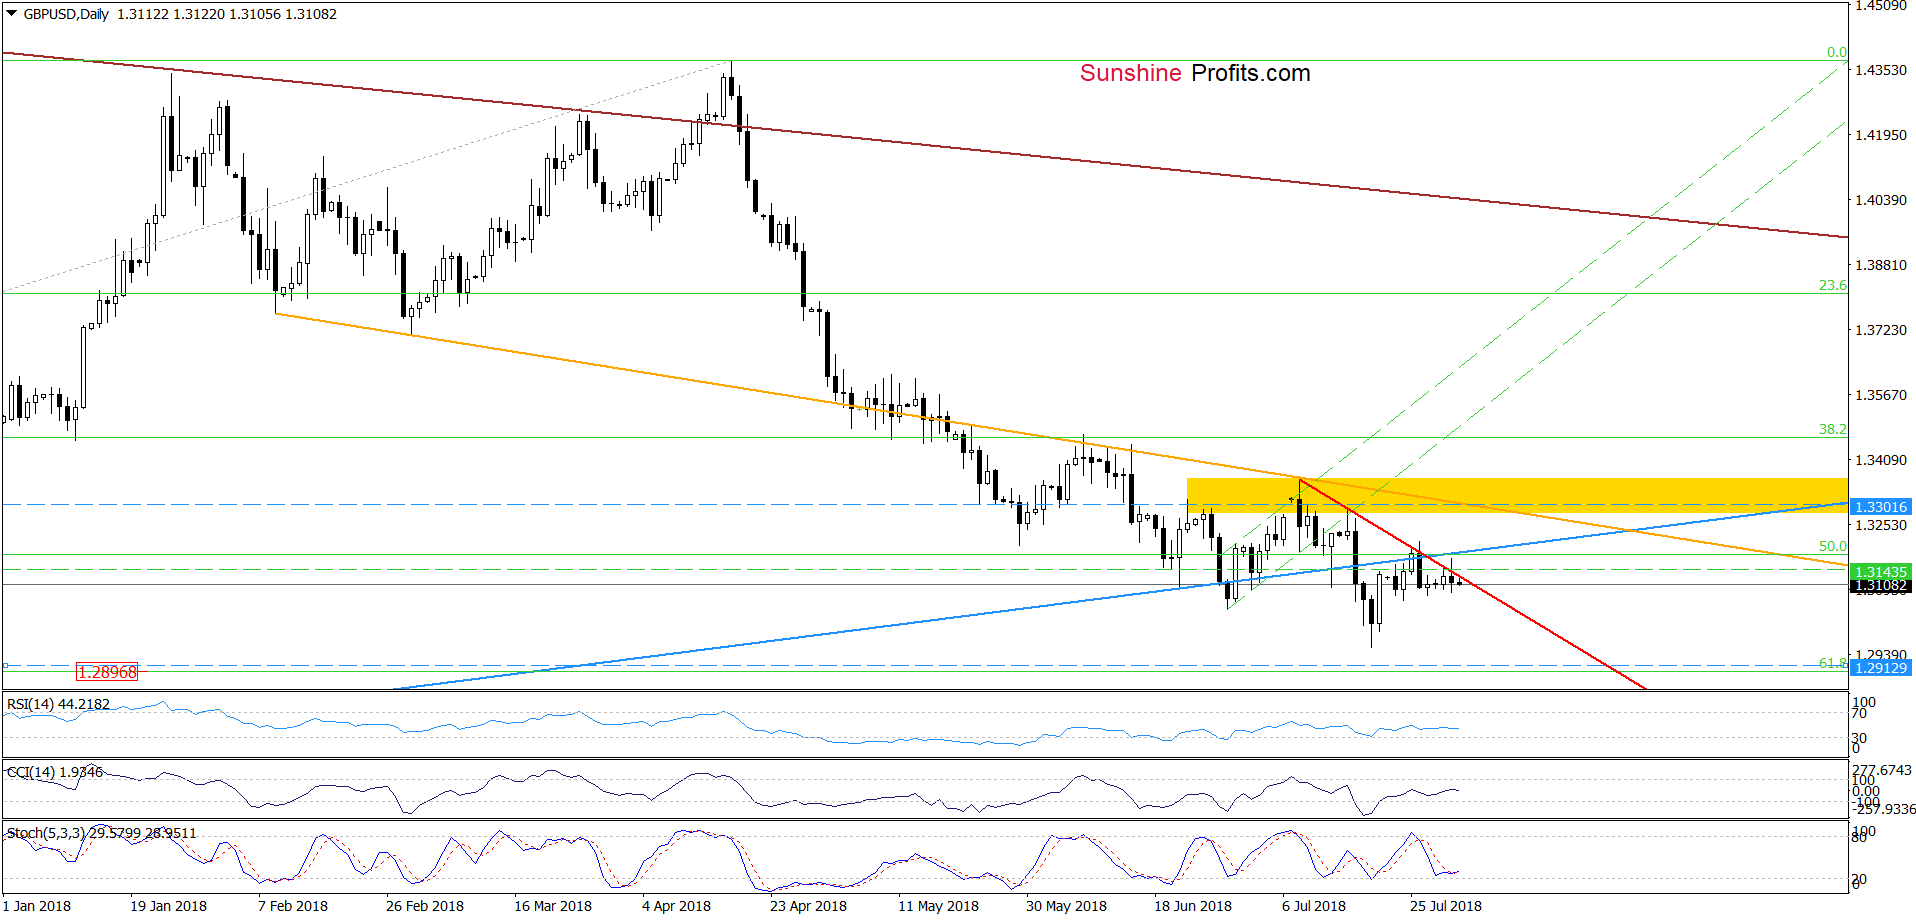
On the daily chart, we see that although GBP/USD moved higher during yesterday’s session, the proximity to the previously-broken long-term blue line encouraged the sellers to act.
As a result, the pair reversed and declined, which looks like a verification of the earlier breakdown (a negative sign). Additionally, yesterday’s drop invalidated a small breakout above the very short-term red declining resistance line based on the previous highs, giving currency bears one more reason to go to the south in the following days.
If the situation develops in line with the above assumption, we’ll likely see a realization of the pro-bearish scenario from our Monday’s alert:
(…) If (…) the pair extends losses from here, we’ll likely see not only a test of the recent lows, but also a drop to around 1.2896, where the 61.8% Fibonacci retracement (based on the entire January 2017 – March 2018 upward move) is.
Trading position (short-term; our opinion): Short positions with a stop-loss order at 1.3301 and the initial downside target at 1.2913 are justified from the risk/reward perspective. We will keep you informed should anything change, or should we see a confirmation/invalidation of the above.
USD/JPY
Yesterday, we wrote the following:
(…) USD/JPY moved lower once again, but the lower border of the brown rising trend channel stopped the sellers similarly to what we saw in the previous week.
Such price action suggests that currency bulls are active in this area and they will not surrender too easily without a fight. Additionally, the CCI and the Stochastic Oscillator generated the buy signals, suggesting that another bigger move to the upside is just around the corner – especially when we factor in the medium-term picture of the exchange rate.
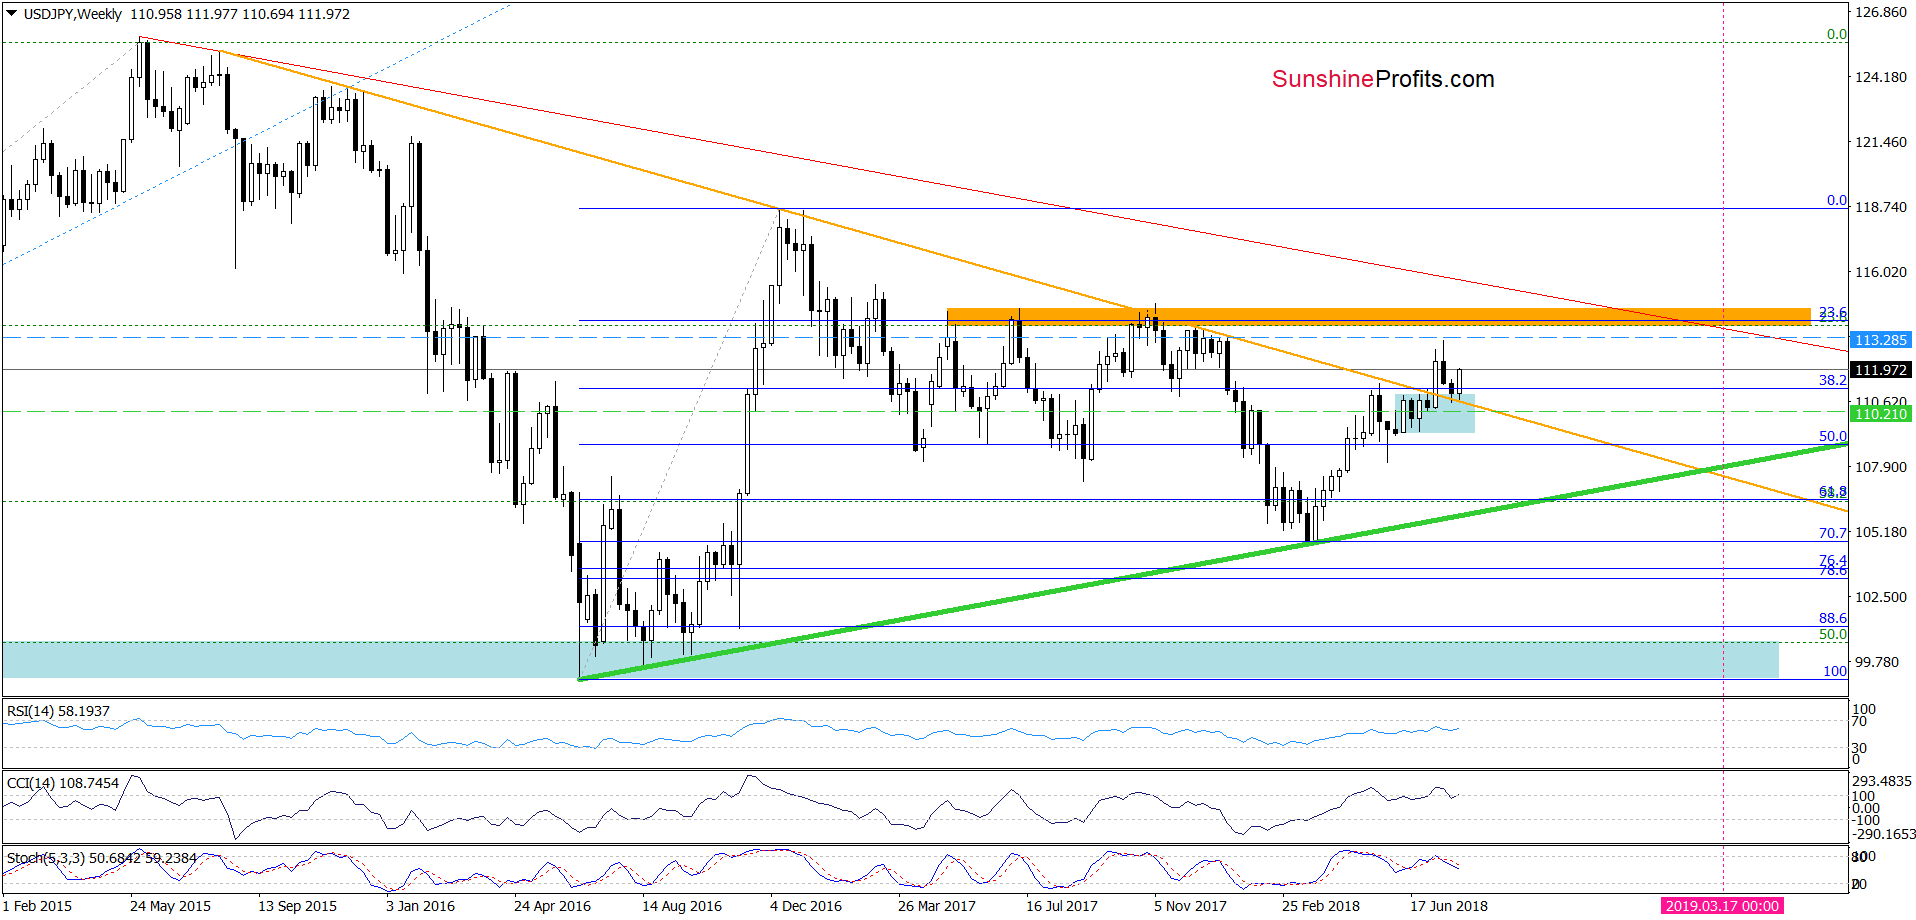
(…) USD/JPY tested the previously-broken long-term orange declining line (which serves as the nearest very important support) last week, but currency bears didn’t manage to close the week below it, which resulted in an invalidation of the tiny breakdown.
Earlier this week (…), we saw another attempt to move lower, but this solid support withstood the selling pressure once again, triggering a rebound. Such price action looks like a verification of the breakout above this line, which increases the probability of further improvement in the coming week(s).
From today’s point of view, we see that the situation developed in line with the above scenario and USD/JPY rebounded sharply during yesterday’s session, invalidating the earlier breakdown under the lower border of the blue rising trend channel.
Earlier today, the pair climbed even higher, which suggests that we’ll see (at least) a test of the recent highs in the following days.
Trading position (short-term; our opinion): long positions with a stop-loss order at 110.21 and the initial upside target at 113.50 are justified from the risk/reward perspective. We will keep you informed should anything change, or should we see a confirmation/invalidation of the above.
USD/CAD
Quoting our last commentary on this currency pair:
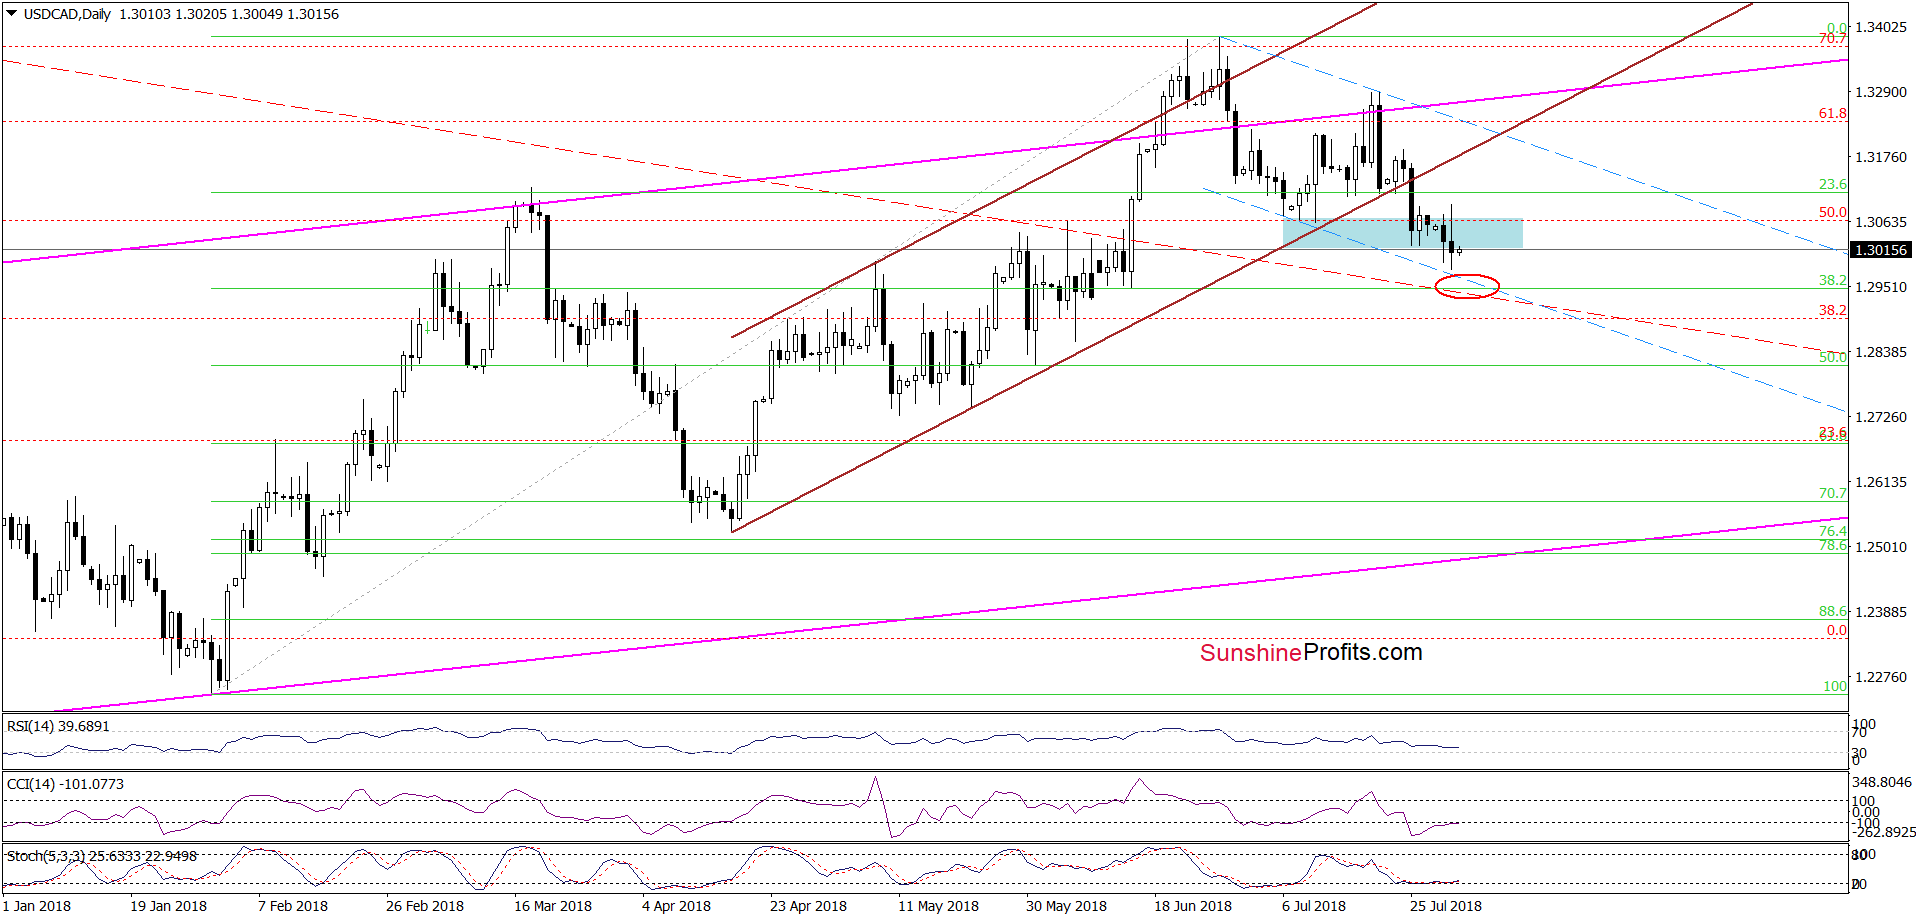
(…) as long as there are no buy signals generated by the indicators, one more downswing and a test of the lower border of the blue declining trend channel (marked with dashed lines) is likely.
As you see on the daily chart, thanks to yesterday’s price action, currency bears almost reached our downside target, but the proximity to the lower line of the blue channel encouraged their opponents to act.
Earlier today, USD/CAD extended yesterday’s rebound, while the CCI and the Stochastic Oscillator generated the buy signals, which suggests another attempt to move higher is likely in the very near future.
If this is the case and the exchange rate climbs above yesterday’s intraday high, we’ll see a test of the previously-broken lower border of the brown rising trend channel in the following days.
Trading position (short-term; our opinion): No positions are justified from the risk/reward perspective. We will keep you informed should anything change, or should we see a confirmation/invalidation of the above.
USD/CHF
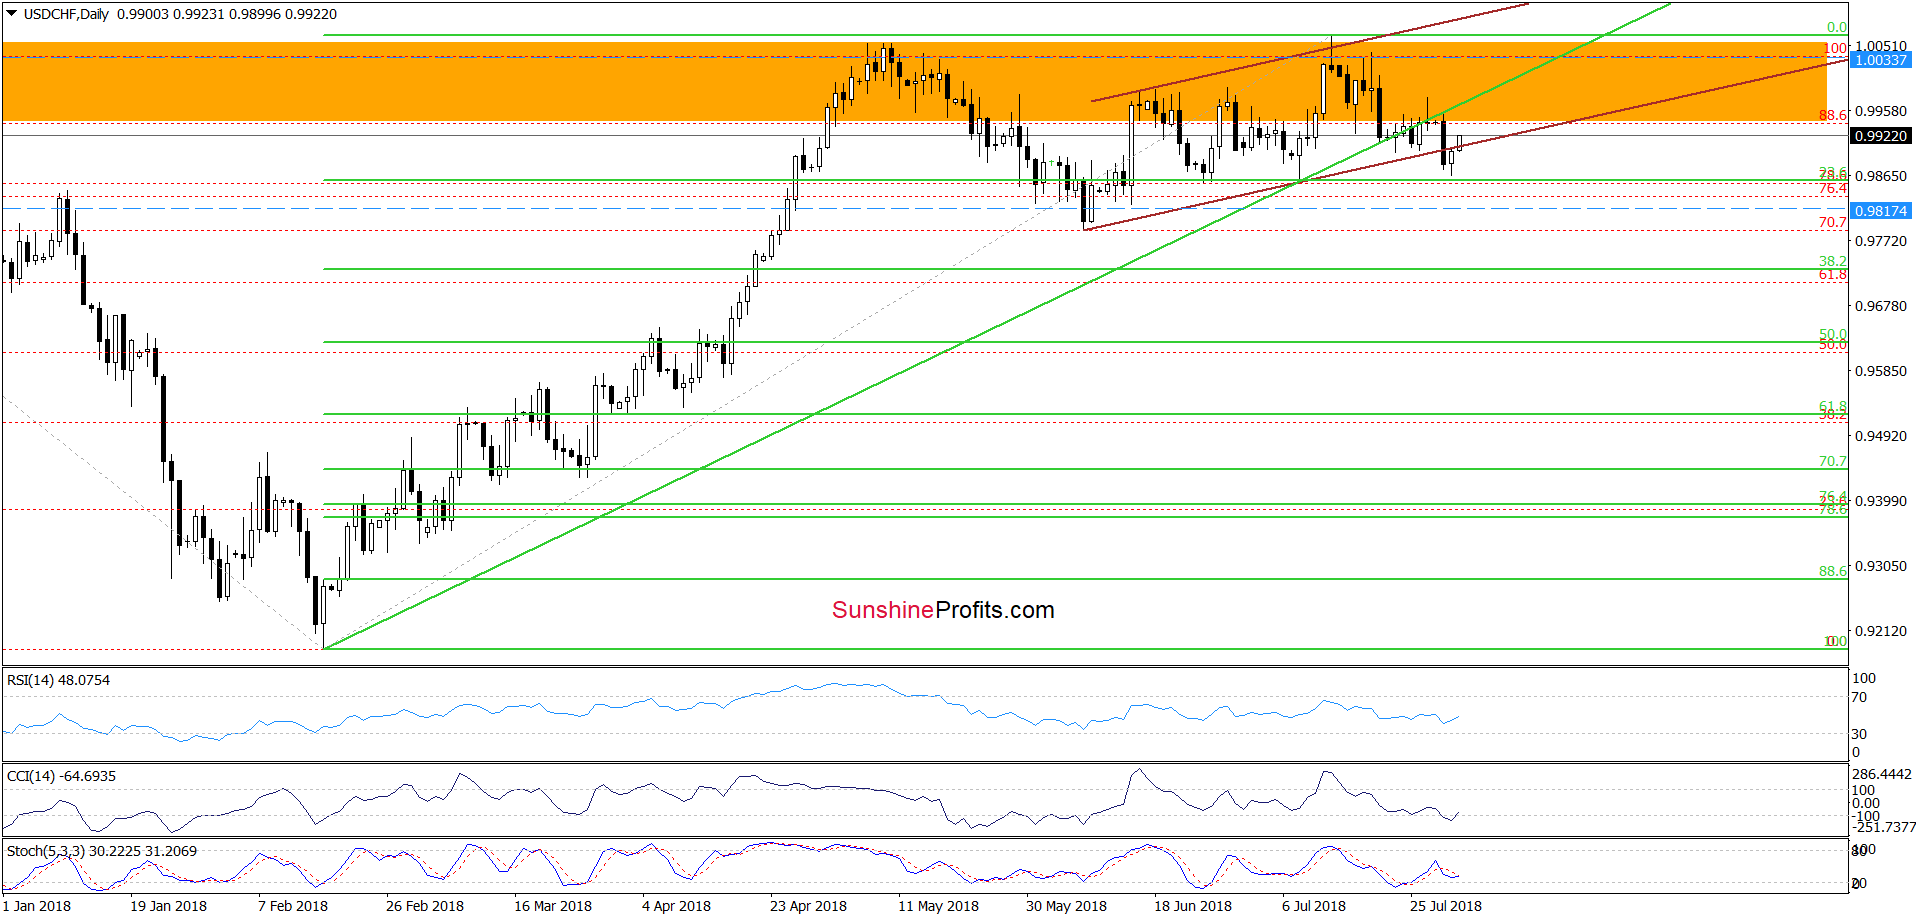
On the daily chart, we see that although USD/CHF slipped under the lower border of the brown rising trend channel, this deterioration was quite temporary, and the pair came back into the channel earlier today. Nevertheless, the situation will be more positive if the exchange rate closes today’s above this line (in this case we’ll see an invalidation of the earlier small breakdown).
If we see such price action, USD/CHF will likely also test the previously-broken medium-term green support/resistance line in the following day(s). On the other hand, however, if currency bulls fail, we can see a test of the strength of the nearest support zone created by the 23.6% Fibonacci retracement, the last June and July lows.
Trading position (short-term; our opinion): No positions are justified from the risk/reward perspective. We will keep you informed should anything change, or should we see a confirmation/invalidation of the above.
AUD/USD
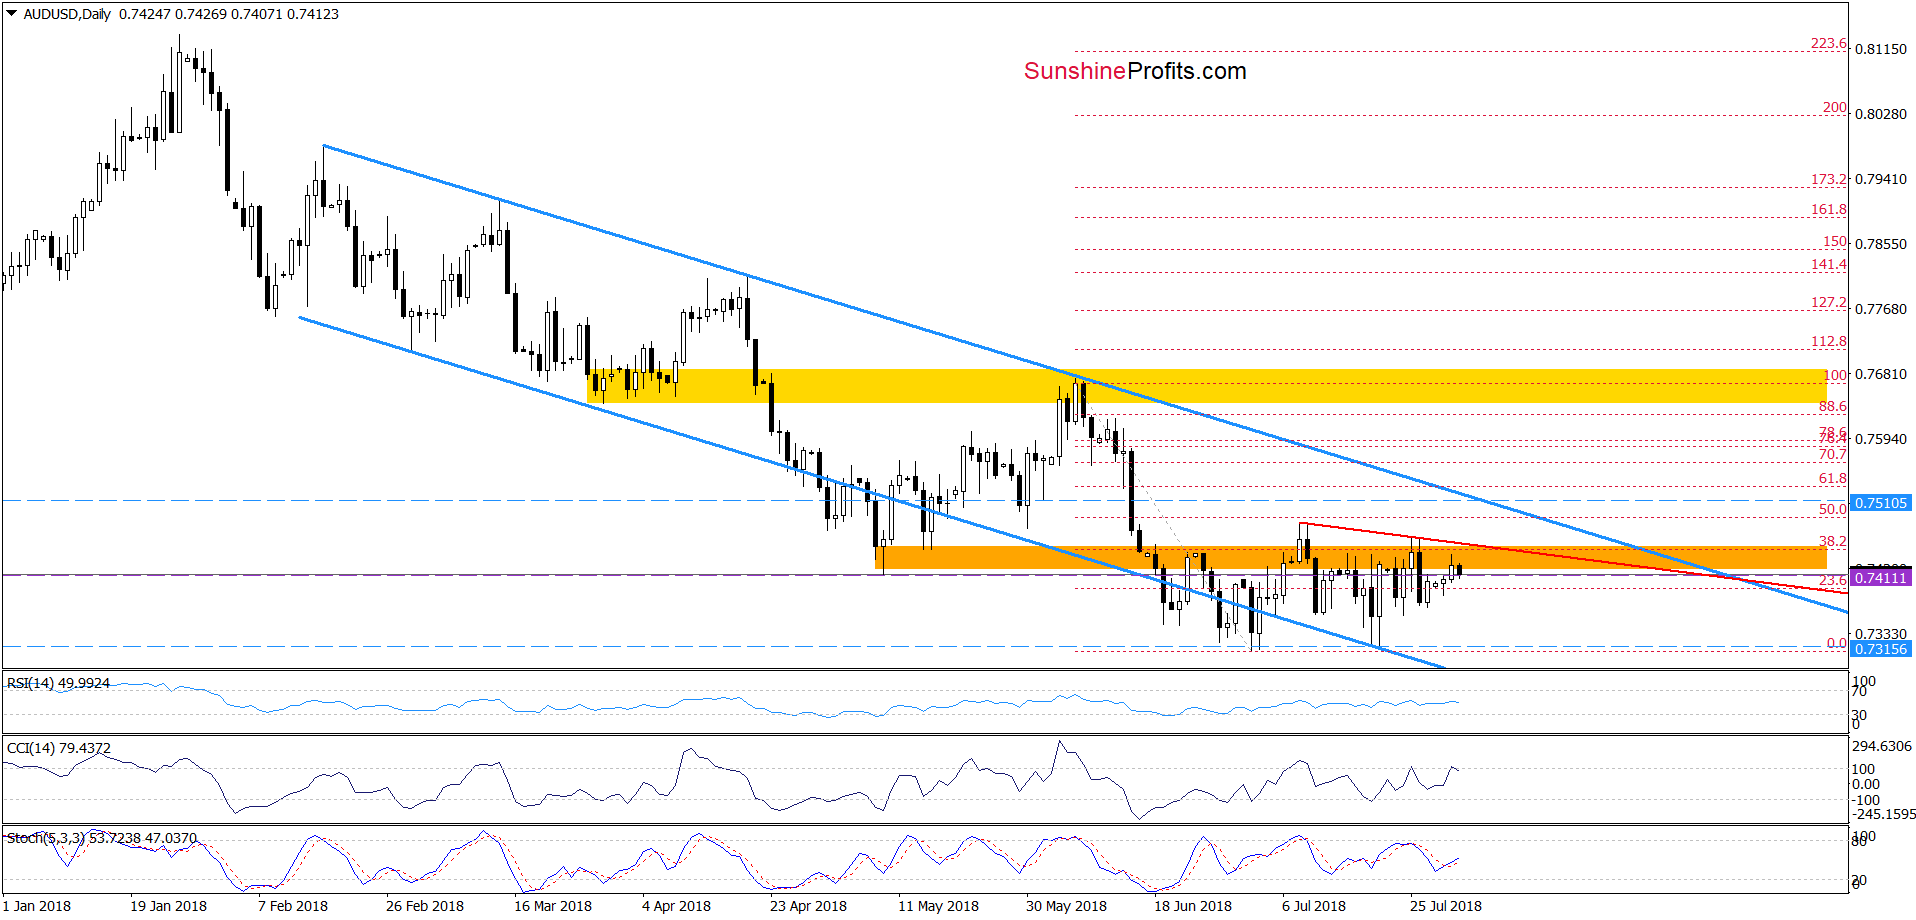
From today’s point of view, we see that the overall situation in the very short term hasn’t changed much as the orange resistance zone continues to keep gains in check.
Therefore, we believe that what we wrote in our last commentary on this currency pair is up-to-date also today:
(…) the pair is still trading under the red declining resistance line based on the previous highs (similar to EUR/USD), which means that higher values of the exchange rate will be seen only if we see a breakout above it.
Until this time, another reversal and decline should not surprise us. How low could the pair go if the situation develops in line with our assumptions?
In our opinion, if AUD/USD extends losses from current levels, the exchange rate will (at least) decline to the earlier July lows or even test the lower border of the blue declining trend channel in the coming week.
Trading position (short-term; our opinion): short positions with a stop-loss order at 0.7510 and the initial downside target at 0.7315 are justified from the risk/reward perspective. We will keep you informed should anything change, or should we see a confirmation/invalidation of the above.
Thank you.
Nadia Simmons
Forex & Oil Trading Strategist
Przemyslaw Radomski, CFA
Founder, Editor-in-chief, Gold & Silver Fund Manager
Gold & Silver Trading Alerts
Forex Trading Alerts
Oil Investment Updates
Oil Trading Alerts

