

The recent upward move in the USD Index pushed the euro and the British pound lower, rewarding the sellers and making their short positions in EUR/USD and GBP/USD profitable. Are they still justified? Answer to this question and a brief overview of interesting proposals that would allow you earn once again you will find in today's alert.
Why we do not have any short position? We think that the best answer to this question will be the quote form our yesterday’s alert:
(…) if we notice reliable signals of the very short-term trend reversals, we’ll likely close our profitable short positions on EUR/USD and GBP/USD (yes, even before they reach our initial downside targets) (…)
As you will see and read below, the situation matured enough to close our short positions in the above-mentioned currency pairs and take profits off the table. All details of our decision we present below.
EUR/USD
Yesterday, we wrote the following:
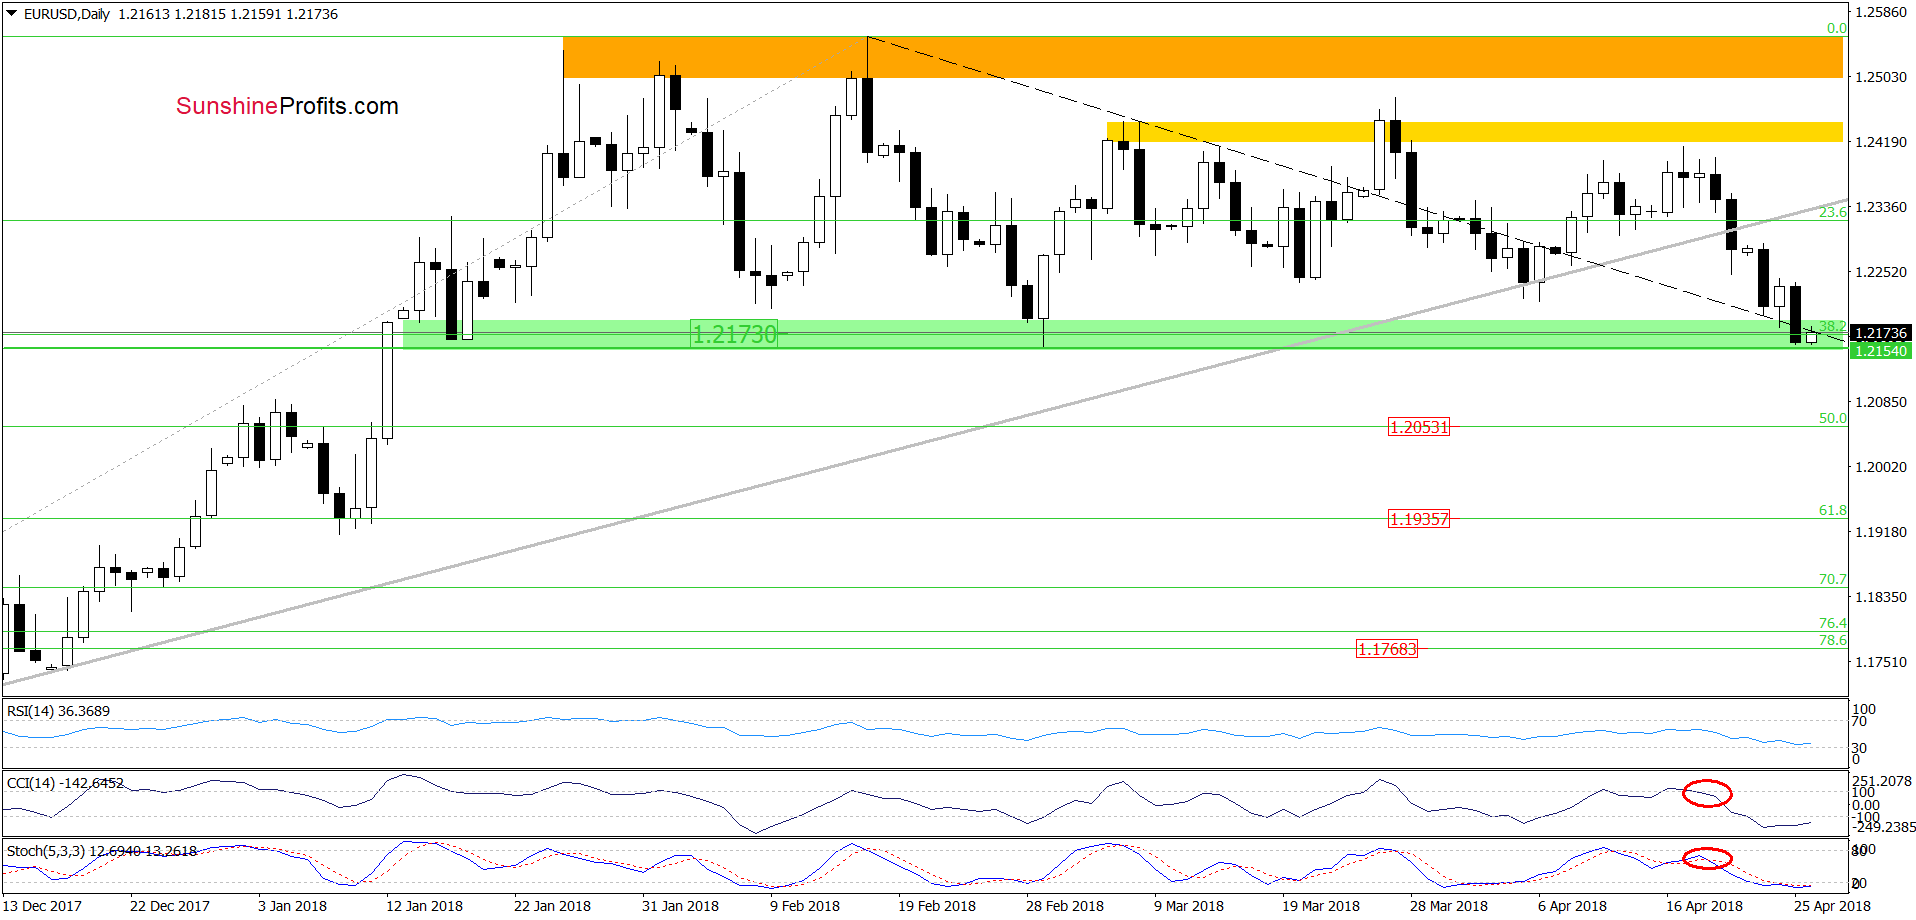
(…) currency bears pushed the pair lower earlier today, which suggests that we’ll see a re-test of the green support zone, the black dashed declining support line or even the March low in the coming day. This means that our short positions continue to be justified from the risk/reward perspective.
From today’s point of view, we see that the situation developed in line with the above scenario and EUR/USD extended losses yesterday, making our short positions more profitable.
Nevertheless, taking into account the importance of the green zone, the current position of the indicators and the situation in the USD Index (don’t worry, we will explain all these factors below) we decided to close our profitable short positions (as a reminder we opened them on Monday).
The Reasons
As we mentioned earlier, we decided to close them because of 3 reasons.
First, the importance of the green zone. What does it mean? When we take a look at the daily chart, we can clearly see that EUR/USD is trading in a sideways trend (between the above-mentioned green zone and the orange resistance zone) since the beginning of the year. This suggests that the probability of rebound from here is too big to justify keeping short positions – especially when we factor in the other two factors.
Second, the current position of the indicators. As you see on the daily chart, the CCI and the Stochastic Oscillator dropped and remains in their oversold areas since the beginning of the week, which suggests that the buy signals are just around the corner and currency bulls will likely use them to push the pair higher in the following days. Although the rebound could not be significant, we think that it’s not worth risking and take profits while they are certain.
Third, the situation in the USD Index.
On Tuesday, we wrote the following:
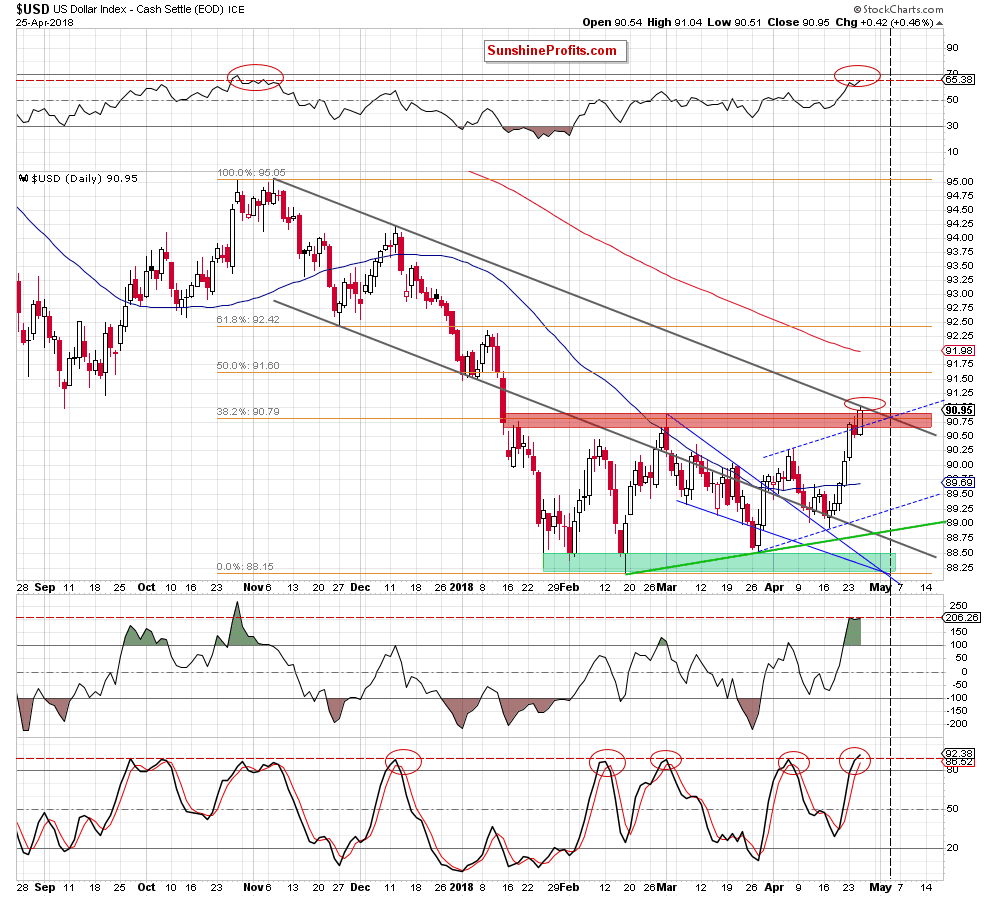
(…) the greenback reached the red resistance zone created by the previous peak and the 38.2% Fibonacci retracement, which suggests that we could see reversal in the coming day.
Nevertheless, when we take a closer look at the shape of the recent candlesticks, we clearly see that they grew bigger every day, which shows that the currency bulls grow in strength. What could this mean for the American currency? In our opinion, a breakout above the March peak and the test of the upper line of the gray declining trend channel in the coming days.
Looking at the above chart, we see that the situation developed in tune with our assumptions, which increases the probability of reversals (not only in the case of the index, but also in the case of our currency pairs) in the coming day(s).
Additionally, the RSI climbed to the highest level since late October 2017, while the CCI remains in its overbought area from several days and the Stochastic Oscillator moved above the level of 80. It is worth noting that such high reading of the last indicator preceded reversals many times in the past (we marked them with red ellipses), which increases the probability that the history will repeat itself once again in the very near future.
At this point, you can think: hey, but there are no sell signals, so the greenback could go higher. Yes, you are right, but as we mentioned earlier, the probability of reversal is too big to justify keeping our profitable positions open – especially when we facto in the current situation in other currency pairs, which we described below.
GBP/USD
Quoting our yesterday’s Forex Trading Alert:
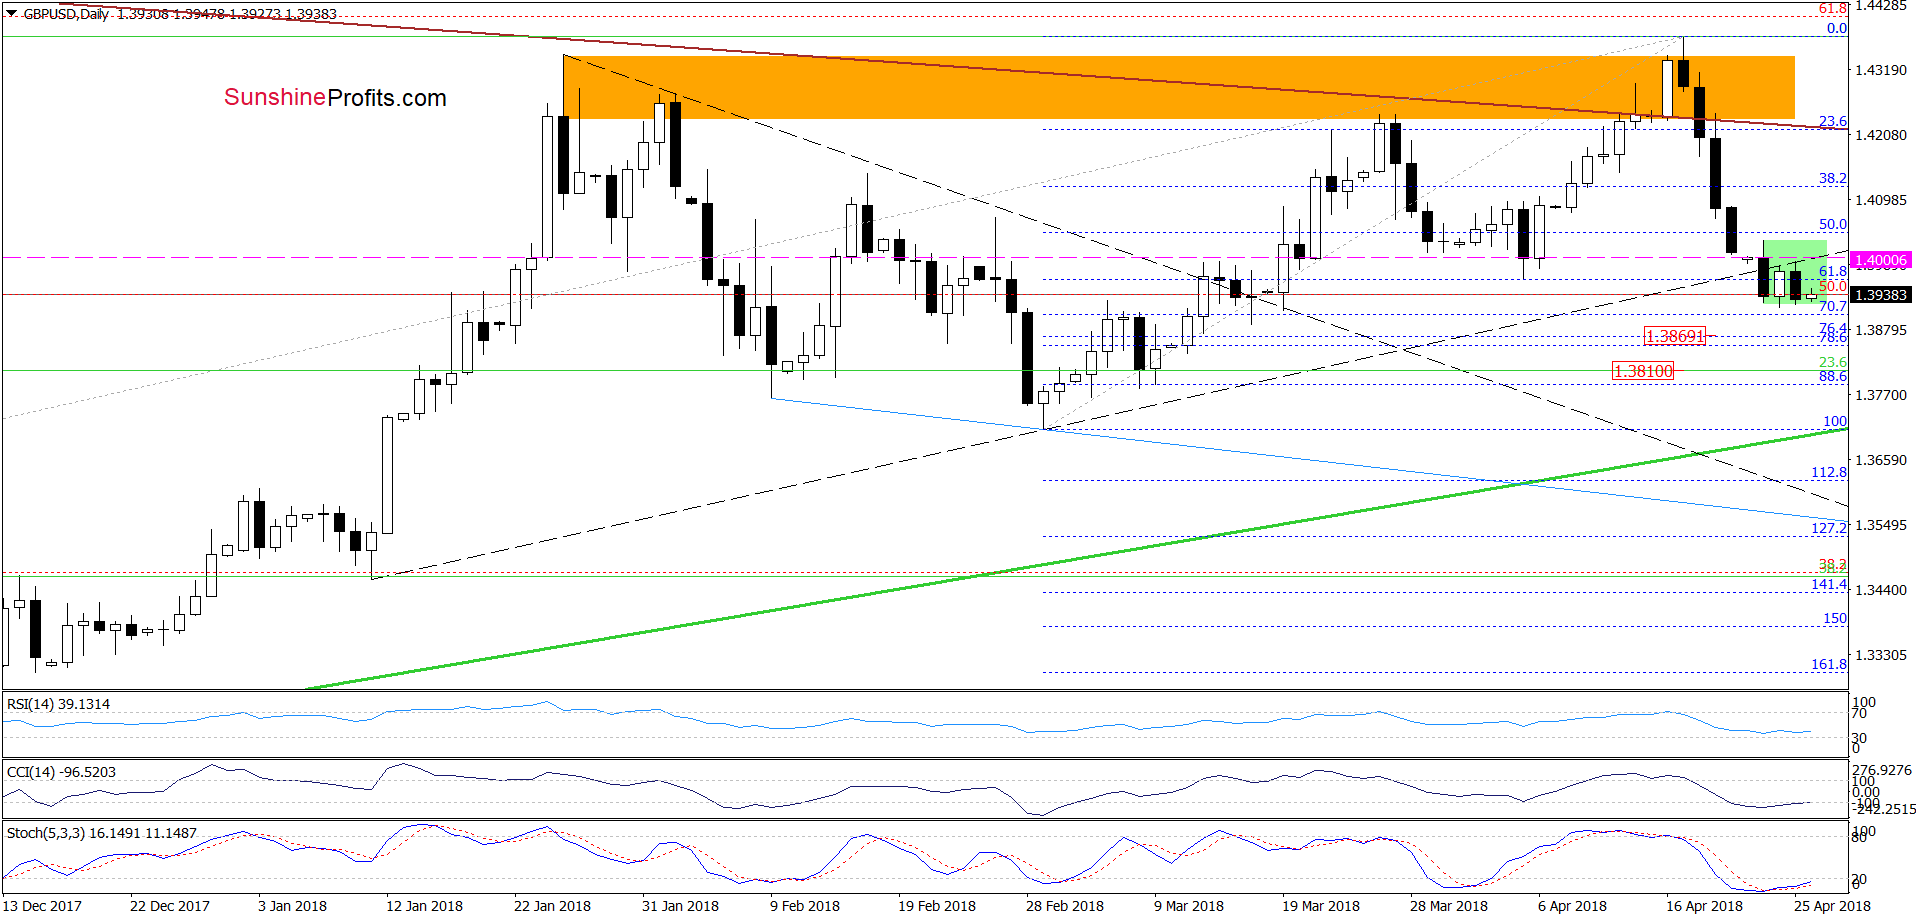
(…) the exchange rate increased a bit (compared to the recent downward move) and tested the previously-broken lower border of the black triangle (marked with dashed lines (…)).
Earlier today, currency bulls tried to go north once again, but the above-mentioned resistance line stopped them triggering a pullback. This suggests that we’ll see further deterioration and at least one more downswing (…)
Looking at the daily chart, we see that currency bears took GBP/USD lower yesterday as we had expected, making our short positions even more profitable.
What’s next? Well, on one hand, the pair remains under the above-mentioned lower border of the black triangle and the 61.8% Fibonacci retracement based on the March-April upward move, which suggests further deterioration and a drop to around 1.3870, where the next support area created by the 76.4% and 78.6% Fibonacci retracements (based on the March-April upward move) is.
Nevertheless, on the other hand, currency bulls also have several factors on their side. As you see on the daily chart, the pair is trading in the green consolidation, which suggests that the forces of the buyers and the sellers start to level up.
This fact in combination with the current position of the indicators (the RSI approached the level of 30, while the CCI and the Stochastic Oscillator generated buy signals), the situation in EUR/USD (and other currency pairs about which we wrote below) and the USD Index increases the probability of rebound in the coming days.
Let’s be honest, it is tempting to keep short positions open, but as the proverb says: "A bird in the hand is worth two in the bush." Therefore, we believe that closing short positions and taking profits off the table is justified from the risk/reward perspective.
USD/CAD
Yesterday, we wrote:
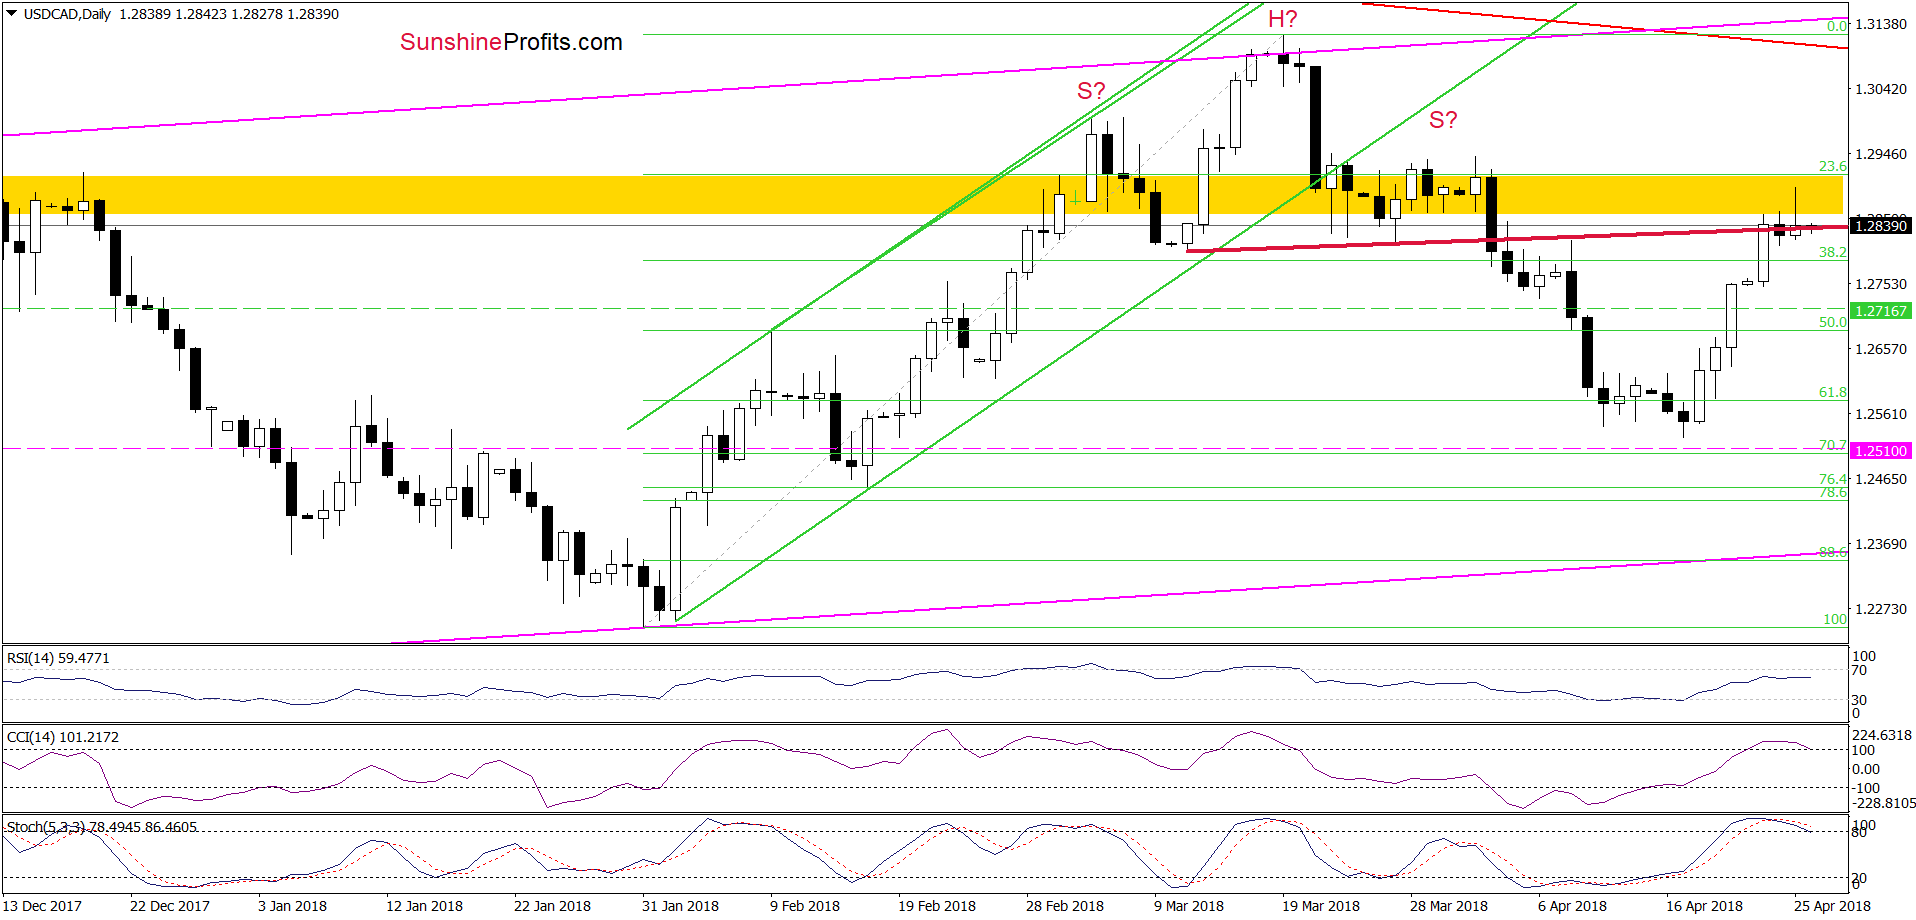
Although the exchange rate moved higher once again on Monday, the neck line of the head and shoulders formation (marked with red on the daily chart posted in our last commentary on this currency pair) stopped currency bulls yesterday, triggering a pullback. Despite this drop, they didn’t give up and pushed the pair higher earlier today.
Nevertheless, we should keep in mind that the way to the north is blocked by the yellow resistance zone and late March highs. Therefore, as long as there is no breakout above this area, higher values of USD/AD are not likely to be seen.
From today’s point of view, we see that the situation developed in line with the above scenario and USD/CAD pulled back after an increase to the yellow resistance zone. The shape of yesterday’s candlestick shows that the sellers are active in this area, increasing the probability of a bigger correction in the very near future.
On top of that, the Stochastic Oscillator generated a sell signal, while the CCI is very close to doing the same, confirming the above assumption.
What does it mean to us? That another opportunity to gain on short positions is just around the corner. So, why we do not open them at the moment of writing these words? Because we want to see the bears’ strength and a daily closure under the red line (the neck line of the head and shoulders formation, which rewarded our wallets in the previous week).
If we see such price action, we will likely open them tomorrow. As always, we will keep you informed should anything change, or should we see a confirmation/invalidation of the above.
USD/CHF
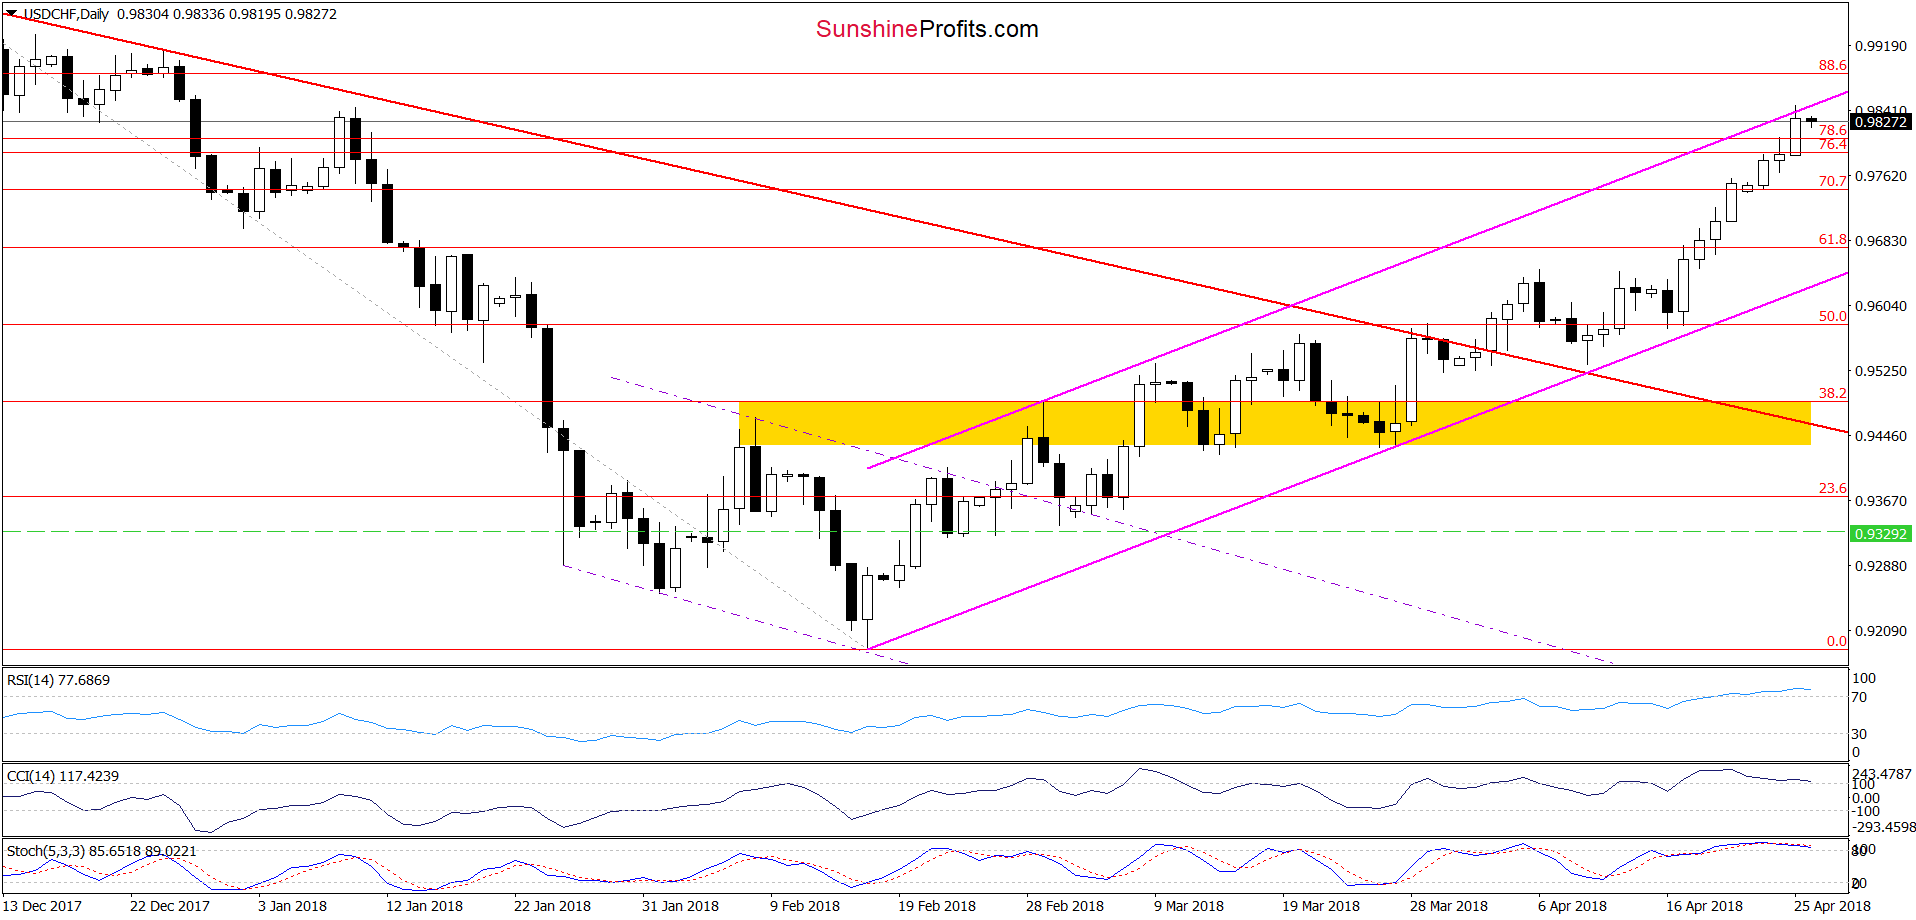
Looking at the daily chart, we see that USD/CHF touched the upper border of the pink rising trend channel and pulled back a bit yesterday, which means that our last commentary on this currency pair remains up-to-date also today:
The pair extended gains and climbed to the important resistance area created by the upper border of the pink rising trend channel and the 76.4% and 78.6% Fibonacci retracements, which suggests that reversal may be just around the corner. Is we see such price action and reliable signs of the bulls’ weakness, similarly to what we wrote in the case of USD/CAD, we’ll consider opening short positions.
AUD/USD
Yesterday, we wrote:
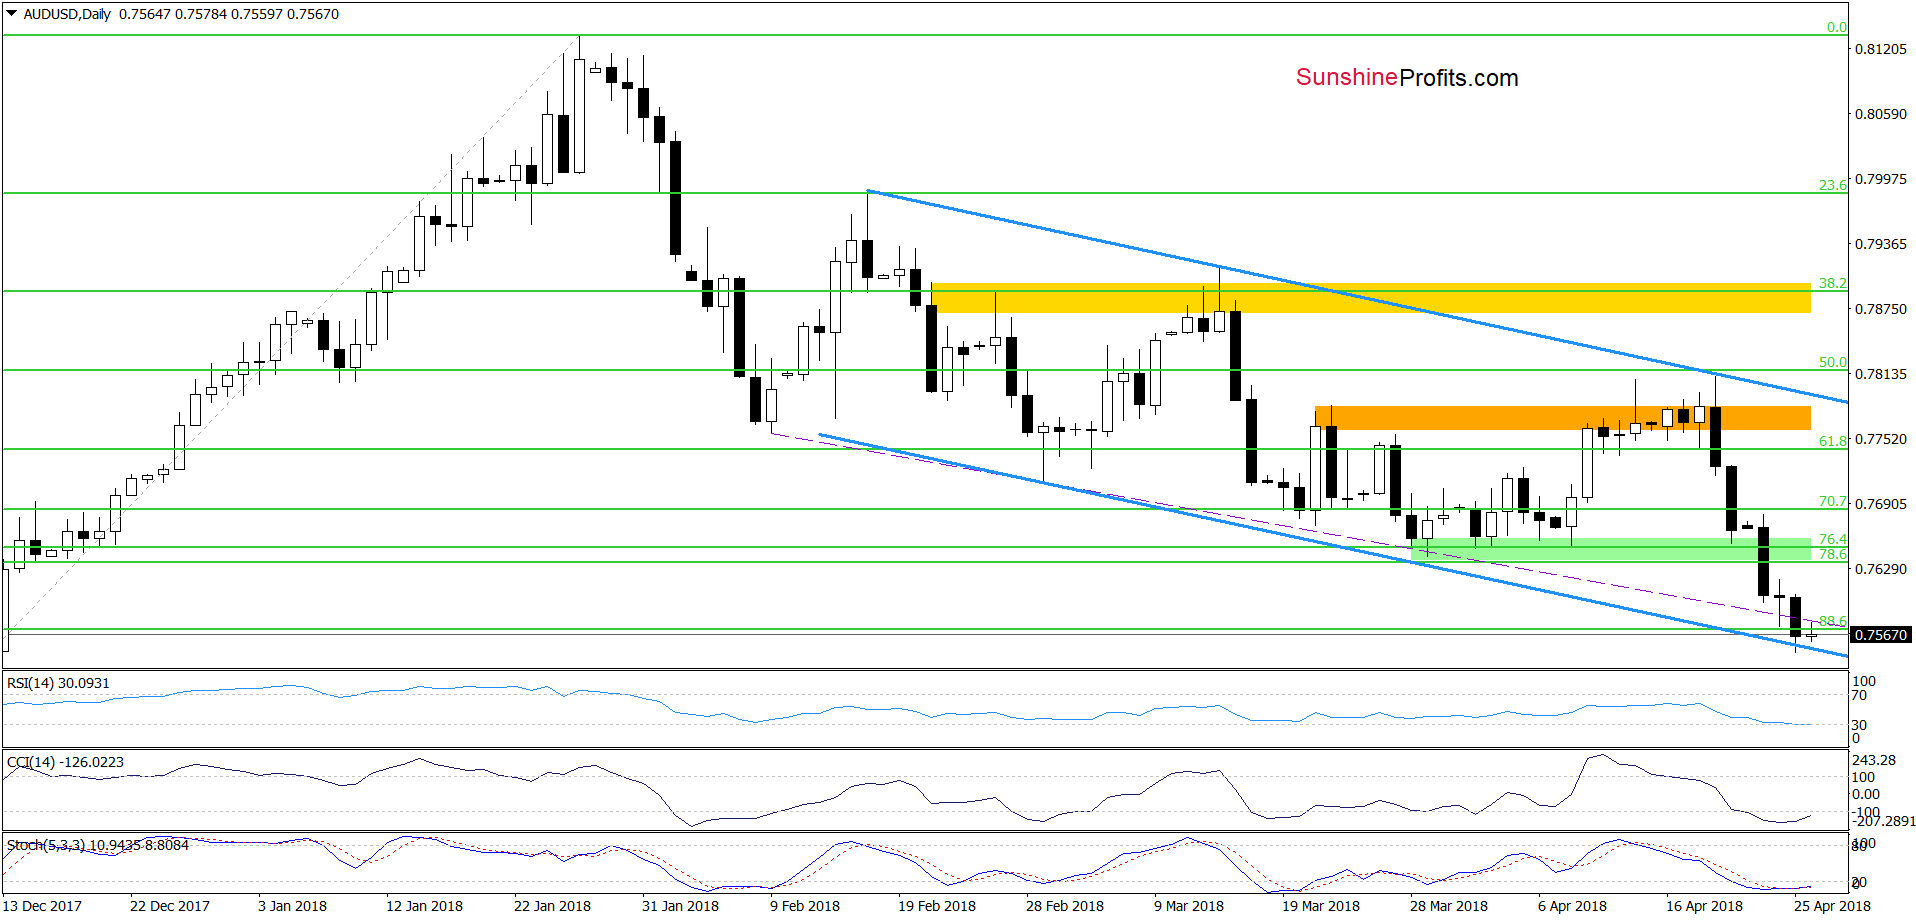
Although the pair increased a bit yesterday, currency bulls didn’t show any sign of strength, which resulted in another pullback earlier today. This means that the pair will test the lower border of the blue declining trend channel (…)
On the daily chart, we see that currency bears took AUD/USD lower as we had expected. Thanks to yesterday’s downswing the pair reached our downside target, which in combination with the current position of the indicators (all daily indicators dropped to their oversold areas, increasing the probability of buy signals n the very near future) and situation in all the above-mentioned currency pairs and the USD Index suggests that reversal and higher values of AUD/USD are just around the corner.
Nevertheless, just like we wrote in the case of USD/CAD, we want to see the buyers’ strength in this area before we decide to open long positions.
Connecting the dots, all currency pairs reached their important support/resistance areas, which in combination with the current situation in the USD Index suggests that we’ll see reversals in the very near future. Therefore, as we mentioned earlier, if we notice reliable signals of the very short-term trend reversals, we’ll likely open short and long positions in the above-mentioned currency pairs. We will keep you informed should anything change, or should we see a confirmation/invalidation of the above. So, please, stay tuned.
On an administrative note, due to your Editor’s travel plans for the rest of the week, the next few alerts will be shorter than the ones that we’ve been publishing recently. Of course, we will keep an eye on the market and we’ll keep posting the alerts on a daily basis, plus intraday alerts whenever the situation requires it.
Thank you.
Nadia Simmons
Forex & Oil Trading Strategist
Przemyslaw Radomski, CFA
Founder, Editor-in-chief, Gold & Silver Fund Manager
Gold & Silver Trading Alerts
Forex Trading Alerts
Oil Investment Updates
Oil Trading Alerts

