

Despite the fact that the bulls have a lot of reasons to complain from the beginning of this month, the U.S. dollar has finally reached the place where their bad streak can be reversed. Which technical factors can support them in the fight for higher values of the greenback in the coming days?
- EUR/USD: short (a stop-loss order at 1.1878; the initial downside target at 1.1343)
- GBP/USD: none
- USD/JPY: long (a stop-loss order at 111.60; the next upside target at 113.45)
- USD/CAD: none
- USD/CHF: none
- AUD/USD: none
Focus on the Greenback
Before we analyze the current technical situation of individual currency pairs, let's take a closer look at the recent changes in the USD Index.
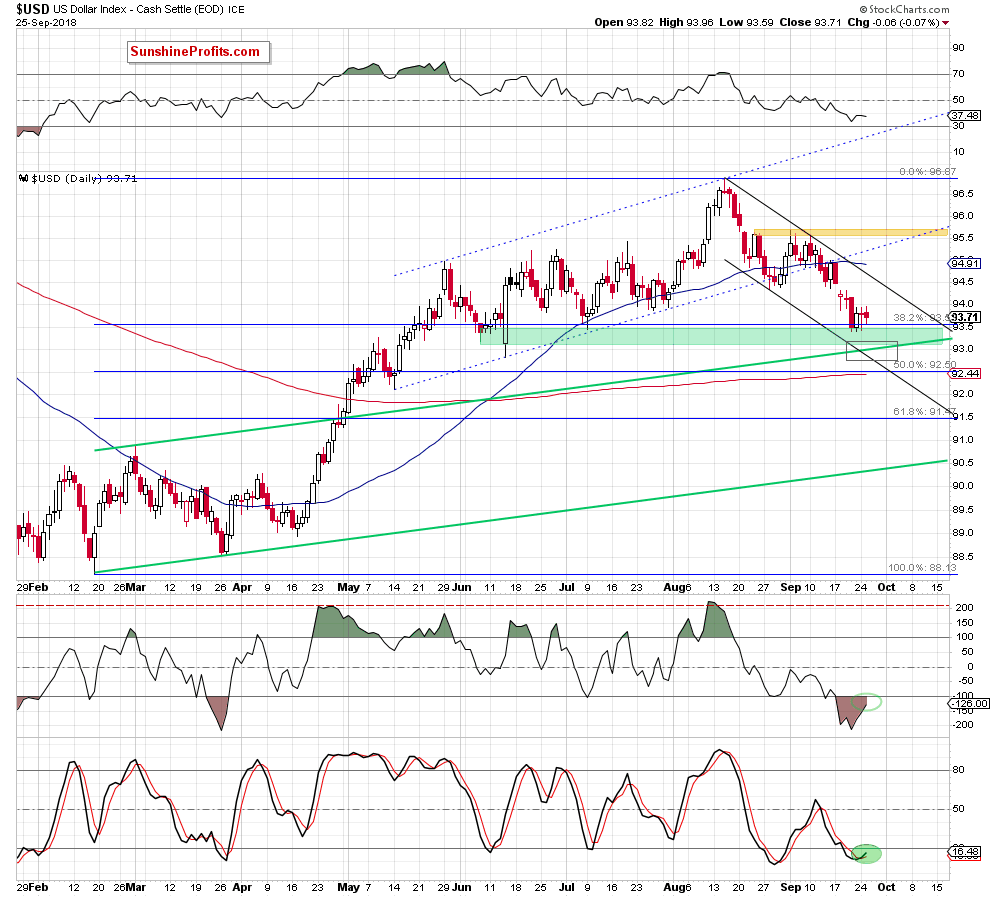
From today’s point of view, we see that September declines took the greenback to the green support are created by the 38.2% Fibonacci retracement and the June and July lows, which resulted in a consolidation around the upper border of the zone.
Such price action usually means that the forces of the sellers and the buyers are starting to balance, and it can bring the upcoming change of the direction in which the index has moved until now - even if we see one more downswing first (in our case, the greenback could test the previously-broken upper border of the long-term green rising trend channel or even the lower line of the short-term black declining trend channel, which has formed since mid-August).
Finishing this part of today’s alert, it is also worth noting that the pro-growth scenario is reinforced by the current position of the daily indicators as the Stochastic Oscillator generated a buy signal, while the CCI is very close to doing the same.
EUR/USD
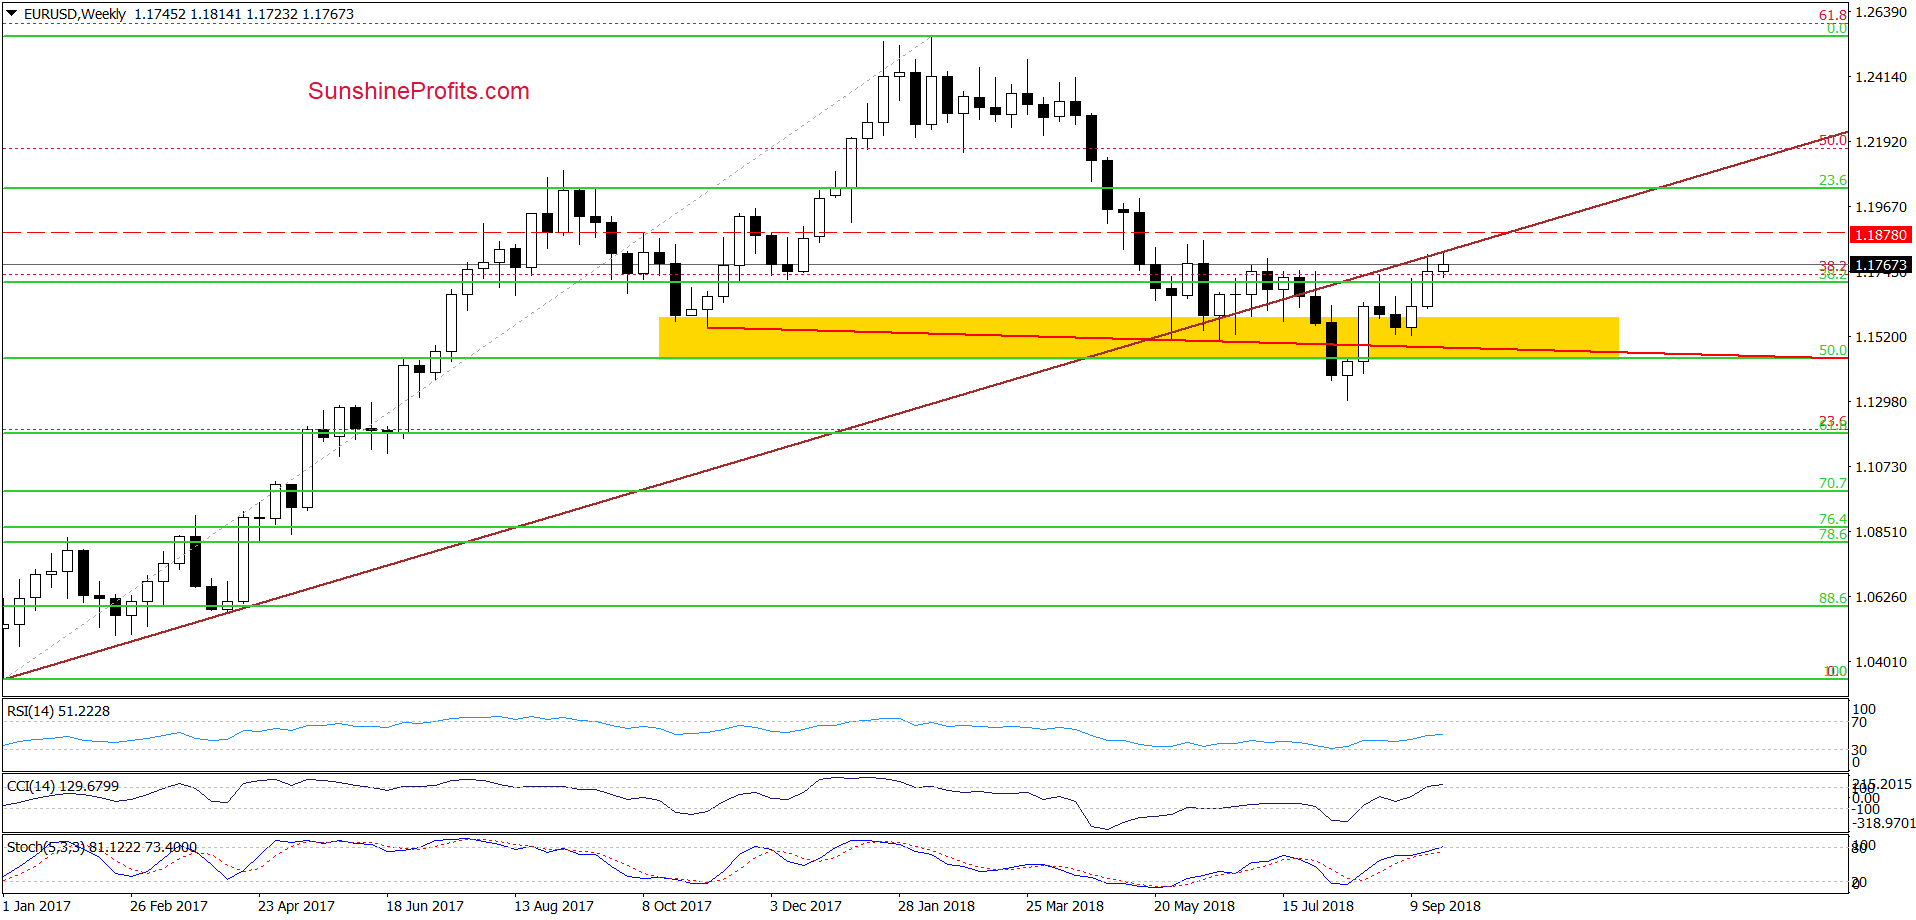
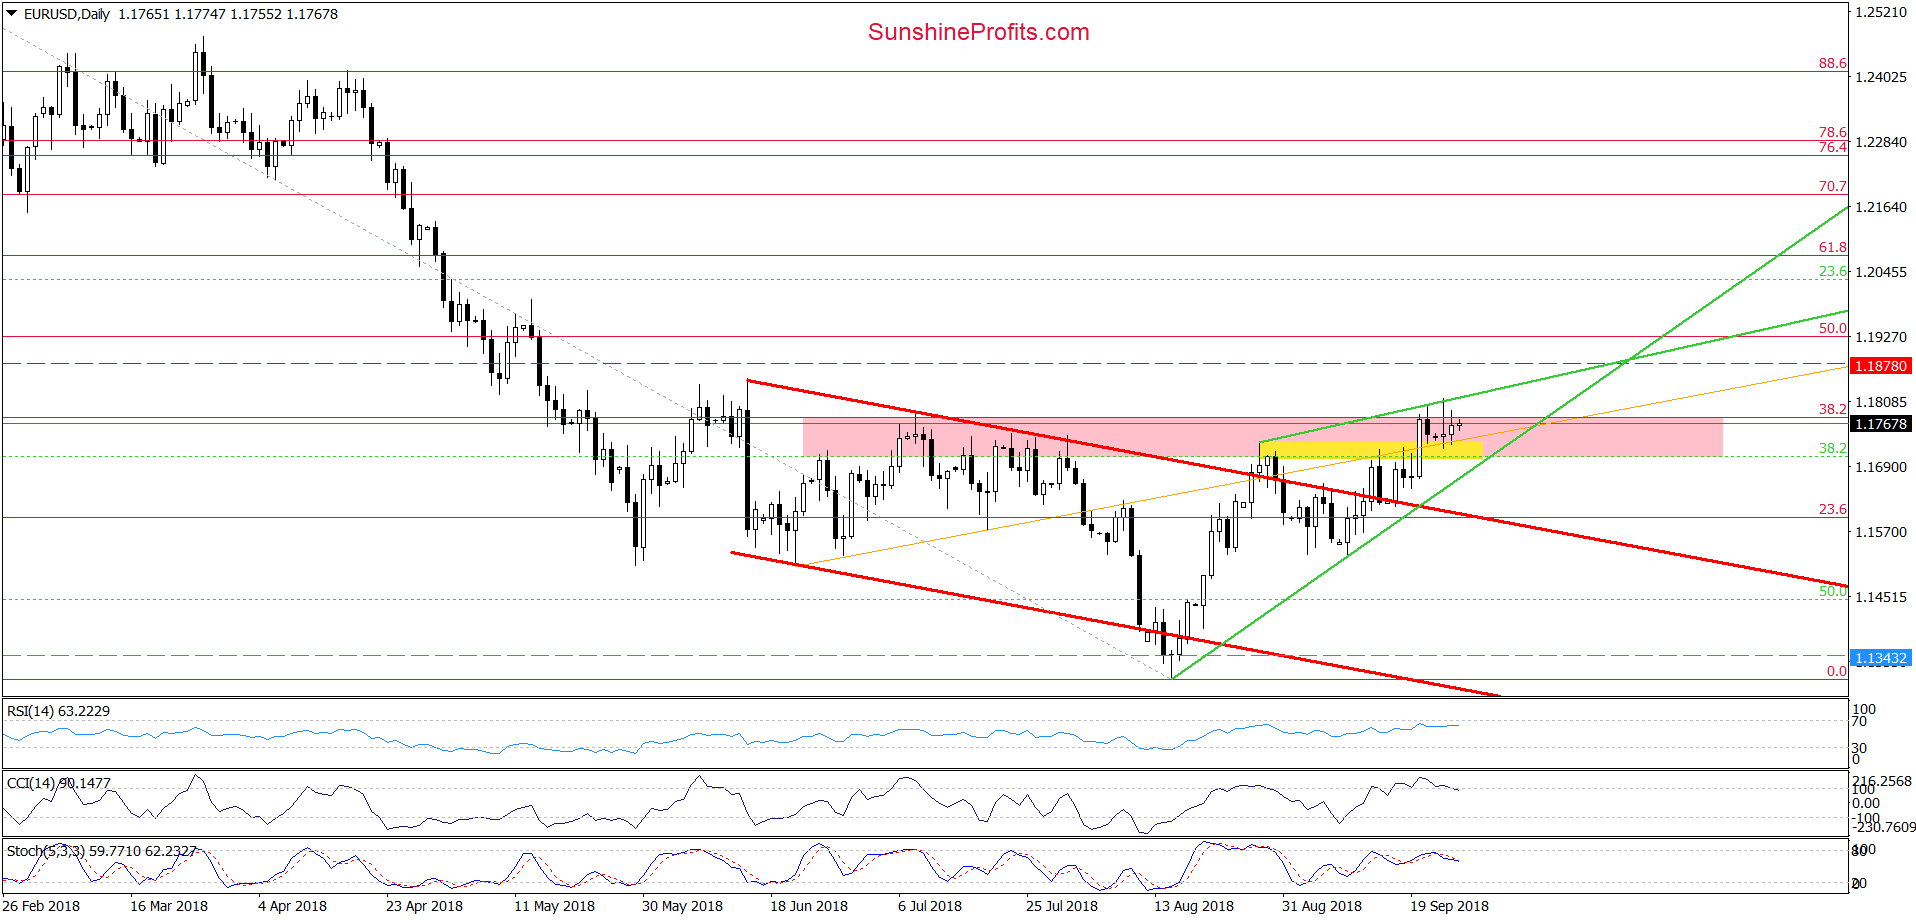
Looking at the above charts, we see that although currency bulls tries to go higher since the beginning of the week, the combination of 4 important resistances (the previously-broken long-term brown line marked on the weekly chart, the 38.2% Fibonacci retracement based on the entire February-August downward move, the upper line of the pink resistance zone and the green resistance line based on the previous peaks) continues to keep gains in check.
Such price action increases the probability of a bigger move to the downside in the very near future – especially when we factor in the above-mentioned current situation in the USD Index and the sell signals generated by the CCI and the Stochastic Oscillator before today’s U.S. market’s open.
Taking all the above into account, we believe that lower values of the exchange rate are just around the corner and if the pair closes one of the upcoming sessions below the green support line based on previous lows, we’ll likely increase our short positions.
Trading position (short-term; our opinion): Short positions with a stop-loss order at 1.1878 and the initial downside target at 1.1343 are justified from the risk/reward perspective.
GBP/USD
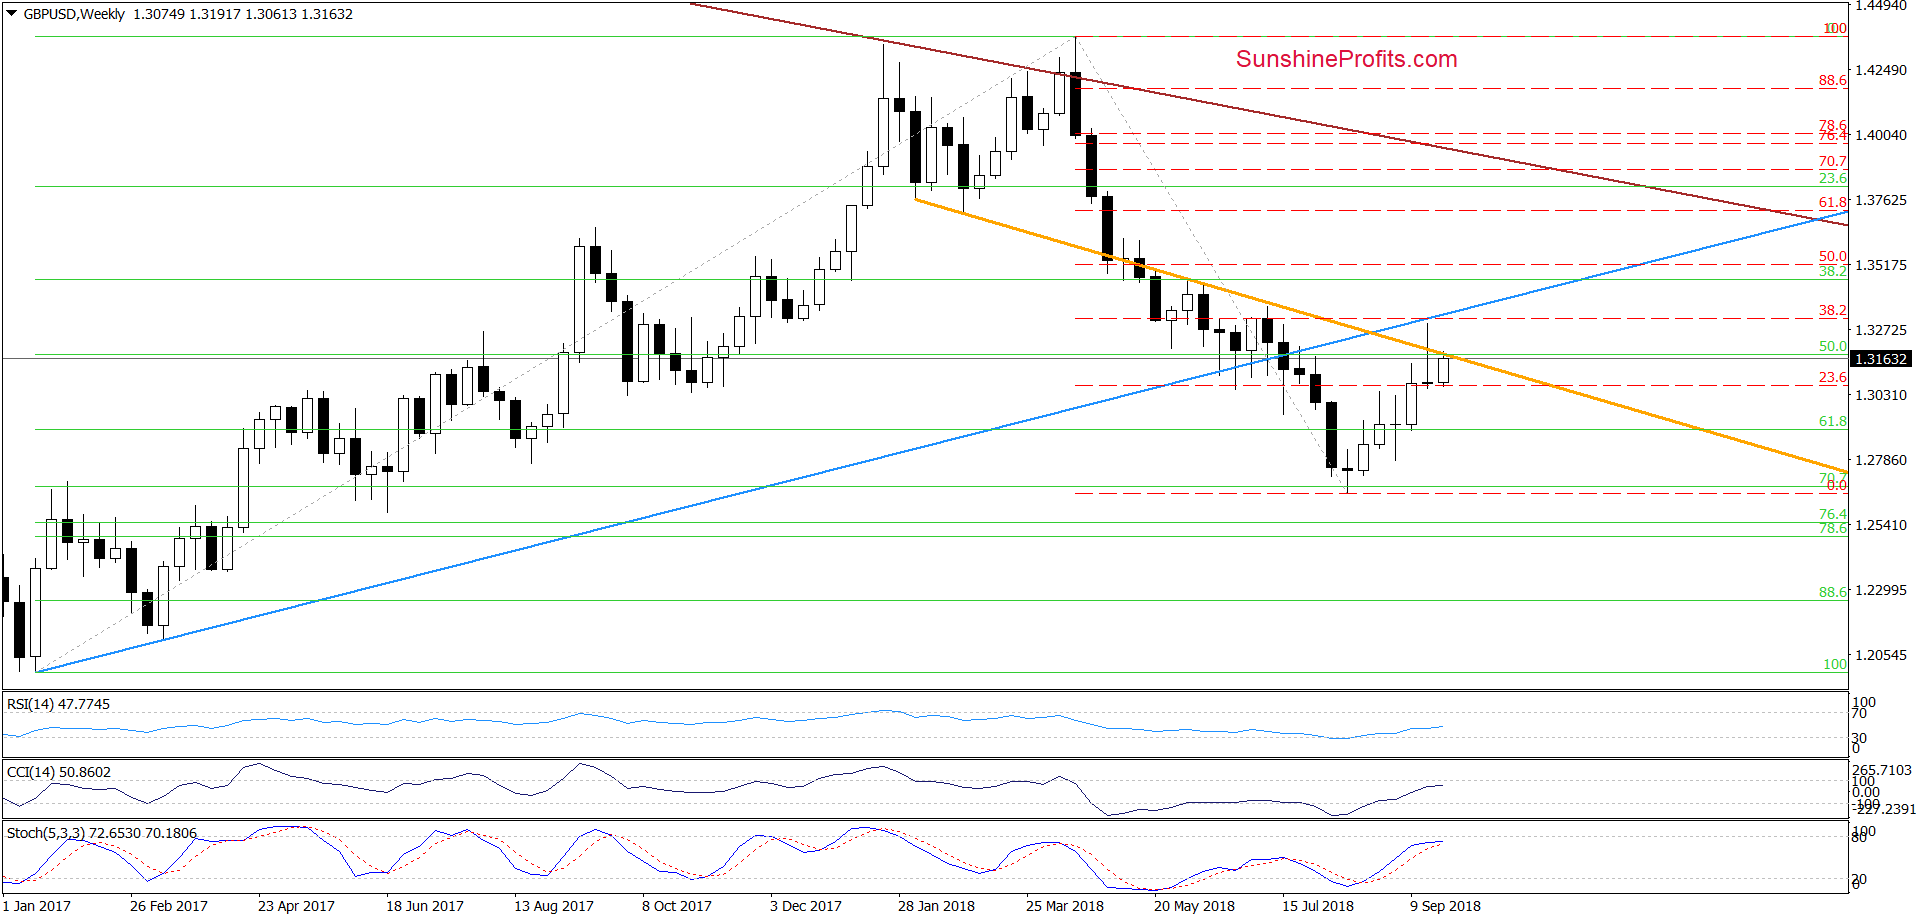
On the medium-term chart, we see that despite this week’s move to the upside, GBP/USD is still trading under the previously-broken orange resistance line, which was strong enough to stop currency bull several times in the past (mainly in May and June).
As you see, the buyers tried to break above it in the previous week, but the blue resistance line and the 38.2% Fibonacci retracement stopped them, triggering a sharp pullback, which took the exchange rate under the orange line.
Therefore, in our opinion, as long as there is no successful breakout above these resistances, lower values of GBP/USD are more likely than sizable move to the north.
Will the very short-term chart confirm this scenario? Let’s check.
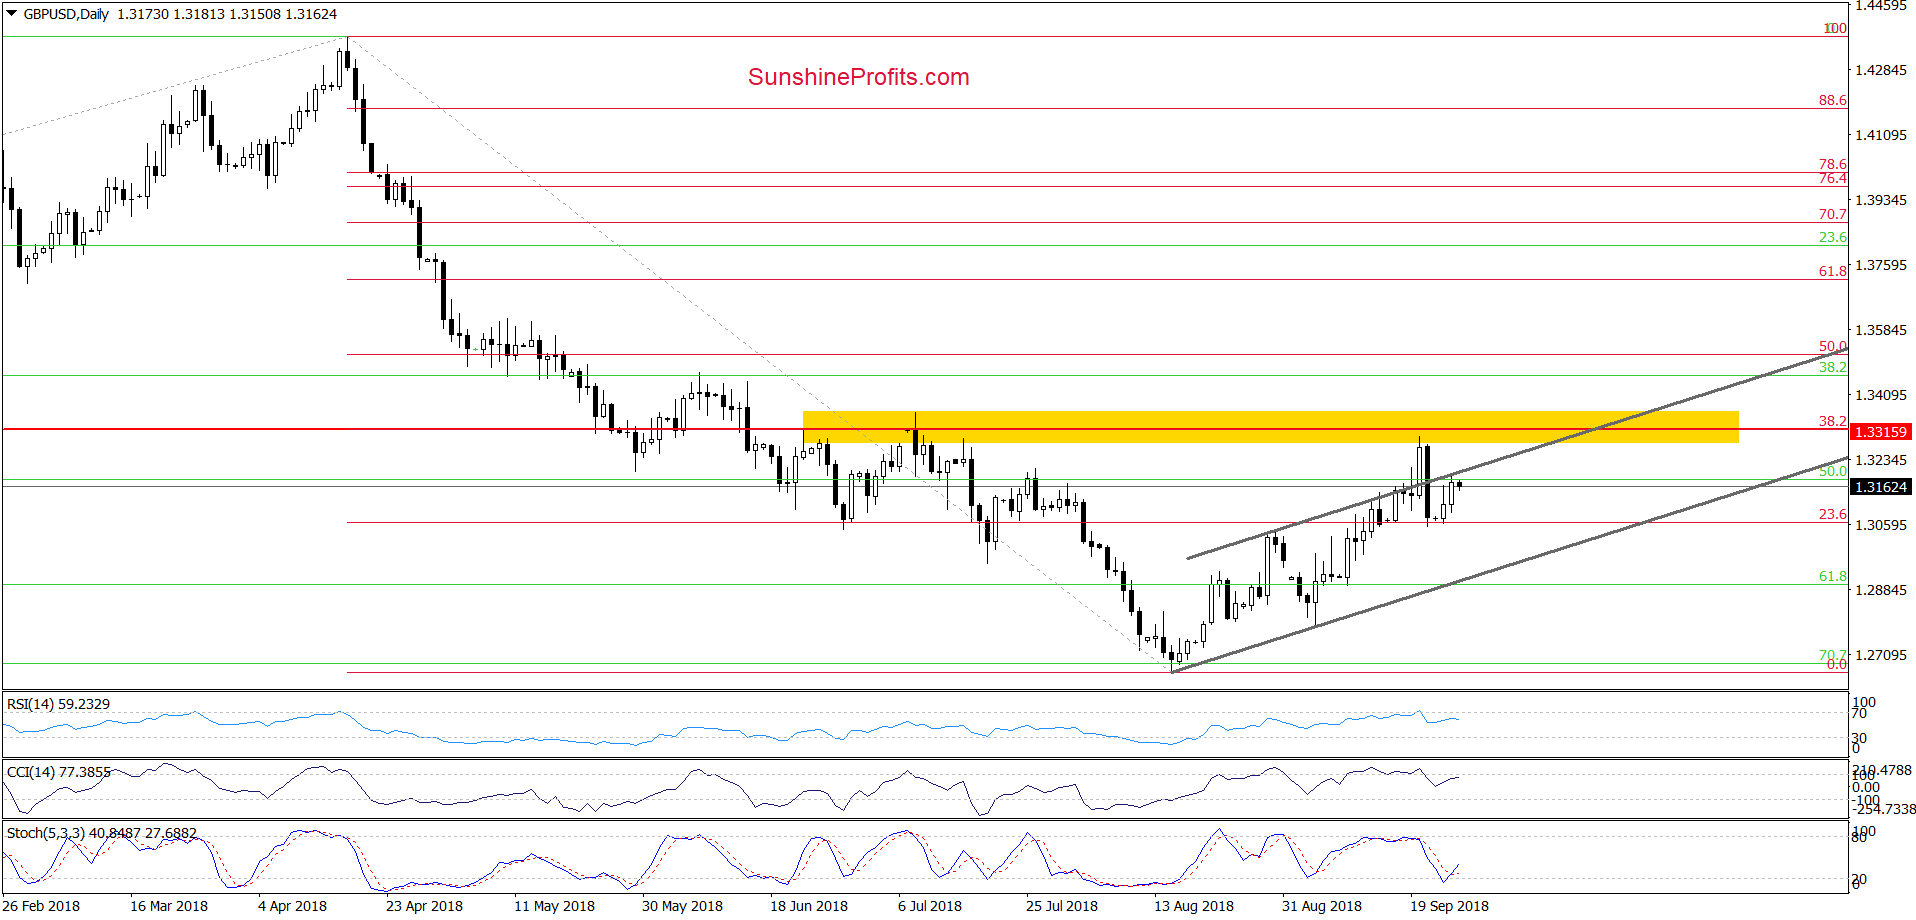
From this perspective, we see that GBP/USD bounced off the last week’s lows and came back to the previously-broken upper border of the grey rising trend channel, which looks like a verification of Thursday breakdown under this line.
If this is the case and currency bulls show weakness in this area, we’ll see another attempt to go lower in the very near future. Additionally, if the pair breaks under the Friday low, the way to the lower border of the grey trend channel will be open and we’ll likely open short positions. We will keep you informed should anything change, or should we see a confirmation/invalidation of the above.
Trading position (short-term; our opinion): No positions are justified from the risk/reward perspective.
USD/JPY
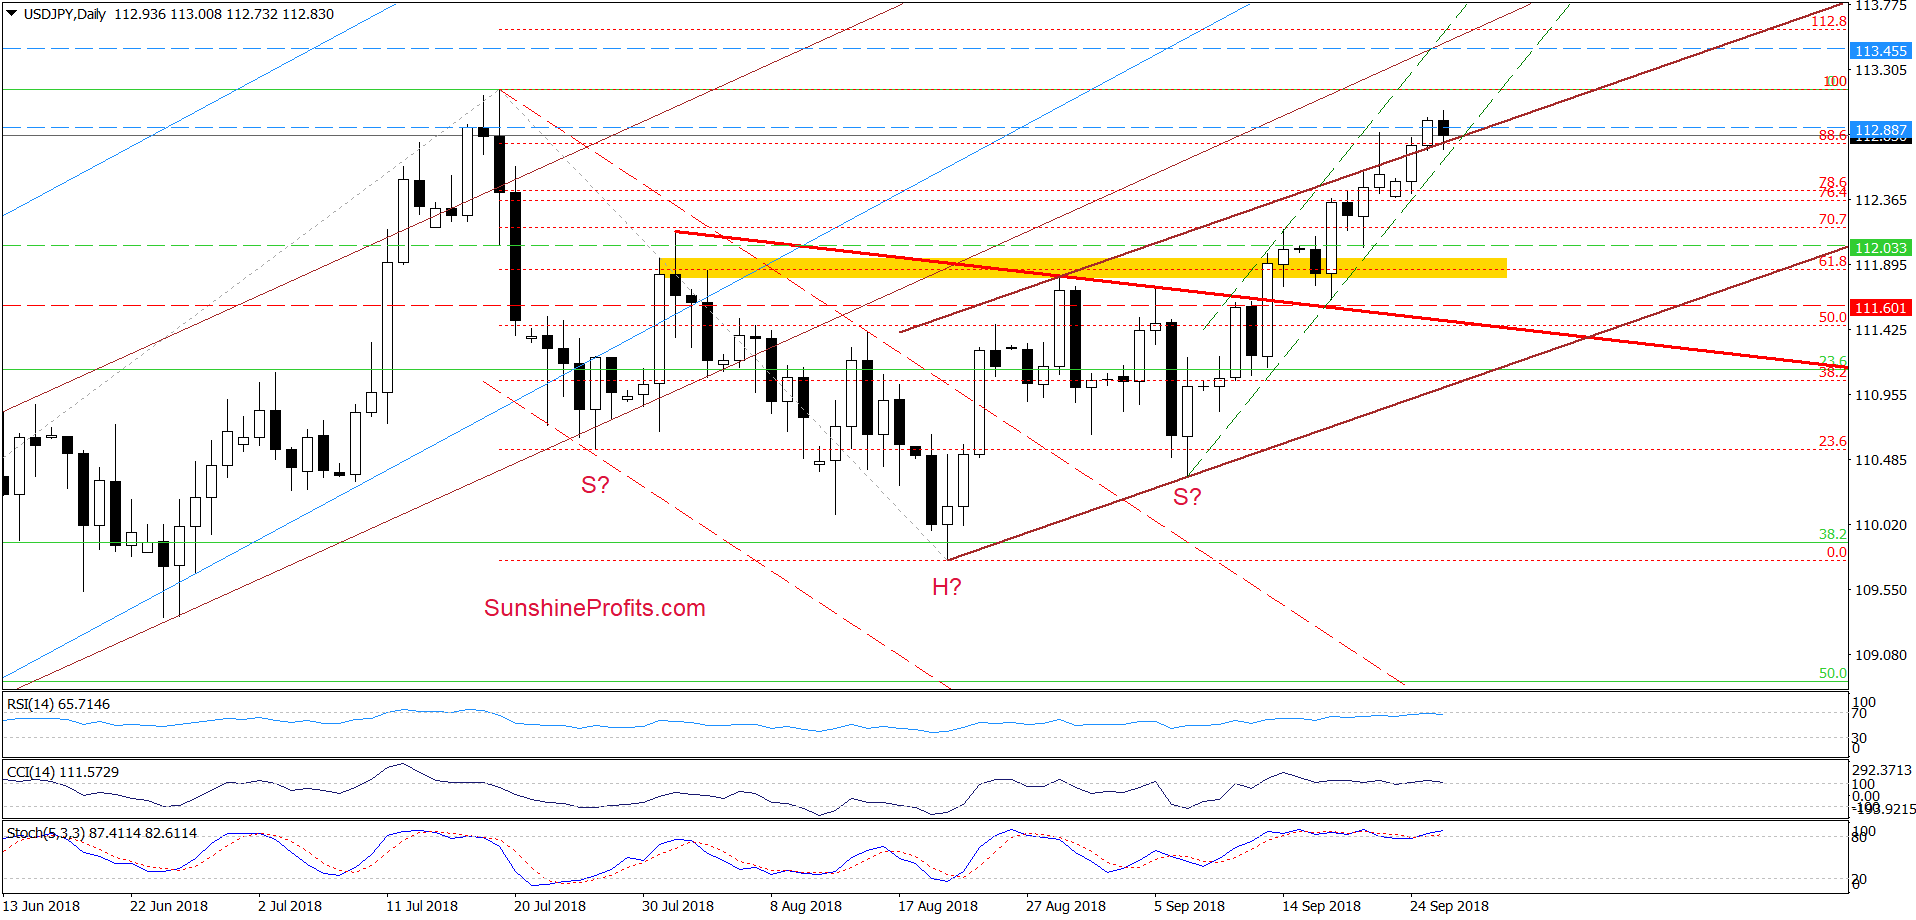
On Monday, USD/JPY increased above the upper border of the brown rising trend channel and closed the day above it, which triggered further improvement on the following day.
Earlier today, the exchange rate pulled back and tested the strength of the upper brown support line, which looks like verification of Monday’s breakout. Additionally, the exchange rate is still trading above the very short-term black dashed support line based on the September lows, which means that as long as there is no daily closure under these supports one more upswing and a test of July peak is very likely.
Trading position (short-term; our opinion): Profitable long positions with a stop-loss order at 111.60 (we decided to move it a bit higher as the exchange rate moves in our direction) and the next upside target at 113.45 are justified from the risk/reward perspective.
Thank you.
Nadia Simmons
Forex & Oil Trading Strategist
Przemyslaw Radomski, CFA
Founder, Editor-in-chief, Gold & Silver Fund Manager
Gold & Silver Trading Alerts
Forex Trading Alerts
Oil Investment Updates
Oil Trading Alerts

