

Although the euro increased against the greenback and broke above the last week’s peaks earlier this week, the very short-term picture of the exchange rate sends quite conflicting signals about who currently dominates the trading floor. When can we expect a breakthrough?
- EUR/USD: none
- GBP/USD: long (a stop-loss order at 1.2642; the upside target at 1.3050)
- USD/JPY: short (a stop-loss order at 114.68; the initial downside target at 112.34)
- USD/CAD:none
- USD/CHF: short (a stop loss order at 1.0192; the initial downside target at 0.9881)
- AUD/USD:none
EUR/USD
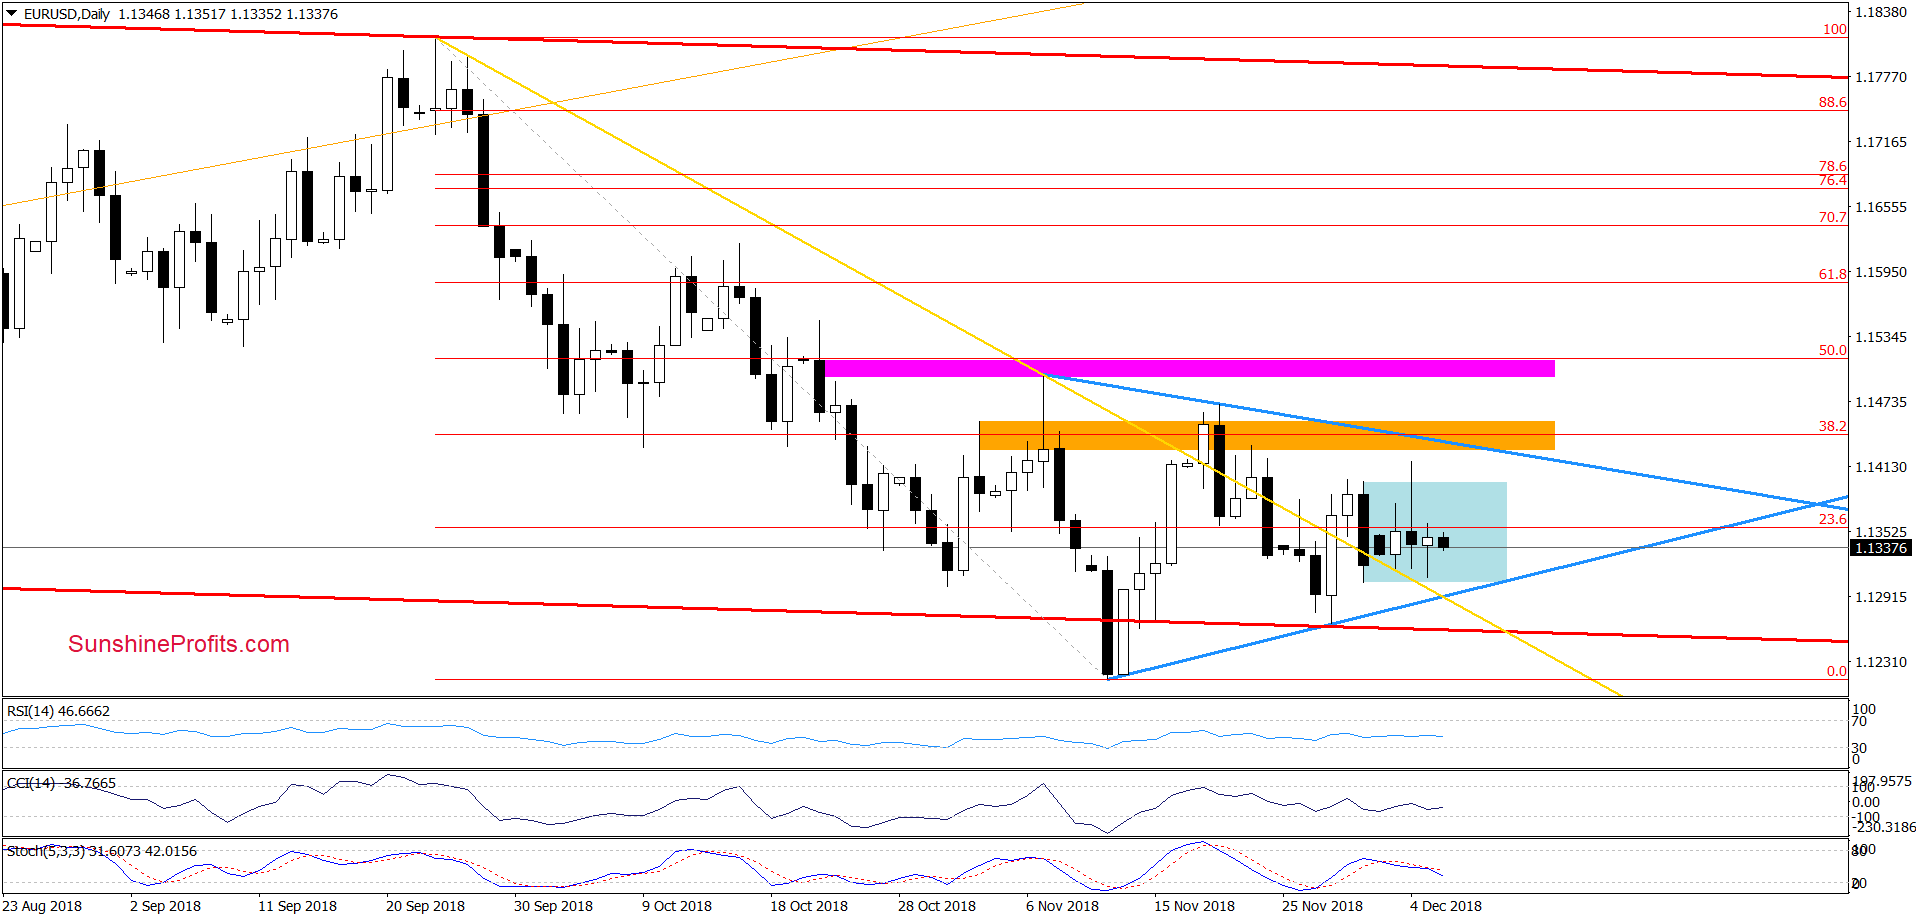
From today’s point of view, we see that although EUR/USD moved little higher during yesterday’s session, the overall situation in the very short term remains almost unchanged as the exchange rate continues its trade within the blue consolidation.
Therefore, we believe that our Tuesday’s comments on this currency pair are up-to-date also today:
(…) we continue to believe that as long as there is no breakout above the upper border of the triangle (or a breakdown under the lower line) another bigger move is not likely to be seen and short-lived moves in both directions should not surprise us in the coming days.
Nevertheless, if currency bulls show strength and manage to take the exchange rate above the nearest resistances, we’ll consider opening long positions. We will keep you informed should anything change, or should we see a confirmation/invalidation of the above.
Trading position (short-term; our opinion): No positions are justified from the risk/reward perspective.
USD/JPY
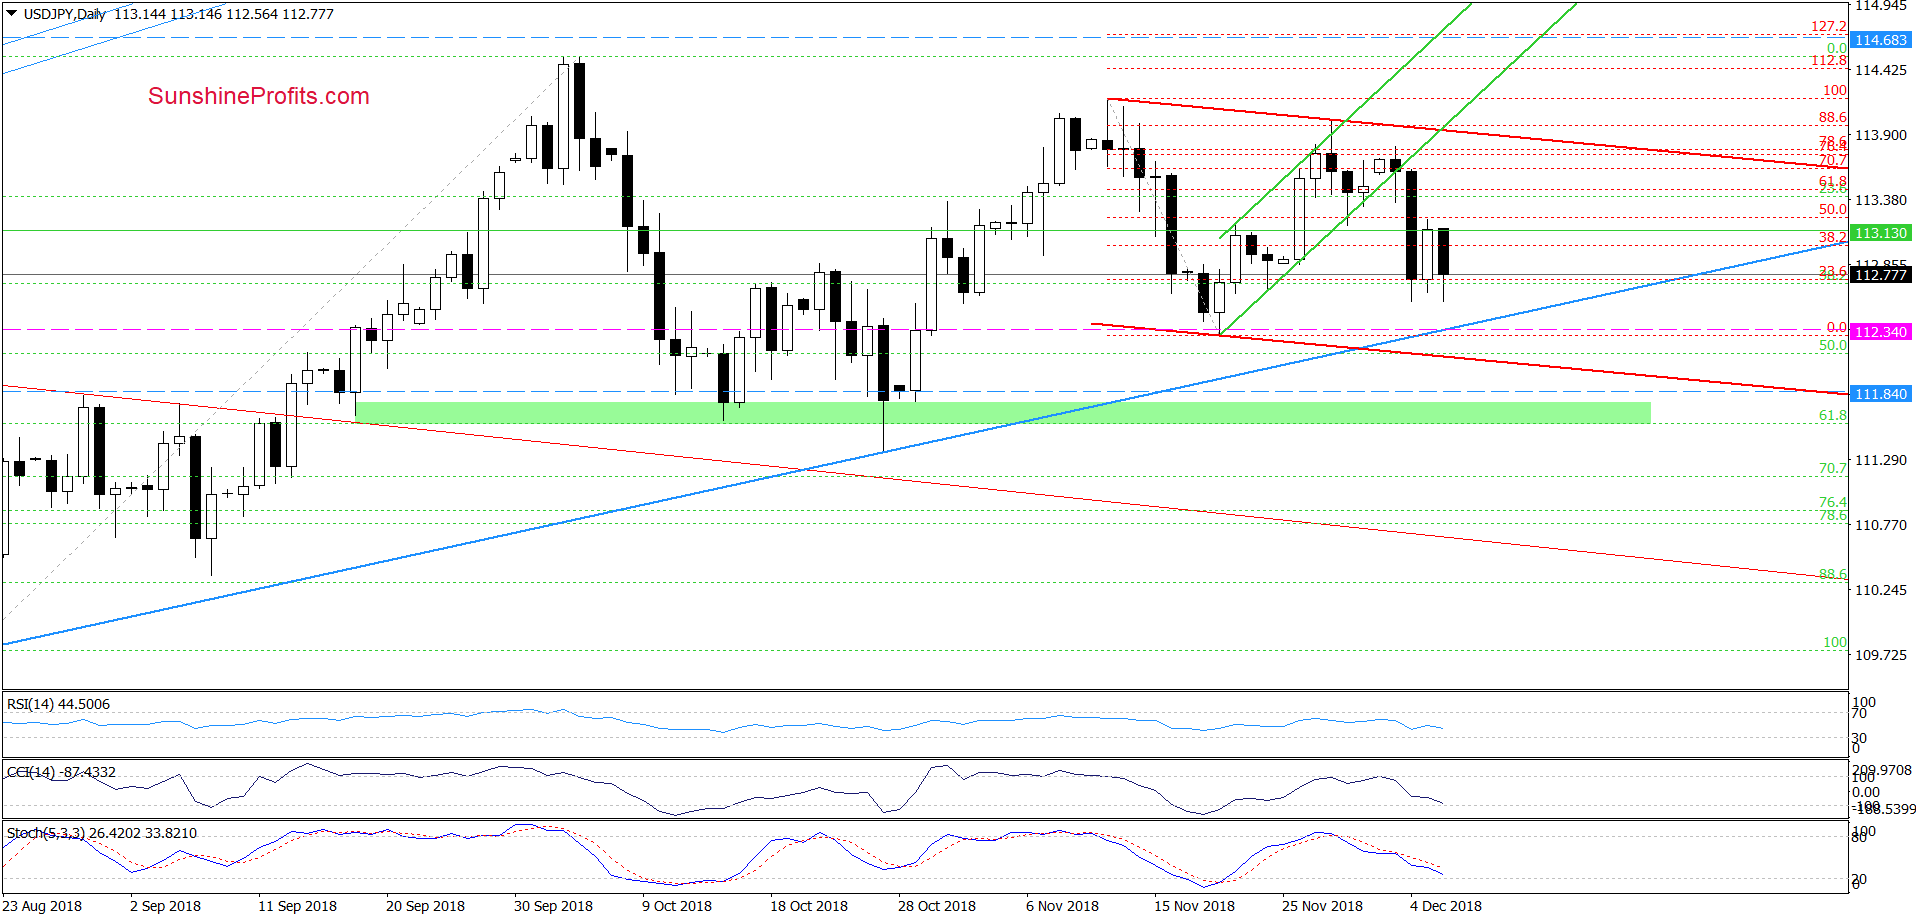
Yesterday, USD/JPY increased a bit, but despite this move, currency bears didn’t give up and erased Wednesday’s upswing earlier today. Thanks to this drop the pair tested this week’s low and rebounded in the following hours.
Nevertheless, the sell signals generated by the indicators continue to support the sellers, suggesting further deterioration and a test of the medium-term blue support line based on the August and October lows or even the November 20 low.
The pro-declining scenario is also reinforced by the medium-term picture of the pair.
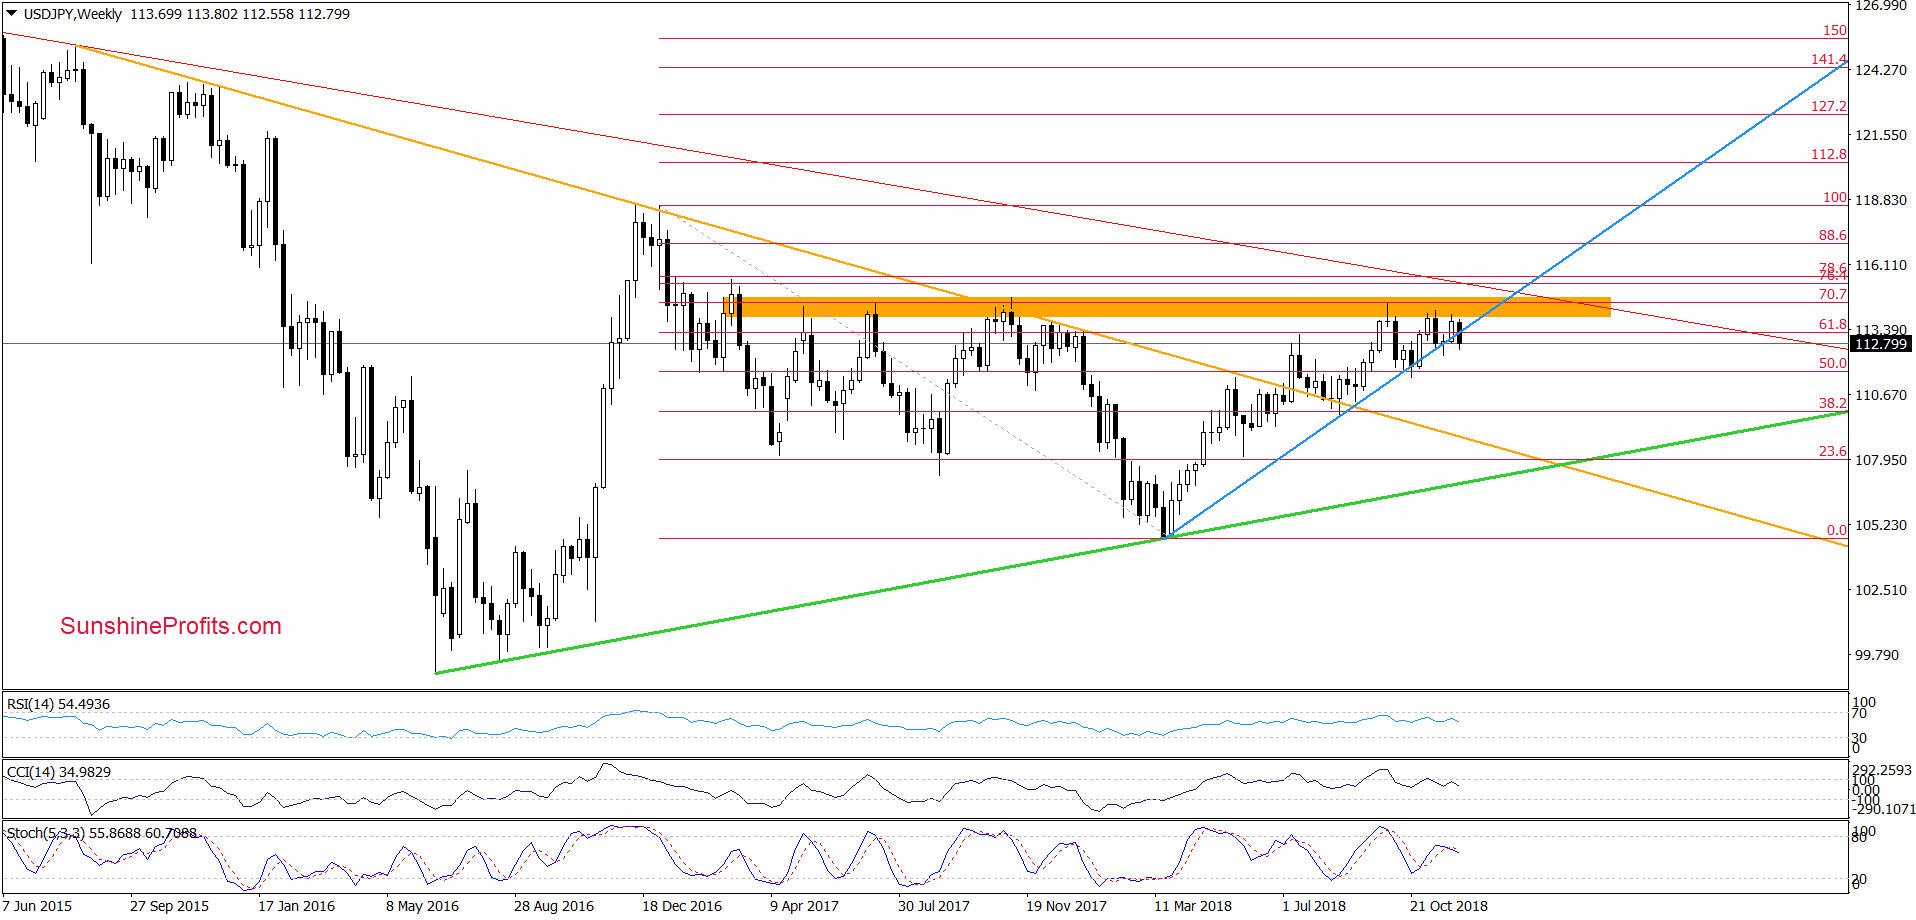
Why? Because USD/JPY is still trading not only below the major resistance zone (marked with orange, which continues to keep gains in check since March 2017), but also below the long-term blue line based on the March 2018 and August 2018 lows, which was broken earlier this week and serves as an additional resistance now. On top of that, the current position of the weekly indicators suggested that anther move to the downside was just a matter of time.
Trading position (short-term; our opinion): Short positions with a stop-loss order at 114.68 and the initial downside target at 112.34 (we increased it earlier this week) are justified from the risk/reward perspective.
USD/CHF
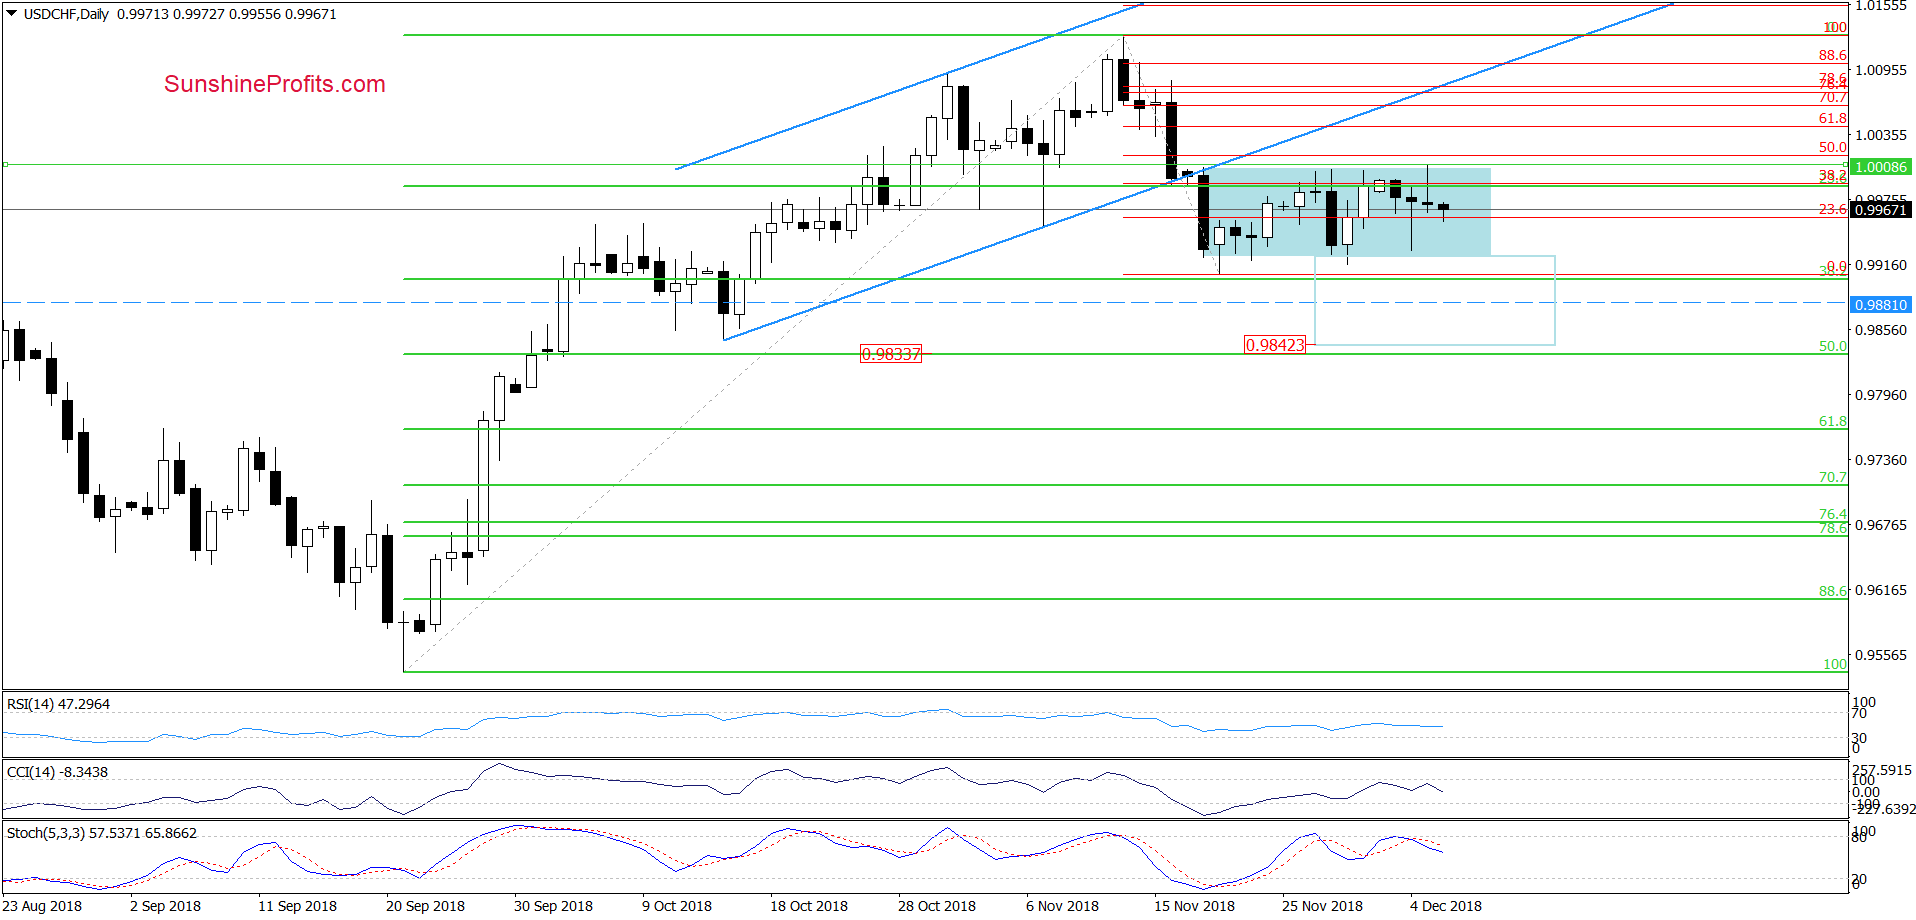
Looking at the daily chart, we see that the overall situation in the short term hasn’t changed much as USD/CHF is still trading inside the blue consolidation. Additionally, the sell signals generated by the indicators remain in the cards, suggesting that our last commentary on this currency pair is up-to-date also today:
(…) the proximity to the upper border of the blue consolidation (created by an intraday high of the big black candlestick formed on November 19) encouraged currency bears to act once again, which resulted in a quite sharp downswing that erased almost entire recent upward move.
Thanks to this drop, USD/CHF approached the lower border of the blue consolidation once again, which suggests that we’ll see at least a test of the 38.2% Fibonacci retracement in the very near future.
As you see on the daily chart, this support (or even a proximity to it) triggered rebounds during recent weeks but taking into account the sell signals re-generated by the daily indicators, it seems that this time currency bears they may be able to break through it.
If they manage to go below the retracement, we’ll likely see a drop to the mid-October lows and the 50% Fibonacci retracement in the following days (around 0.9833-0.9846). At this point it is also worth noting that in this area the size of the downward move will correspond to the height of the blue consolidation, which increases the probability that the sellers will want to make profits in this area.
Trading position (short-term; our opinion): short positions with a stop loss order at 1.0192 and the initial downside target at 0.9881 are justified from the risk/reward perspective.
Thank you.
Nadia Simmons
Forex & Oil Trading Strategist
Przemyslaw Radomski, CFA
Founder, Editor-in-chief, Gold & Silver Fund Manager
Gold & Silver Trading Alerts
Forex Trading Alerts
Oil Investment Updates
Oil Trading Alerts

