

After several days in a consolidation EUR/USD finally broke in our direction. What does it mean for the exchange rate in the coming days?
In our opinion the following forex trading positions are justified - summary:
- EUR/USD: short (a stop-loss order at 1.2250; the initial downside target at 1.1510)
- GBP/USD: short (a stop-loss order at 1.3773; the next downside target at 1.3000)
- USD/JPY: none
- USD/CAD: none
- USD/CHF: none
- AUD/USD: short (a stop-loss order at 0.8006; the initial downside target at 0.7730)
EUR/USD
On Friday, we wrote the following:
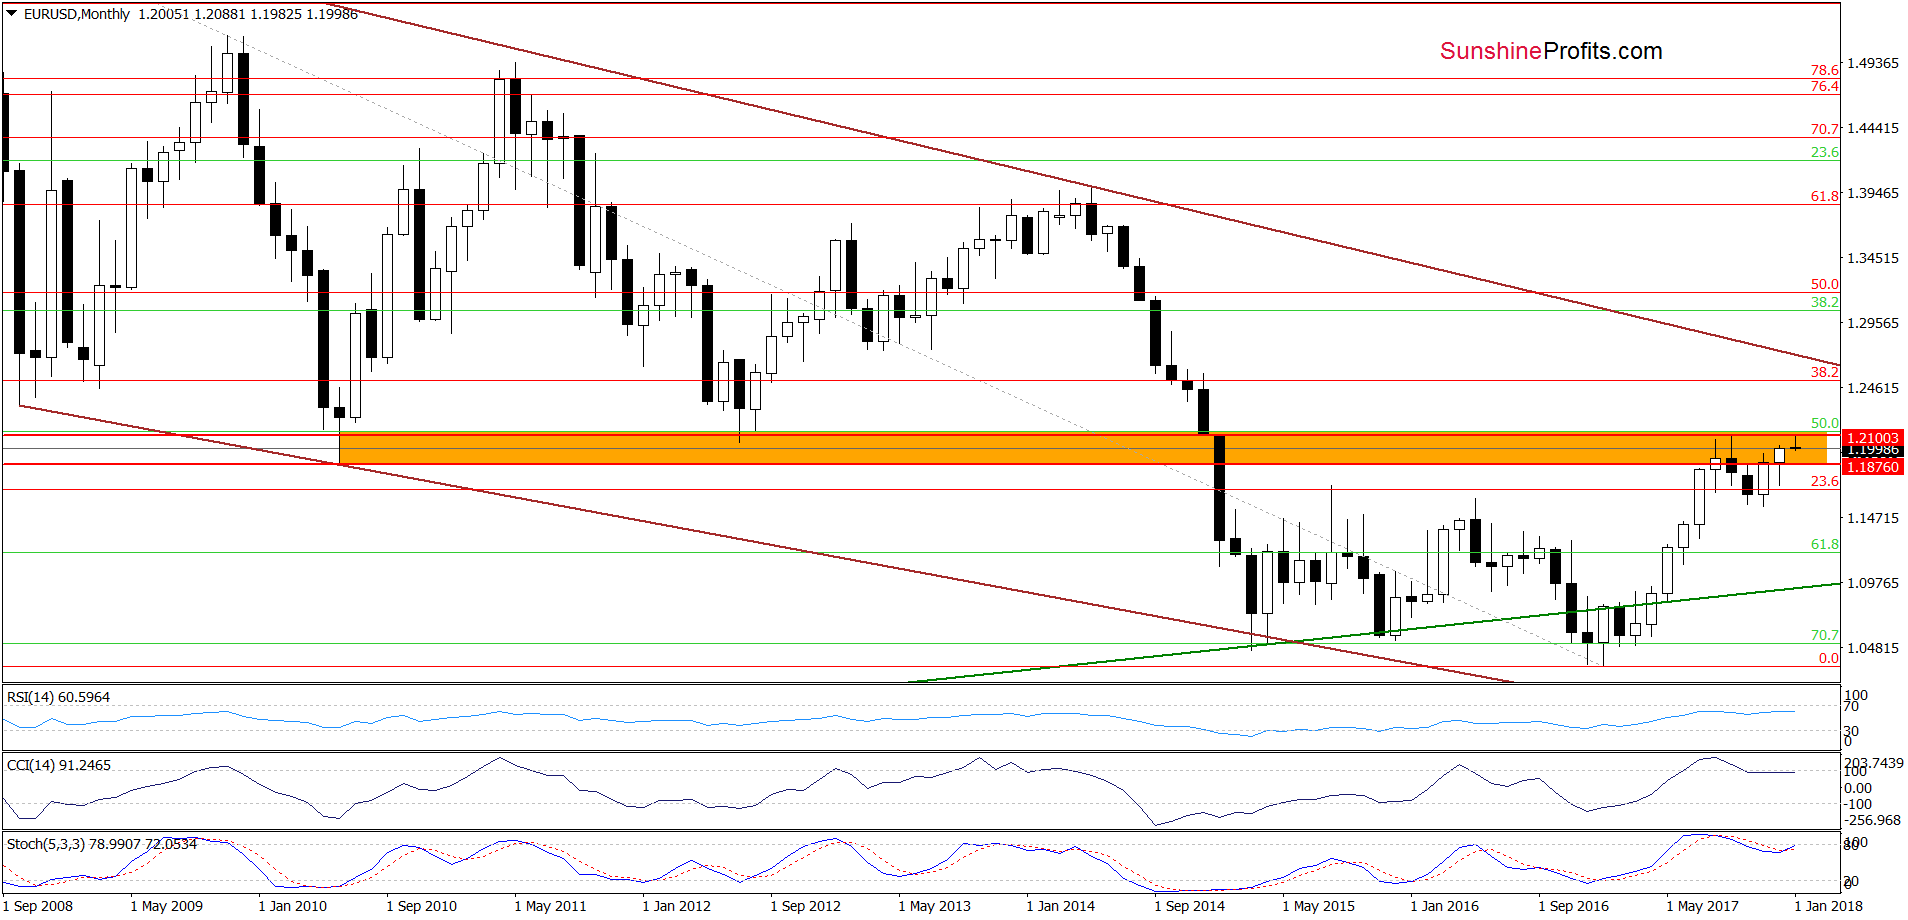
(…) although EUR/USD rebounded yesterday, (…) the exchange rate remains below September peak. Earlier today, the pair wavered between small gains and losses, but still below yesterday’s high, which suggests that another pullback is just around the corner – especially when we factor in the current position of the daily indicators (the Stochastic Oscillator generated the sell signal, while the RSI and CCI are very close to doing the same) and the orange resistance zone (marked on the long-term chart (…)).
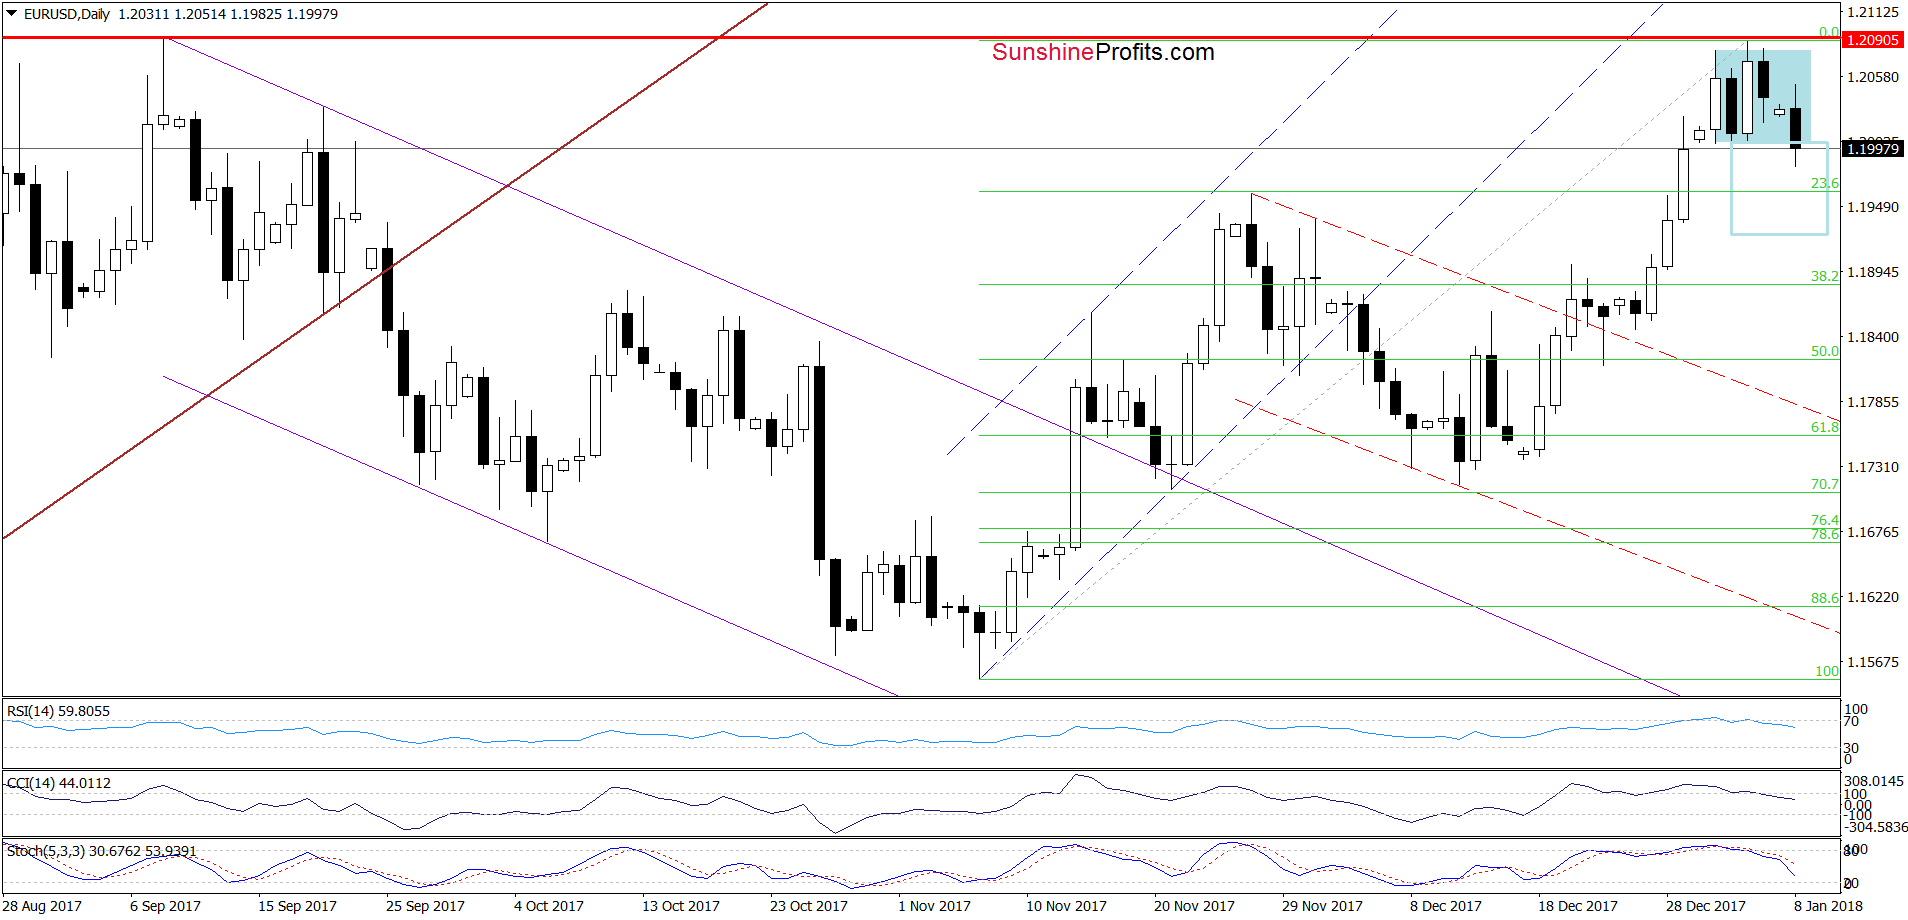
Looking at the daily chart, we see that the situation developed in line with the above scenario and EUR/USD extended loses earlier today. As a result, the pair broke below the lower border of the blue consolidation, which suggests that we’ll see a decline to at least 1.1925, where the size of the move will correspond to the height of the formation in the coming day(s). Nevertheless, if this area is broken, the next target for currency bears will be around 1.1884, where the 38.2% Fibonacci retracement (based on the entire November-January upward move) is.
Trading position (short-term; our opinion): short positions (with a stop-loss order at 1.2250 and the initial downside target at 1.1510) continue to be justified from the risk/reward perspective. We will keep you informed should anything change, or should we see a confirmation/invalidation of the above.
USD/JPY
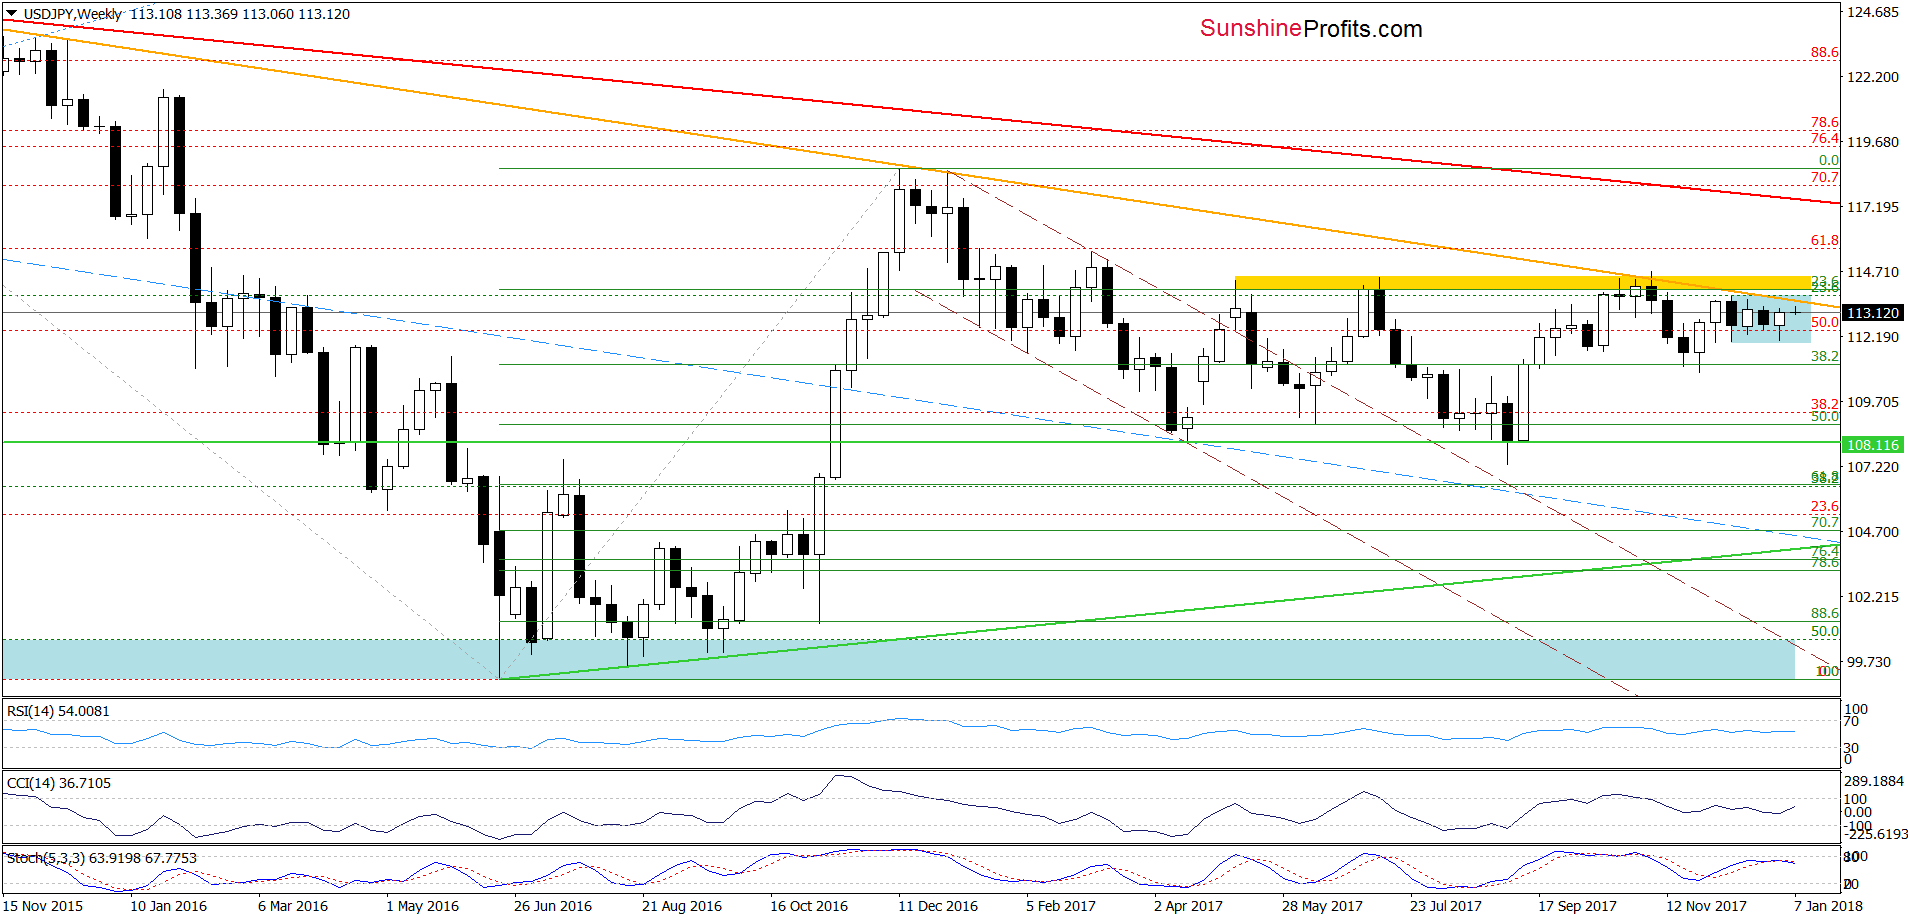
On the medium-term chart, we see that although USD/JPY rebounded in the previous week, the proximity to the upper border of the blue consolidation and the long-term orange declining line encouraged currency bears to act earlier today.
What impact did this drop have on the very short-term chart? Let’s check.
Quoting our Thursday’s Forex Trading Alert:
(…) What’s next for the exchange rate? Taking into account the proximity to the lower border of the blue consolidation (seen on the weekly chart) and the current position of the daily indicators (the CCI and the Stochastic Oscillator generated the buy signals), we think that the pair will extend gains and currency bulls will try to test December highs in the coming days. Nevertheless, such price action will be more likely if USD/JPY breaks above the red declining resistance line.
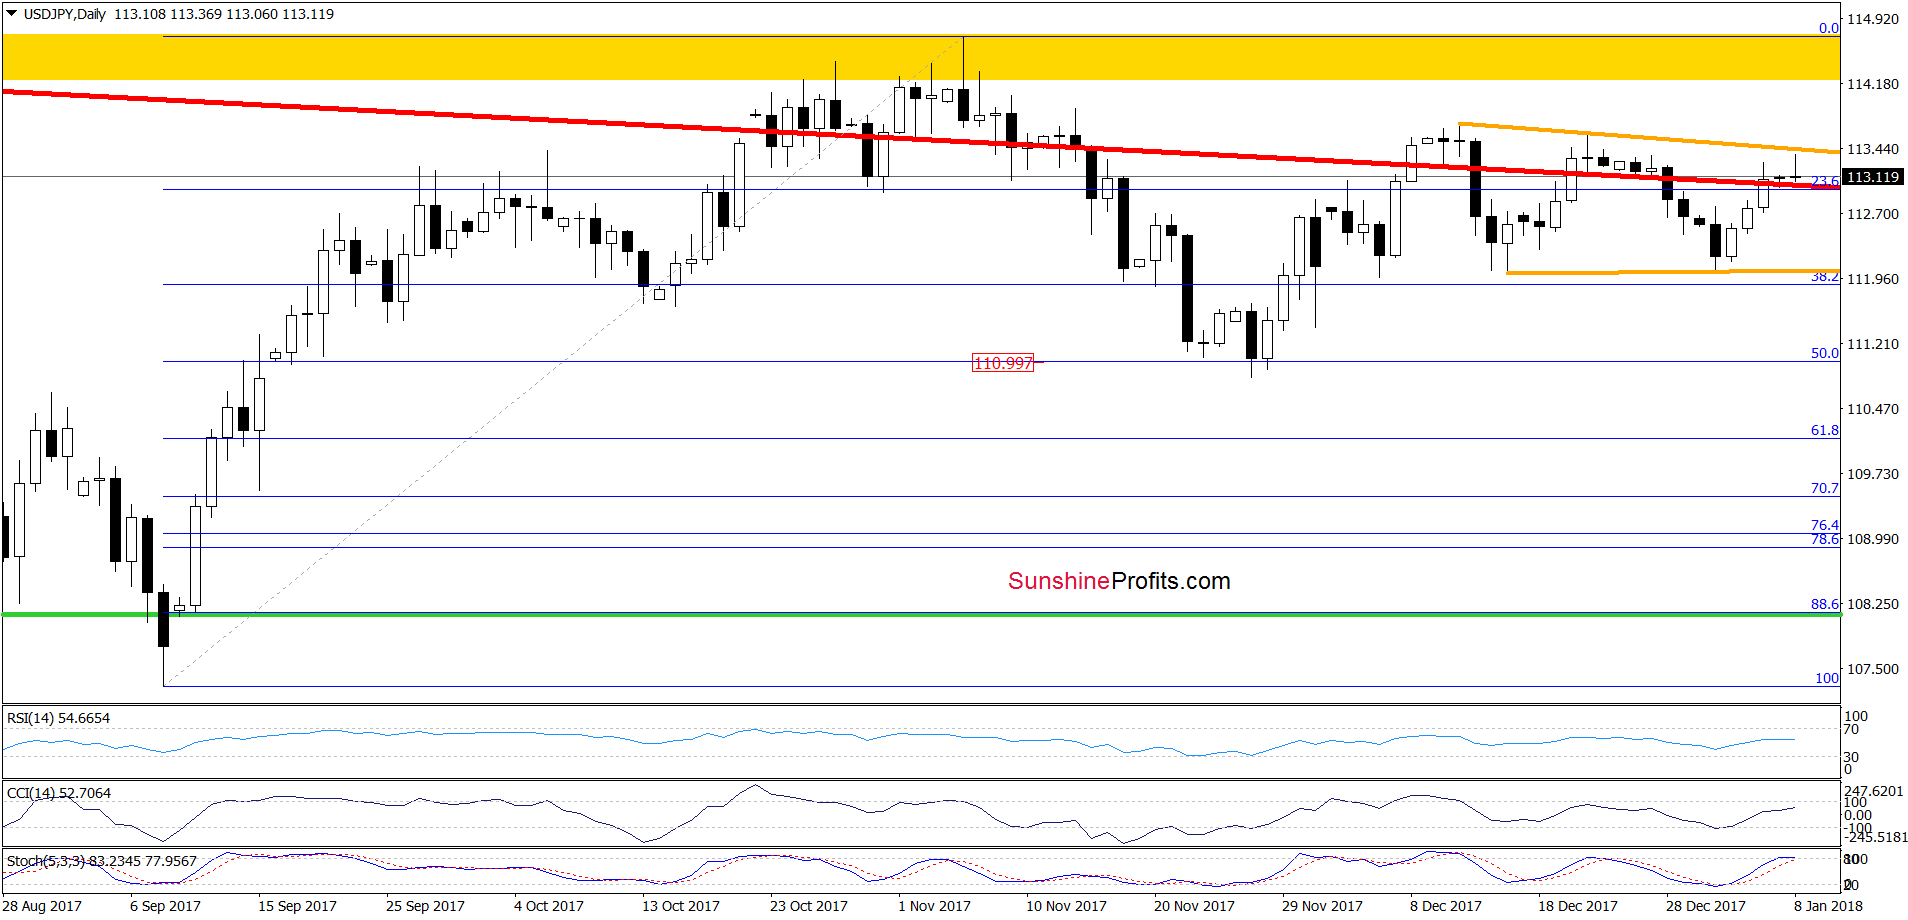
From today’s point of view, we see that although currency bulls pushed USD/JPY above this resistance, they didn’t manage to take the exchange rate higher. As a result, the pair approached the orange resistance line based on the previous highs, which suggests that as long as there is no breakout above it we don’t even see a test of the last months highs. Additionally, the Stochastic Oscillator is very close to generating the sell signal, which together with the above-mentioned currency bulls’ weakness suggests that another attempt to move lower is just around the corner.
What does it mean for USD/JPY? In our opinion, if the exchange rate declines from current levels and invalidates the earlier breakout above the red resistance line, we’ll see one more test of the orange support line (the lower border of the orange declining wedge) in the coming week.
Trading position (short-term; our opinion): No positions are justified from the risk/reward perspective now. We will keep you informed should anything change, or should we see a confirmation/invalidation of the above.
AUD/USD
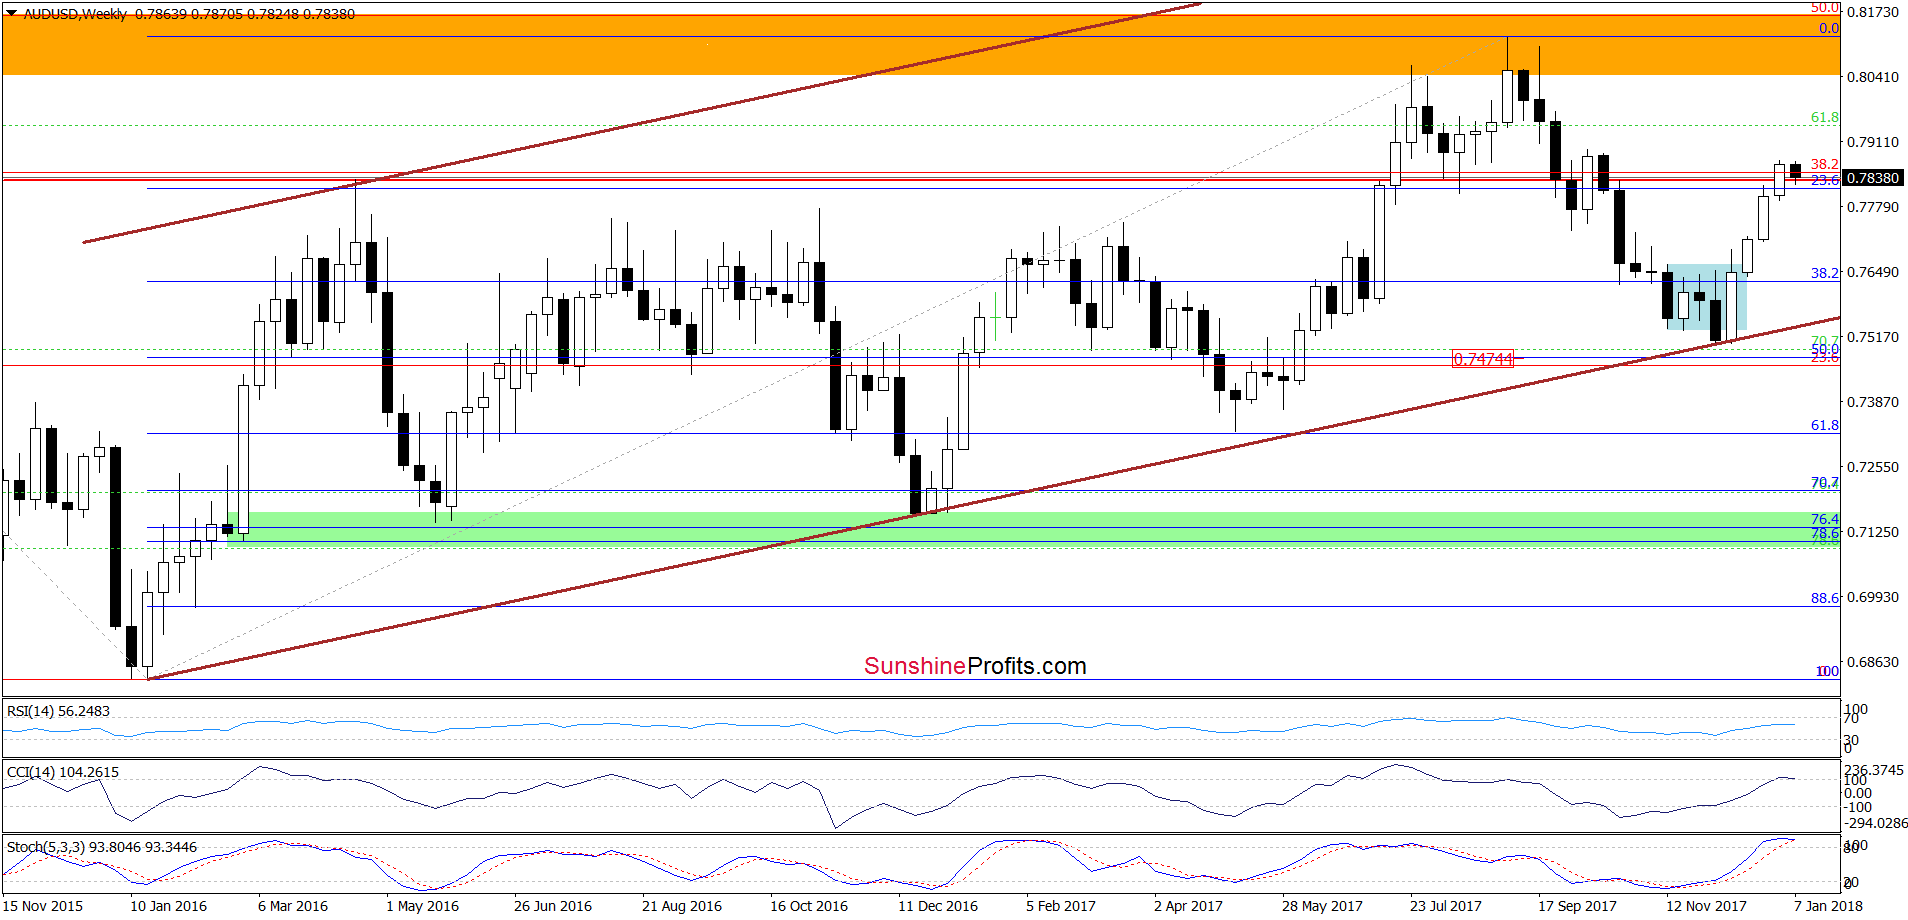
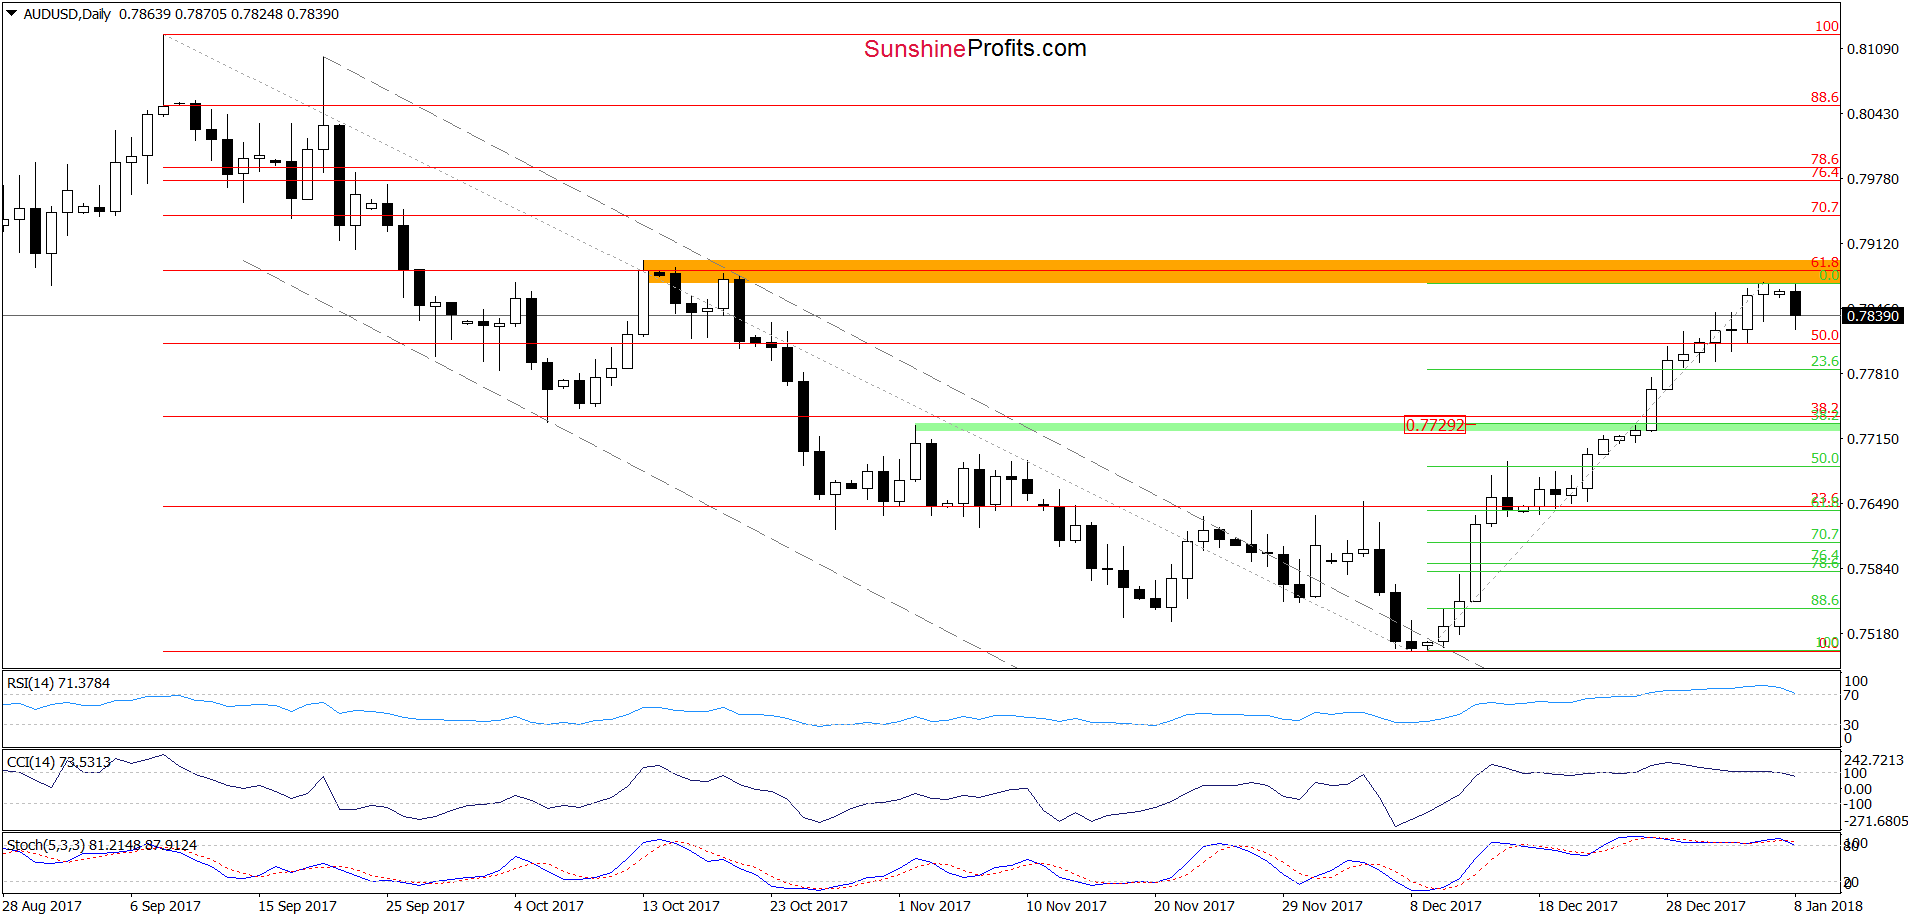
Looking at the charts, we see that AUD/USD extended gains and climbed to the orange resistance zone created by the 61.8% Fibonacci retracement and November highs, which could stop currency bulls and trigger a correction in the coming days. Additionally, the daily CCI generated the sell signal (while the RSI, Stochastic Oscillator and weekly indicators are very close to doing the same), increasing the likelihood of the bearish scenario.
How low could AUD/USD go in the coming days? In our opinion, the first downside target will be around 0.7730, where the 38.2% Fibonacci retracement (based on the entire December-January upward move) and the November high are. Taking all the above into account, we think that opening short positions is justified from the risk/reward perspective now.
Trading position (short-term; our opinion): Short positions (with a stop-loss order at 0.8006 and the initial downside target at 0.7730) are justified from the risk/reward perspective now. We will keep you informed should anything change, or should we see a confirmation/invalidation of the above.
Thank you.
Nadia Simmons
Forex & Oil Trading Strategist
Przemyslaw Radomski, CFA
Founder, Editor-in-chief, Gold & Silver Fund Manager
Gold & Silver Trading Alerts
Forex Trading Alerts
Oil Investment Updates
Oil Trading Alerts

