

Yesterday, the euro extended gains against the greenback, which resulted in a breakout above the short-term resistance line. Earlier today, the sellers cooled down the enthusiasm of currency bulls, erasing Thursday’s increase. What does it mean for EUR/USD?
- EUR/USD: none
- GBP/USD: none
- USD/JPY: short (a stop-loss order at 114.68; the initial downside target at 111.84)
- USD/CAD: short (a stop-loss order at 1.3401; the initial downside target at 1.2934)
- USD/CHF: short (a stop loss order at 1.0192; the initial downside target at 0.9881)
- AUD/USD: long (a stop-loss order at 0.7190; the initial upside target at 0.7440)
EUR/USD
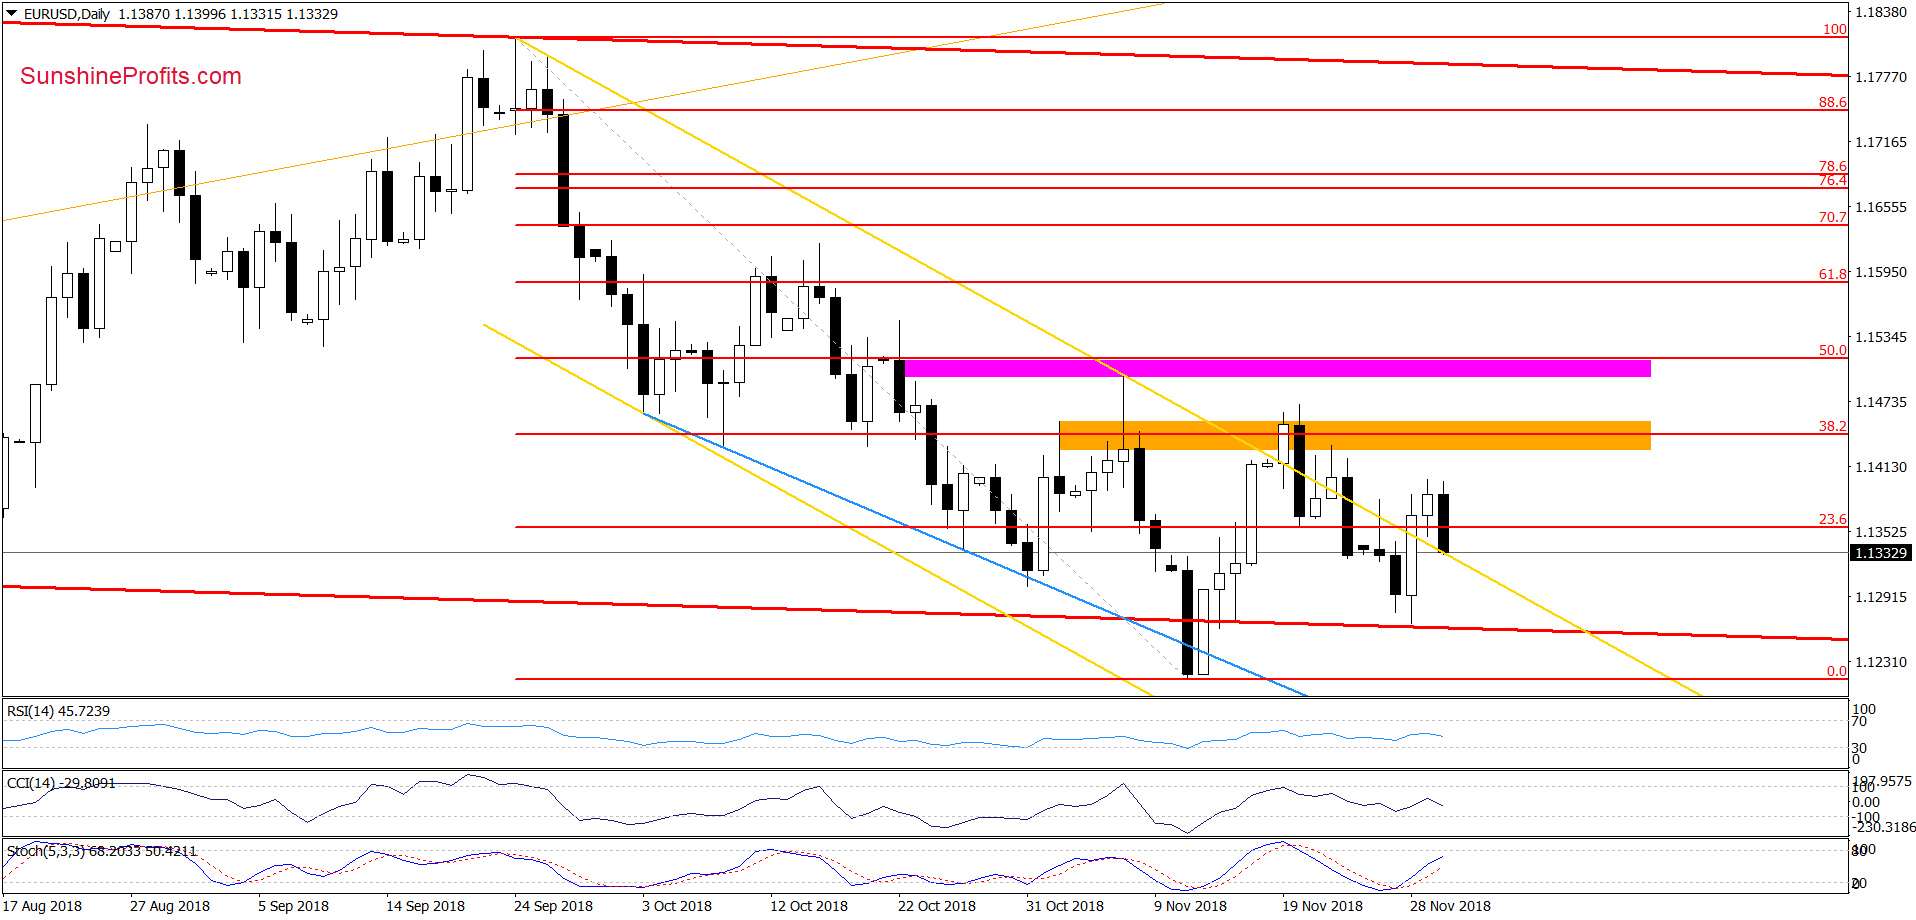
From today’s point of view, we see that although EUR/USD broke above the yellow resistance line and closed the day above it, currency bears decided to check the strength of this support once again earlier today.
Thanks to their attack, the exchange rate pulled back quite sharply, but there was no drop under the yellow line, which looks like a verification of Thursday’s breakout. If this is the case and the buyers manage to trigger a rebound from here, EUR/USD will likely test of the orange resistance zone and the recent peaks in the very near future.
Trading position (short-term; our opinion): No positions are justified from the risk/reward perspective.
GBP/USD
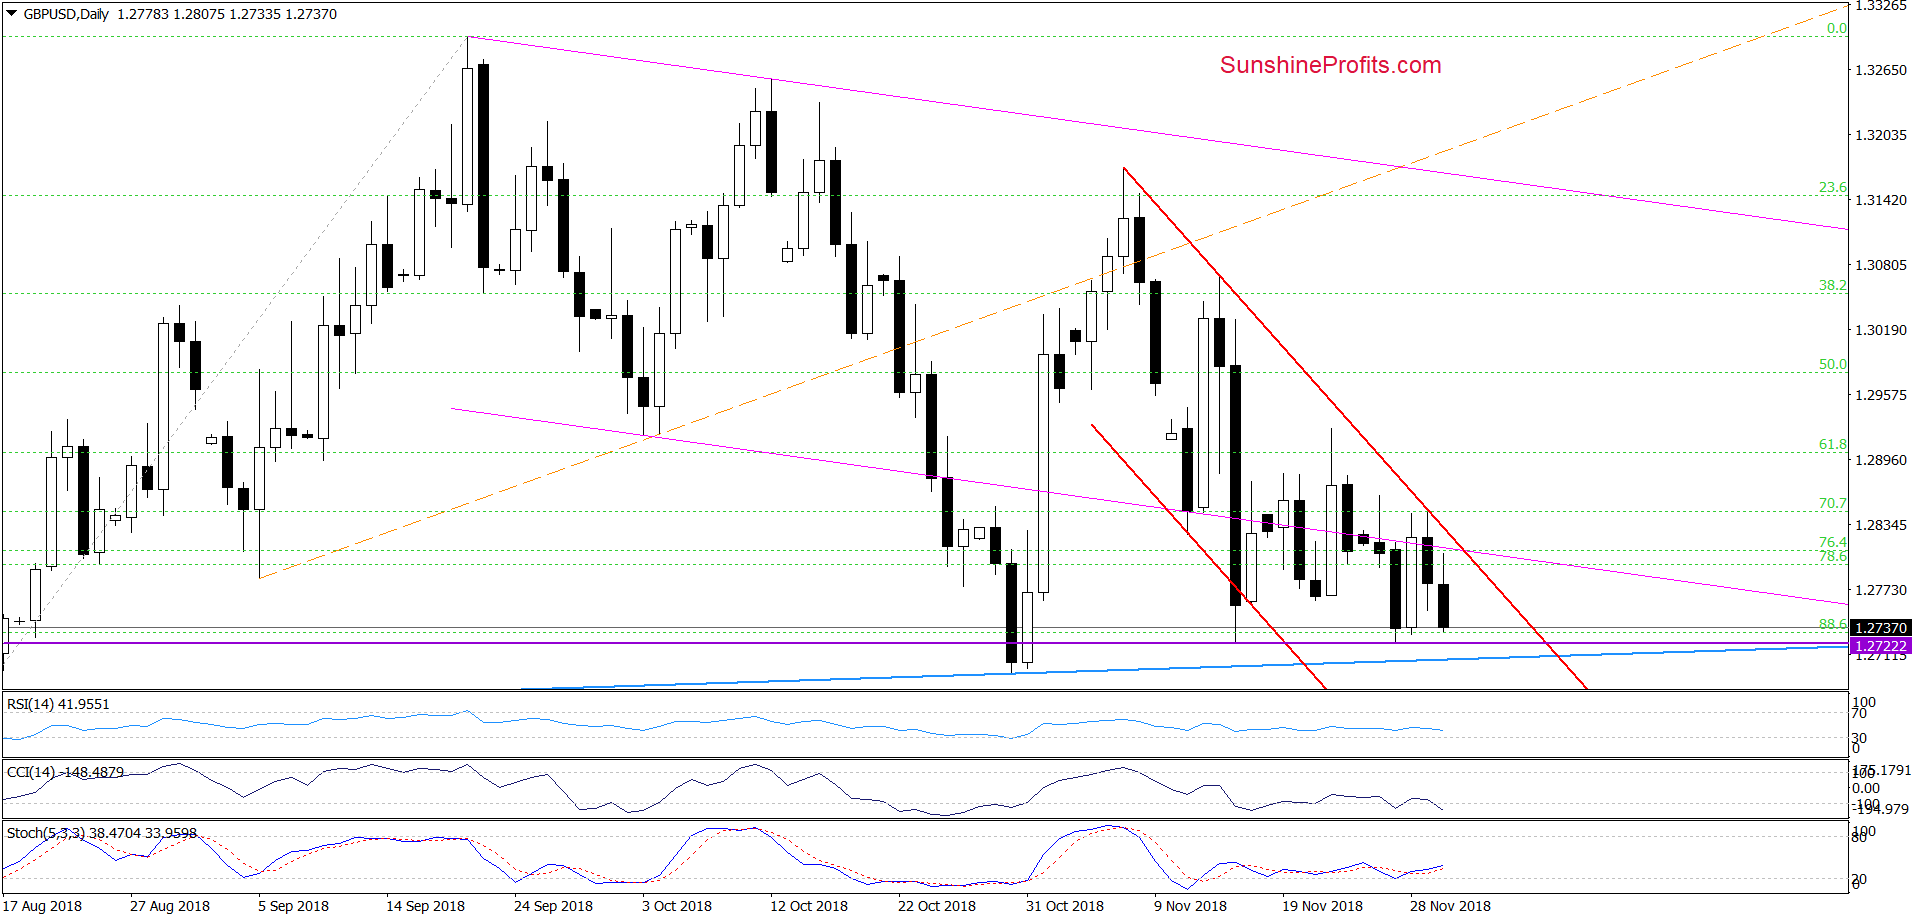
Although GBP/USD bounced off the purple horizontal line based on the mid-November low during Wednesday’s session, the upper border of the red declining trend channel stopped the buyers, triggering a move to the downside.
As a result, the exchange rate approached this week’s lows and the blue support line (based on the id-August and late-October lows), which could translate into another upswing in the coming week – especially when we factor in the proximity to and the green support zone marked on the weekly chart below.
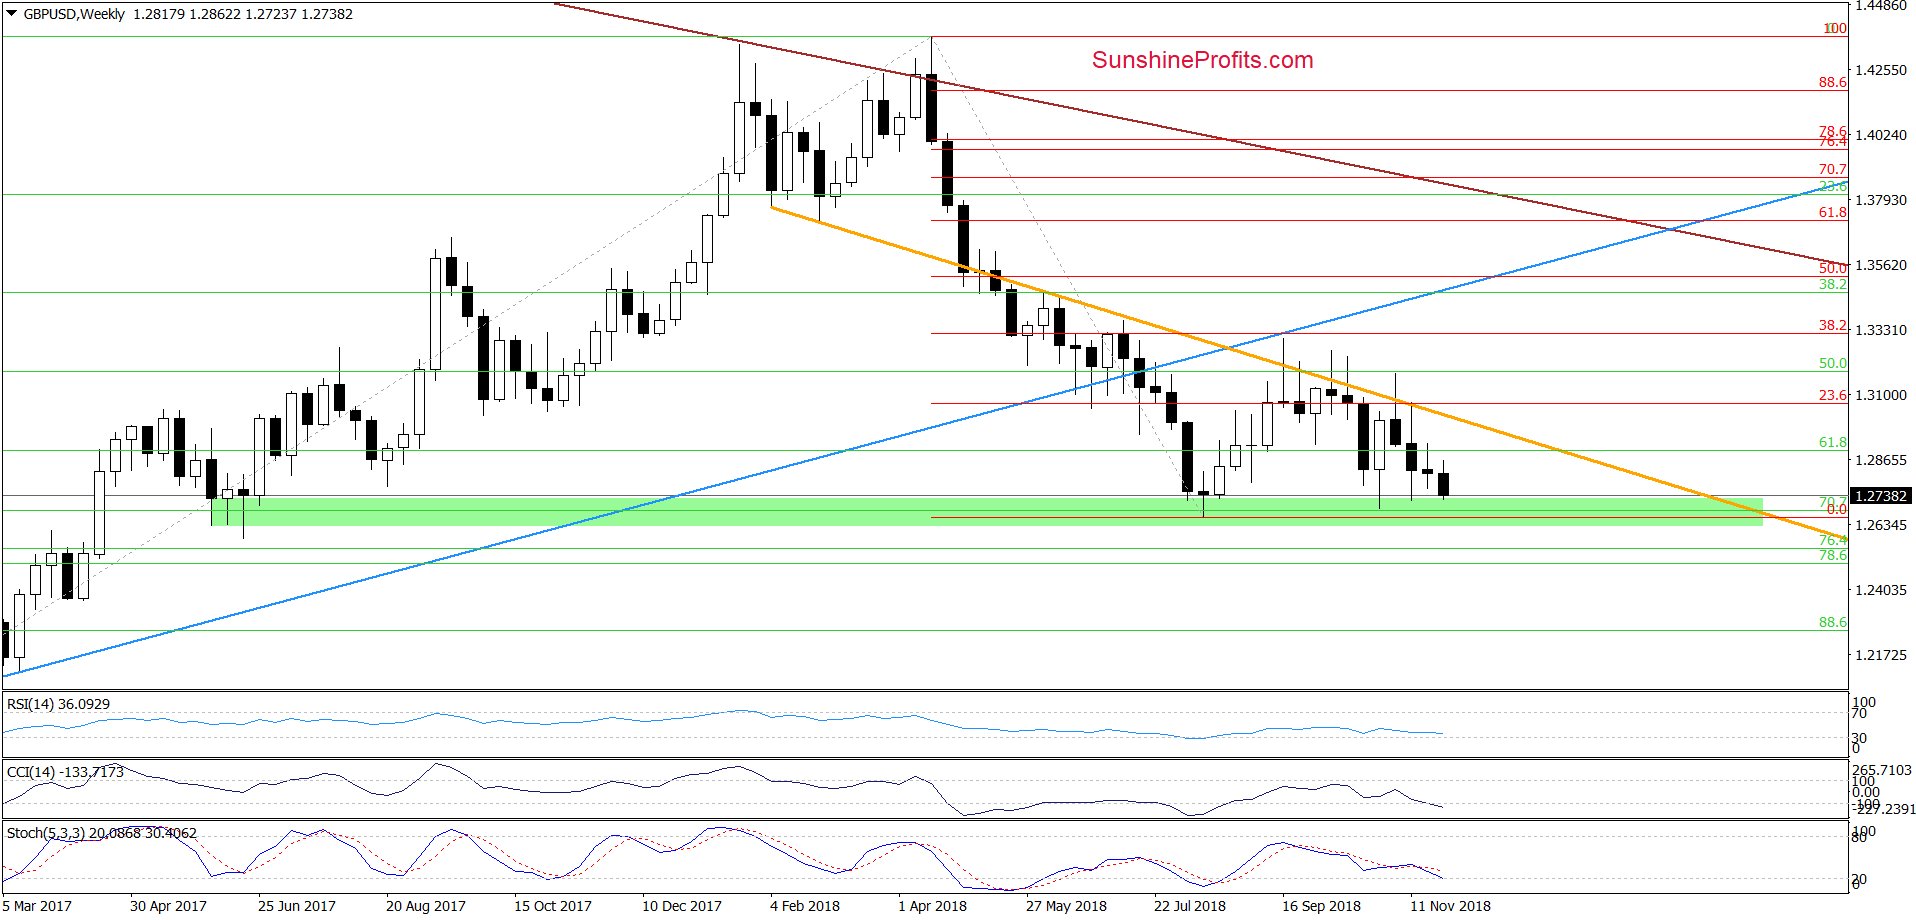
At this point, it is worth noting that this major support area was strong enough to stop the sellers three times in the past, which suggests that as long as there is no successful breakdown below it a bigger move to the downside is not likely to be seen and one more rebound from here should not surprise us.
Nevertheless, in our opinion, a bigger move to the upside will be more likely and reliable if currency bulls manage to take the pair above the upper border of the red declining trend channel marked on the daily chart. If we see such price action, we’ll consider opening long positions.
Trading position (short-term; our opinion): No positions are justified from the risk/reward perspective.
USD/CHF
In our last commentary on this currency pair, we wrote:
(…) the pair is still trading inside the big black candlestick created on November 19.
Such price action suggests that currency bulls are quite weak compared to their opponents, because despite eight sessions they were not able to return above 1.0005 (the November 19 intraday high).
Additionally, when we take a closer look at the Fibonacci retracements based on the November declines, we see that the exchange rate invalidated yesterday’s tiny breakout above the 38.2% retracement. Earlier today, the history repeated itself once again, increasing the probability of reversal in the very near future.
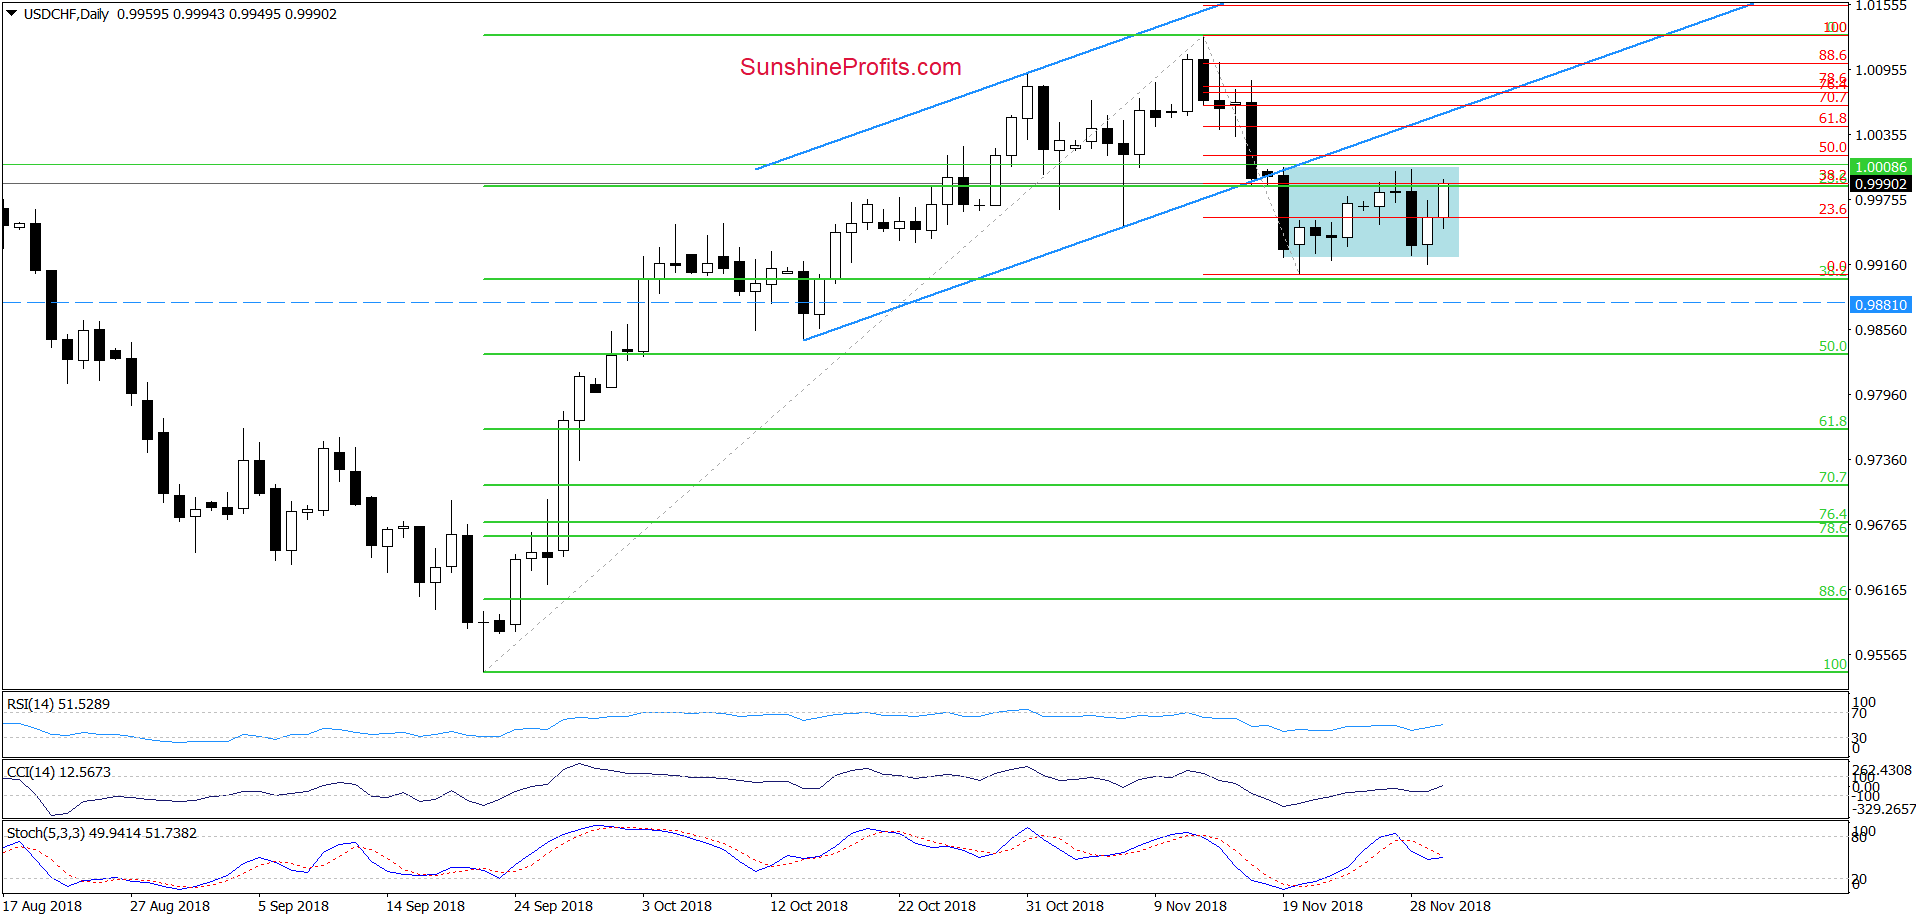
On the daily chart, we see that the situation developed in line with the above assumptions as the upper border of the blue consolidation (created by an intraday high of the big black candlestick formed on November 19 triggered a quite sharp downswing, which erased almost entire recent upward move.
Despite this deterioration, the proximity to the 38.2% Fibonacci retracement encouraged currency bulls to fight for higher values of the exchange rate. As a result, USD/CHF re-approached the upper border of the blue consolidation, but in our opinion, as long as there is no successful breakout above it, another move to the downside should not surprise us at the beginning of the coming week.
Trading position (short-term; our opinion): short positions with a stop loss order at 1.0192 and the initial downside target at 0.9881 are justified from the risk/reward perspective.
Thank you.
Nadia Simmons
Forex & Oil Trading Strategist
Przemyslaw Radomski, CFA
Founder, Editor-in-chief, Gold & Silver Fund Manager
Gold & Silver Trading Alerts
Forex Trading Alerts
Oil Investment Updates
Oil Trading Alerts

