

On Friday, the euro moved lower against the greenback, which took EUR/USD under the previously-broken resistance line. Earlier today, the buyers decided to fight for higher values of the exchange rate, but will they manage to withstand the selling pressure in the coming days?
- EUR/USD: long (a stop-loss order at 1.1260 the initial upside target at 1.1544)
- GBP/USD: none
- USD/JPY: long (a stop-loss order at 111.11; the initial upside target at 113.40)
- USD/CAD: none
- USD/CHF:short (a stop loss order at 1.0128; the initial downside target at 0.9881)
- AUD/USD: none
EUR/USD
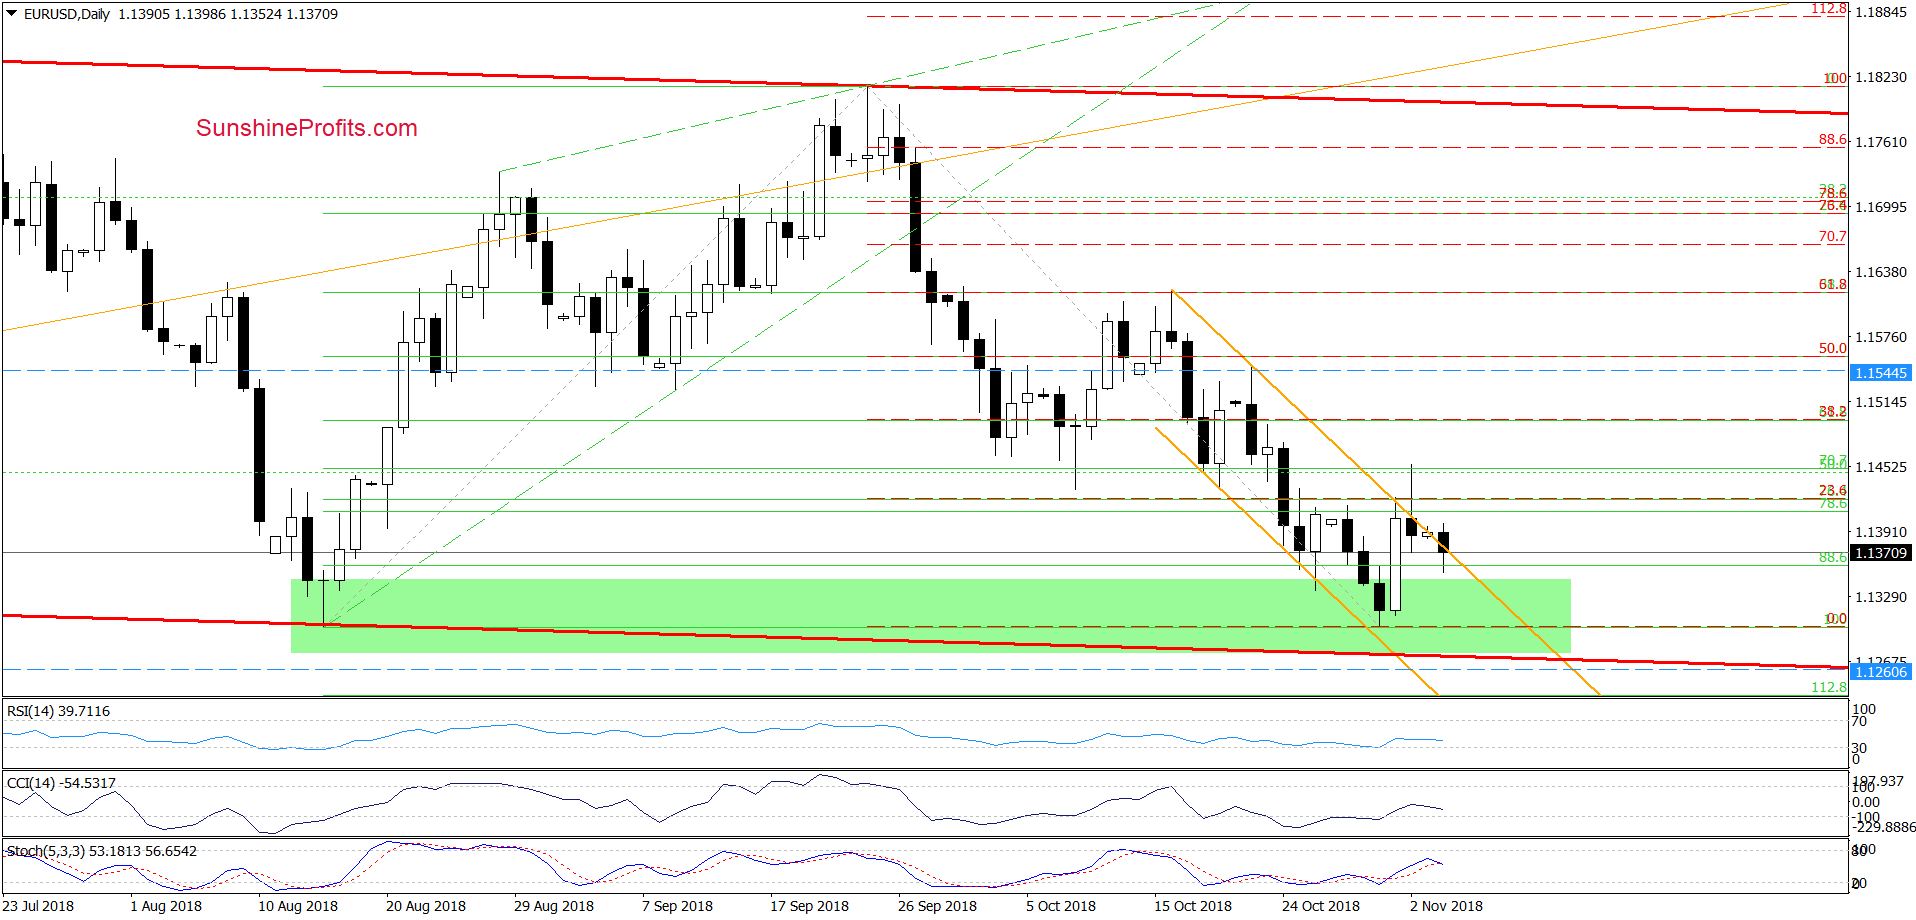
From today’s point of view, we see that the exchange rate closed Friday’s session under the previously-broken upper line of the orange declining trend channel, invalidating the earlier breakout.
Although this is a bearish development, currency bulls triggered a rebound during today’s session, which resulted in a comeback to the orange line. On one hand, such price action could be a verification of Friday’s breakdown. However, on the other hand, we believe that as long as the green support area holds another sizable move to the downside is not likely to be seen.
Connecting the dots, we’ll wait for the closure of today's session before we make further decisions regarding the size of the position. We will keep you informed should anything change, or should we see a confirmation/invalidation of the above.
Trading position (short-term; our opinion): Long positions with the stop-loss order at 1.1260 and the initial upside target at 1.1544 are justified from the risk/reward perspective.
GBP/USD
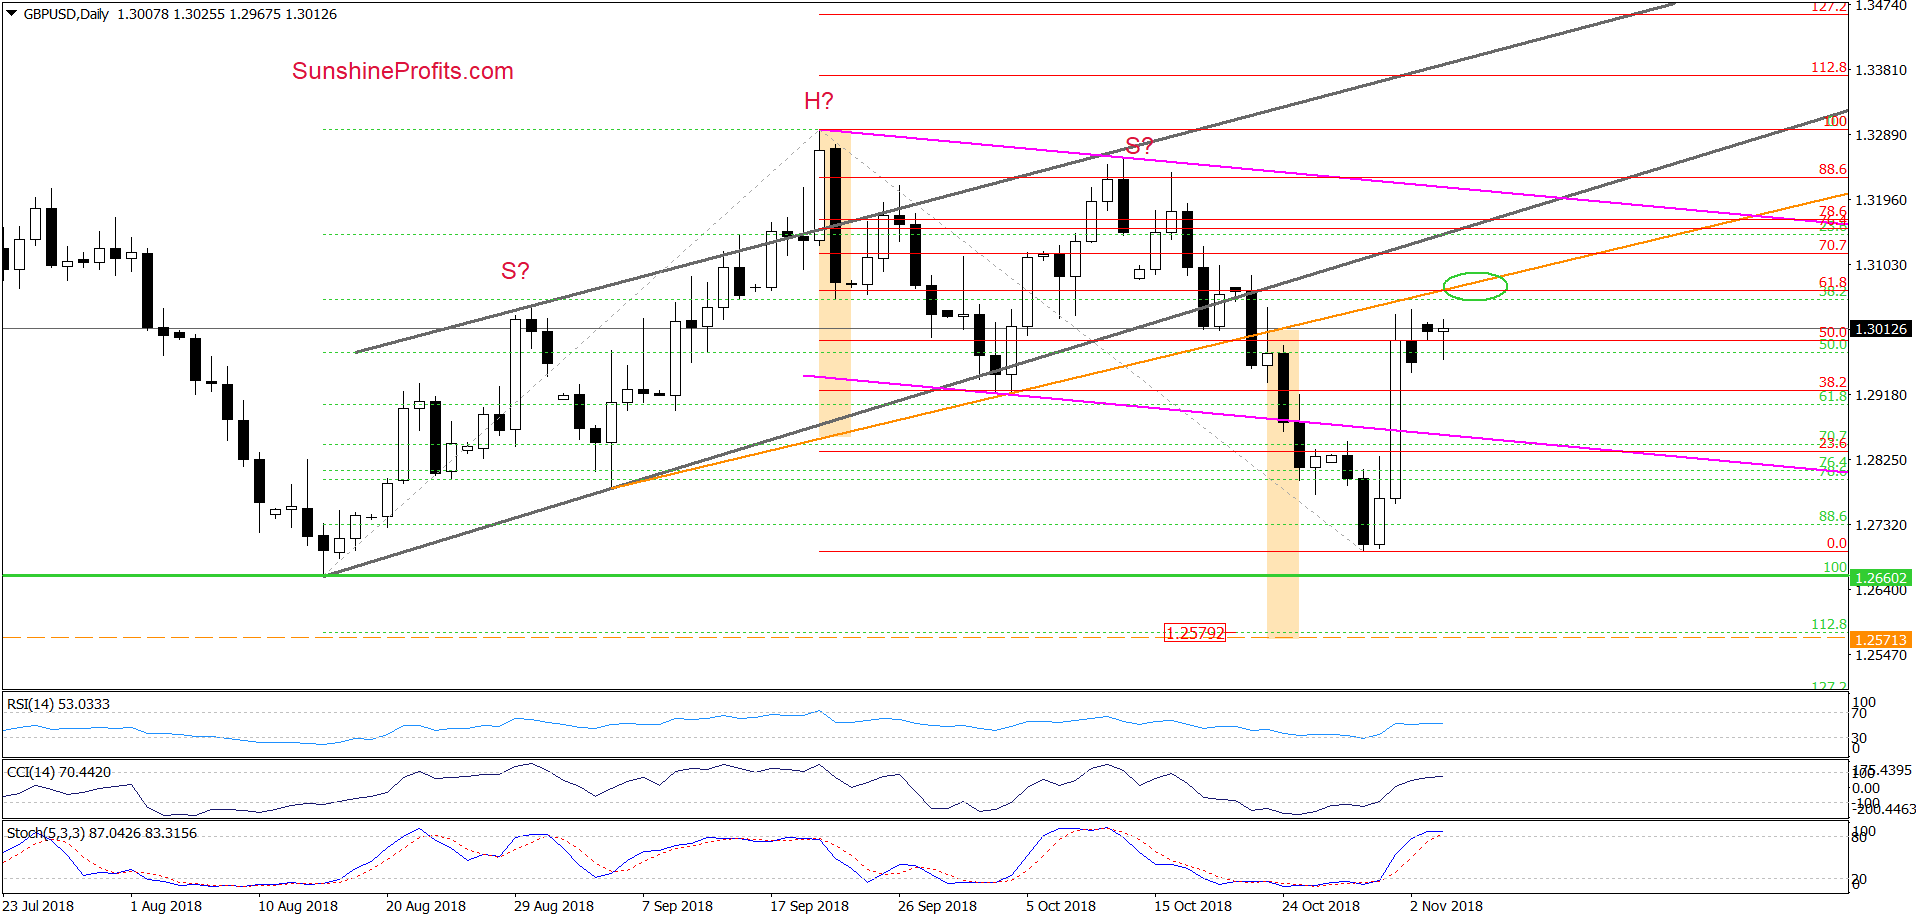
The first thing that catches the eye on the daily chart is an invalidation of the earlier breakdown under the lower border of the pink declining trend channel. As you this, this bullish development triggered a sharp move to the upside during Thursday’s session and approached the pair to the previously-broken orange resistance line and the 61.8% Fibonacci retracement based on the entire recent downward move.
What’s next? Taking into account, the current consolidation around the last week’s peak and the position of the daily indicators (the CCI and the Stochastic Oscillator climbed to their overbought areas), we think that GBP/USD will increase once again and test the above-mentioned nearest resistances before it turns south.
If the situation develops in line with the above assumptions, we’ll consider opening short positions in the following day(s).
Trading position (short-term; our opinion): None positions are justified from the risk/reward perspective.
USD/CAD
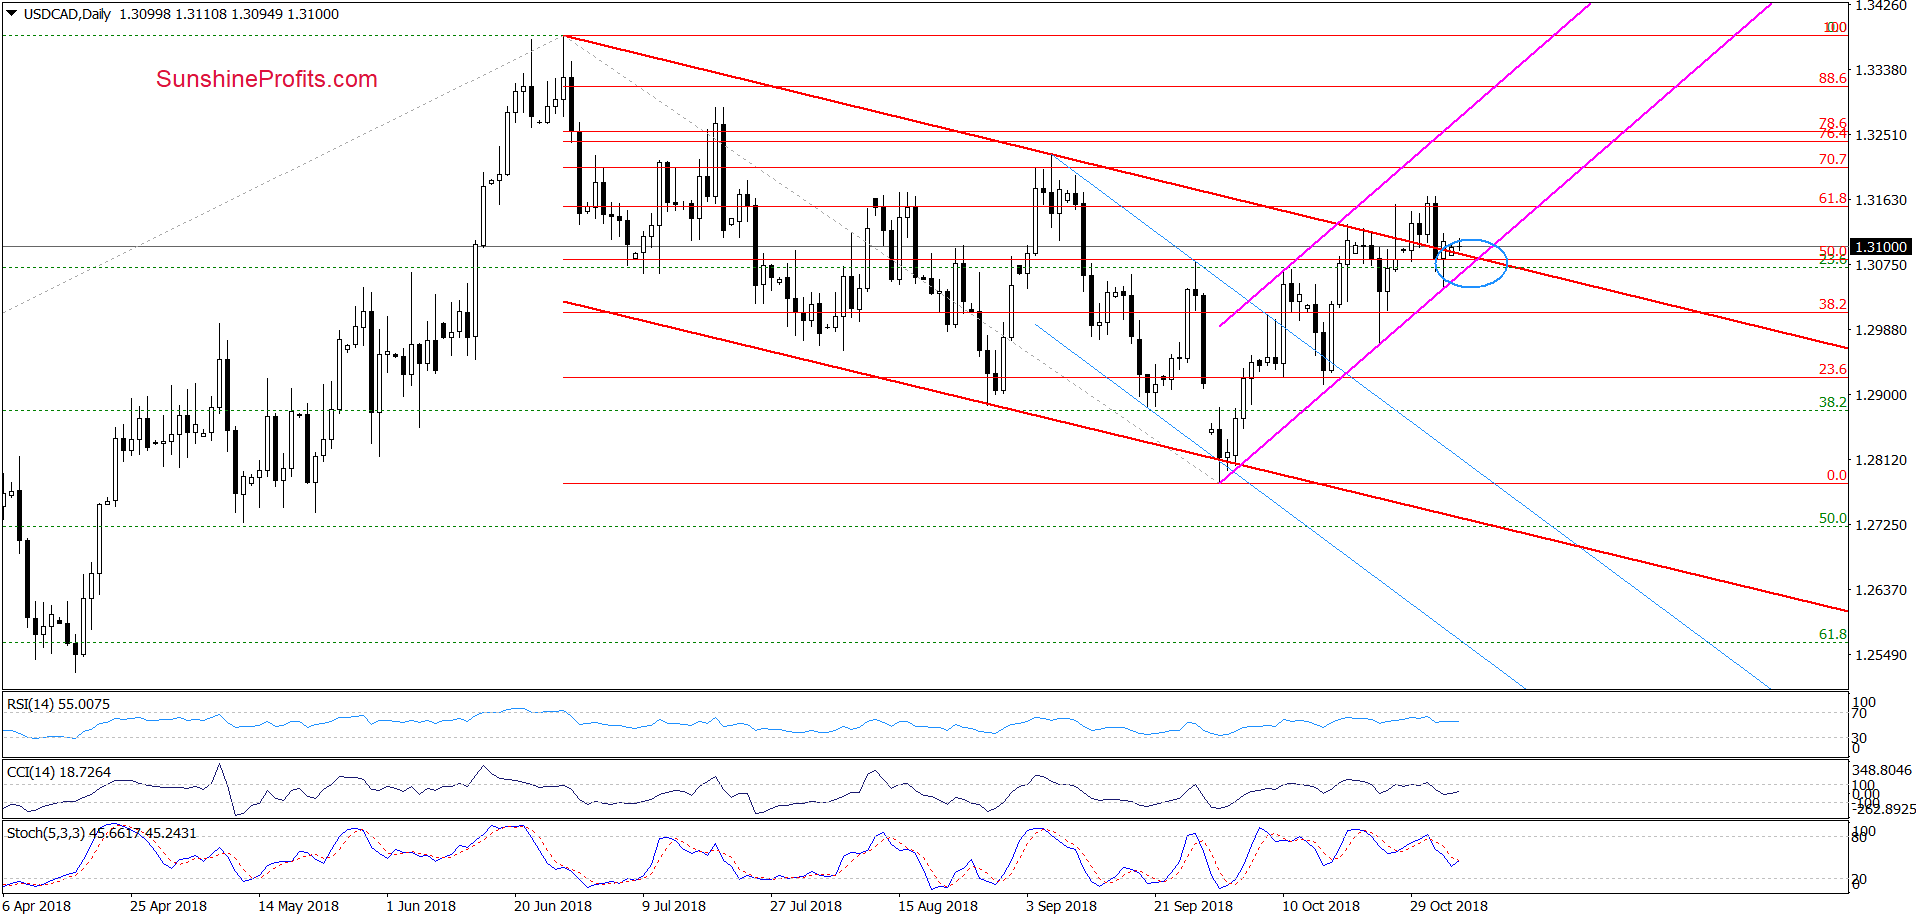
Looking at the daily chart, we see that the overall situation in the short term hasn’t changed much as USD/CAD is still trading in a narrow range: between the lower order of the pink rising trend channel and the upper border of the red declining channel.
What does it mean for the exchange rate? In our opinion, if currency bears manage to break under both above-mentioned supports, the way to lower levels will be open and we’ll consider opening short positions (very probably later this week). As always, we’ll keep you - our subscribers - informed should anything change.
Trading position (short-term; our opinion): None positions are justified from the risk/reward perspective, but if we see more signs of currency bears’ strength, we’ll consider opening short positions.
Thank you.
Nadia Simmons
Forex & Oil Trading Strategist
Przemyslaw Radomski, CFA
Founder, Editor-in-chief, Gold & Silver Fund Manager
Gold & Silver Trading Alerts
Forex Trading Alerts
Oil Investment Updates
Oil Trading Alerts

