

Yesterday’s decline took EUR/USD to the levels that we saw almost two weeks ago. Doesn’t the rebound that followed this drop remind you anything?
- EUR/USD: short (a stop-loss order at 1.1746; the initial downside target at 1.1343)
- GBP/USD: none
- USD/JPY: none
- USD/CAD: long (a stop-loss order at 1.3018; the initial upside target at 1.3333)
- USD/CHF: none
- AUD/USD: none
EUR/USD
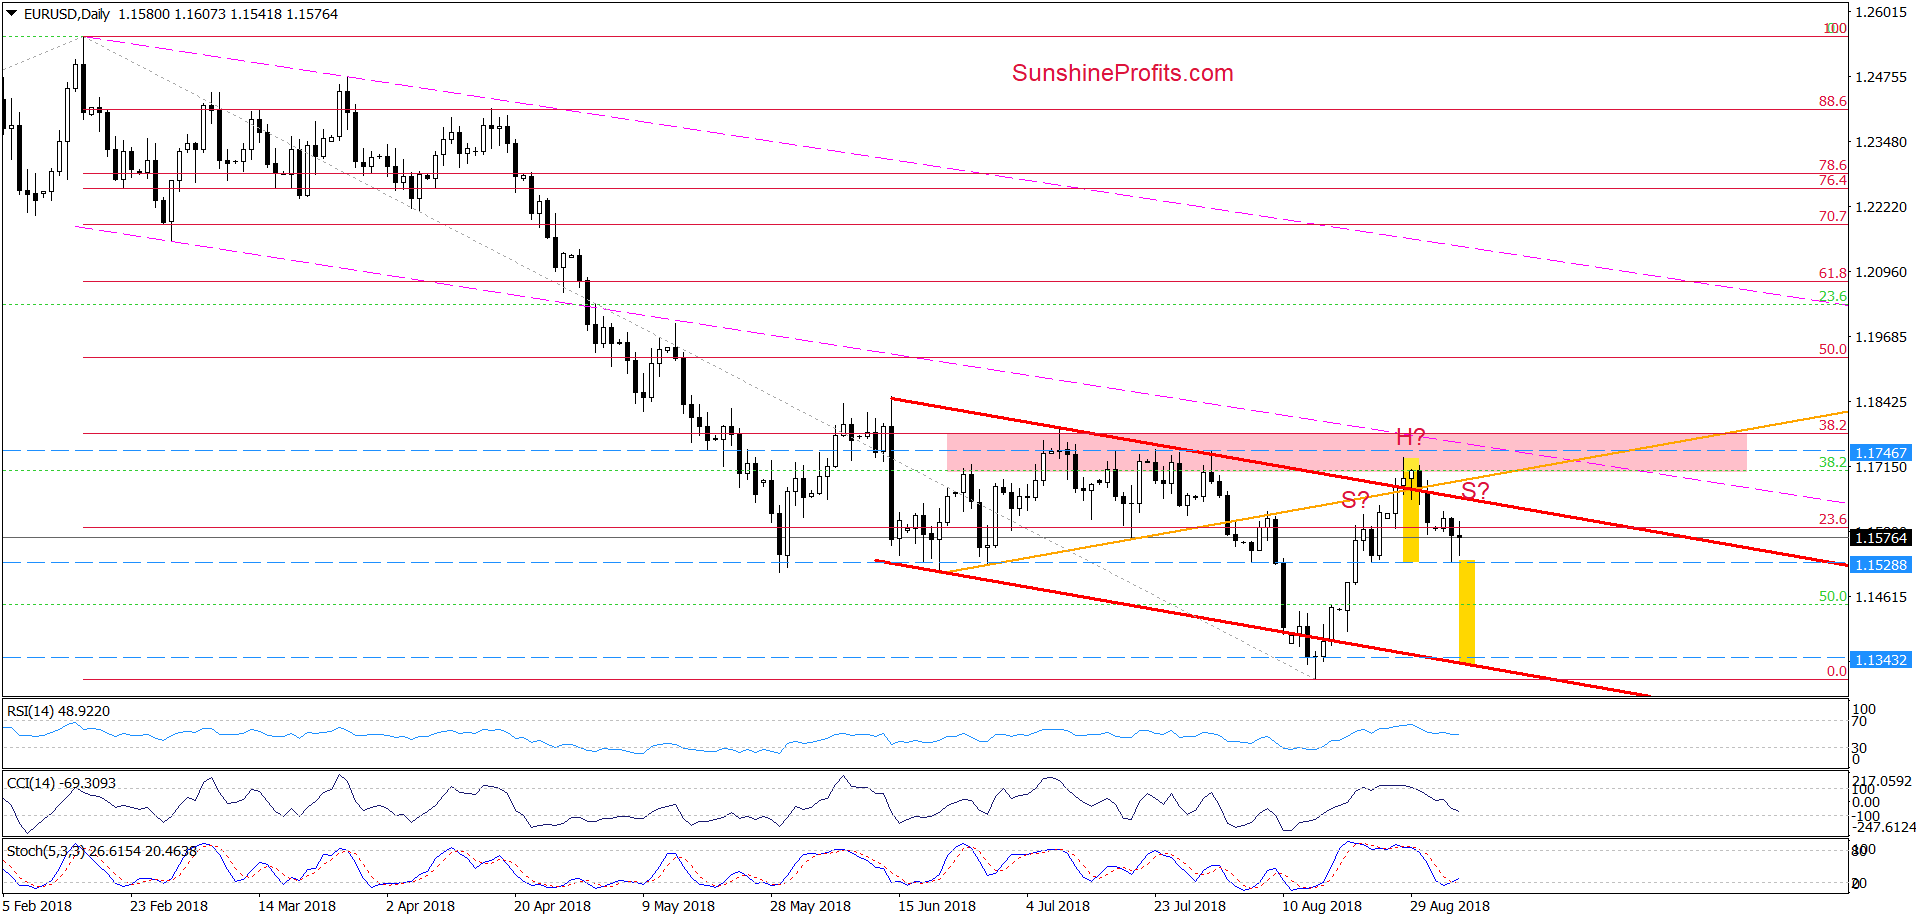
Yesterday, EUR/USD bounced off the bottom of a correction that we saw on August 23, which resulted in a small rebound. Despite this move, the pair is still trading under the previously-broken upper border of the red declining trend channel and the orange line, which means that the invalidation the earlier breakouts and its negative impact on the exchange rate remain in effect, supporting lower values of EUR/USD.
Additionally, when we take a closer look at the above chart, we can notice a potential head and shoulders top formation (like the one that we saw in July - especially if we consider the levels at which it appears).
This means that if currency bears manage to take the pair under the blue dashed horizontal line (the neck line of the pattern), we’ll see a drop not only to our initial downside target, but also a test of the recent lows (in terms of daily closures) and the lower line of the red declining trend channel in the following days.
The pro-declining scenario is also reinforced by the broader perspective and the current situation in the USD Index.
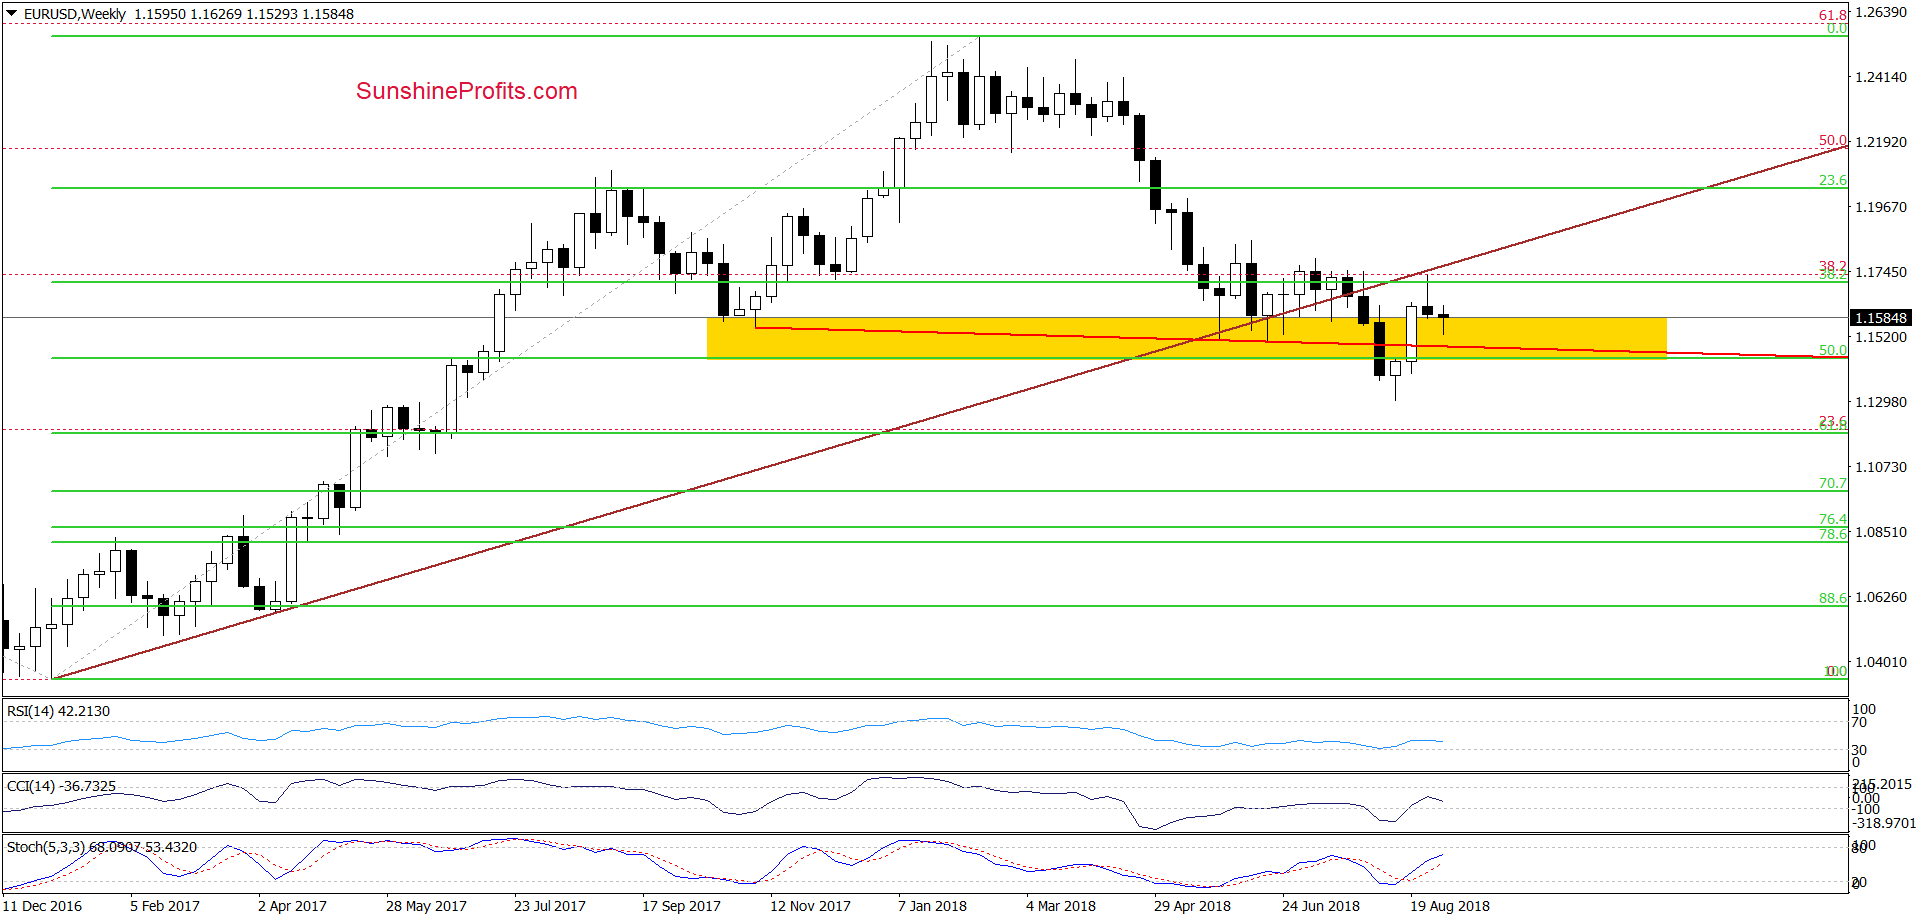
From the medium-term perspective, we see that EUR/USD verified the earlier breakdown under the long-term brown rising line (which serves as the nearest resistance), which increases the likelihood that the exchange rate will not only test the recent lows, but also hit a fresh 2018 low in the coming week(s) – especially when we factor in the situation in the USD Index.
Focus on the Greenback
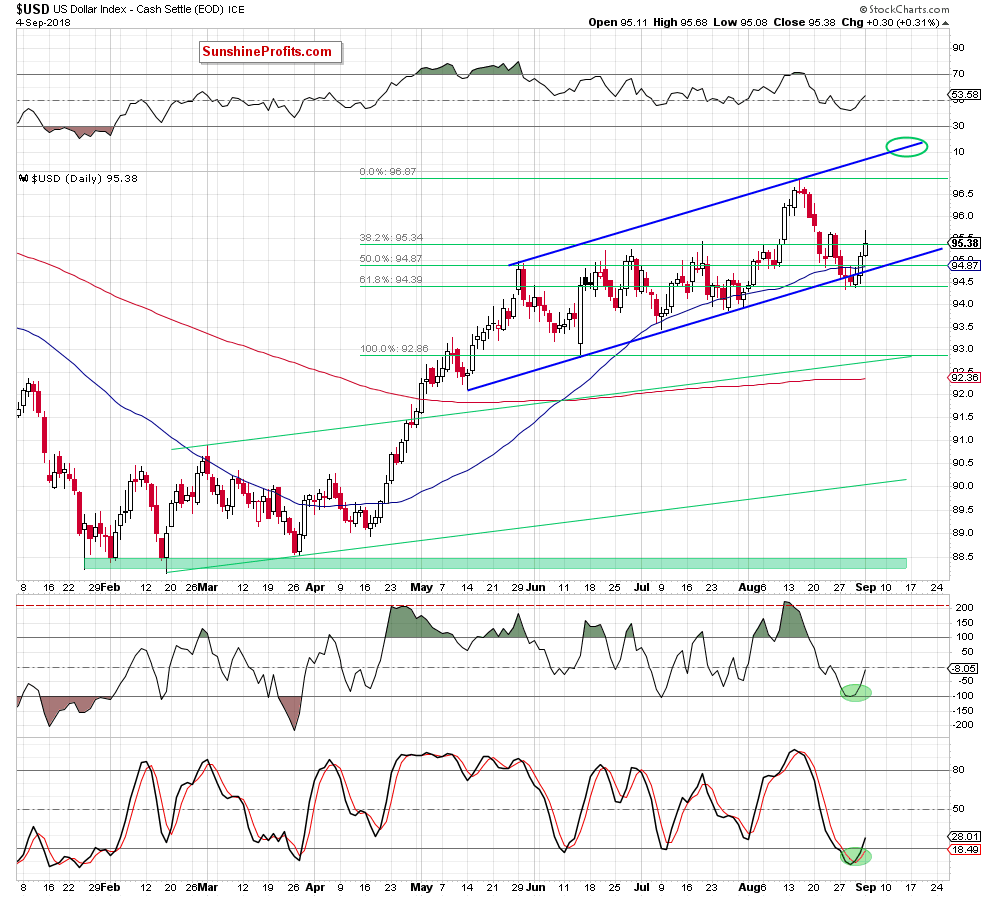
Looking at the daily chart, we see that although USD Index pulled back a bit after a tiny breakout above the August 23 peak of 95.63, the greenback closed the day above the previously-broken 61.8% Fibonacci retracement, the lower border of the blue rising trend channel and the 50-day moving average, which means that the overall situation in the very short term hasn’t changed much.
Additionally, the buy signals generated by the CCI and the Stochastic Oscillator continue to support the bulls, increasing the probability of another bigger move to the upside.
If this is the case and the index extends its trip to the north, we’ll likely see not only a breakout above yesterday’s high, but also an increase to the recent highs (around 96.90) or even the upper border of the blue rising tend channel in the following week(s).
Trading position (short-term; our opinion): Short positions with a stop-loss order at 1.1746 and the initial downside target at 1.1343 are justified from the risk/reward perspective. We will keep you informed should anything change, or should we see a confirmation/invalidation of the above.
USD/JPY
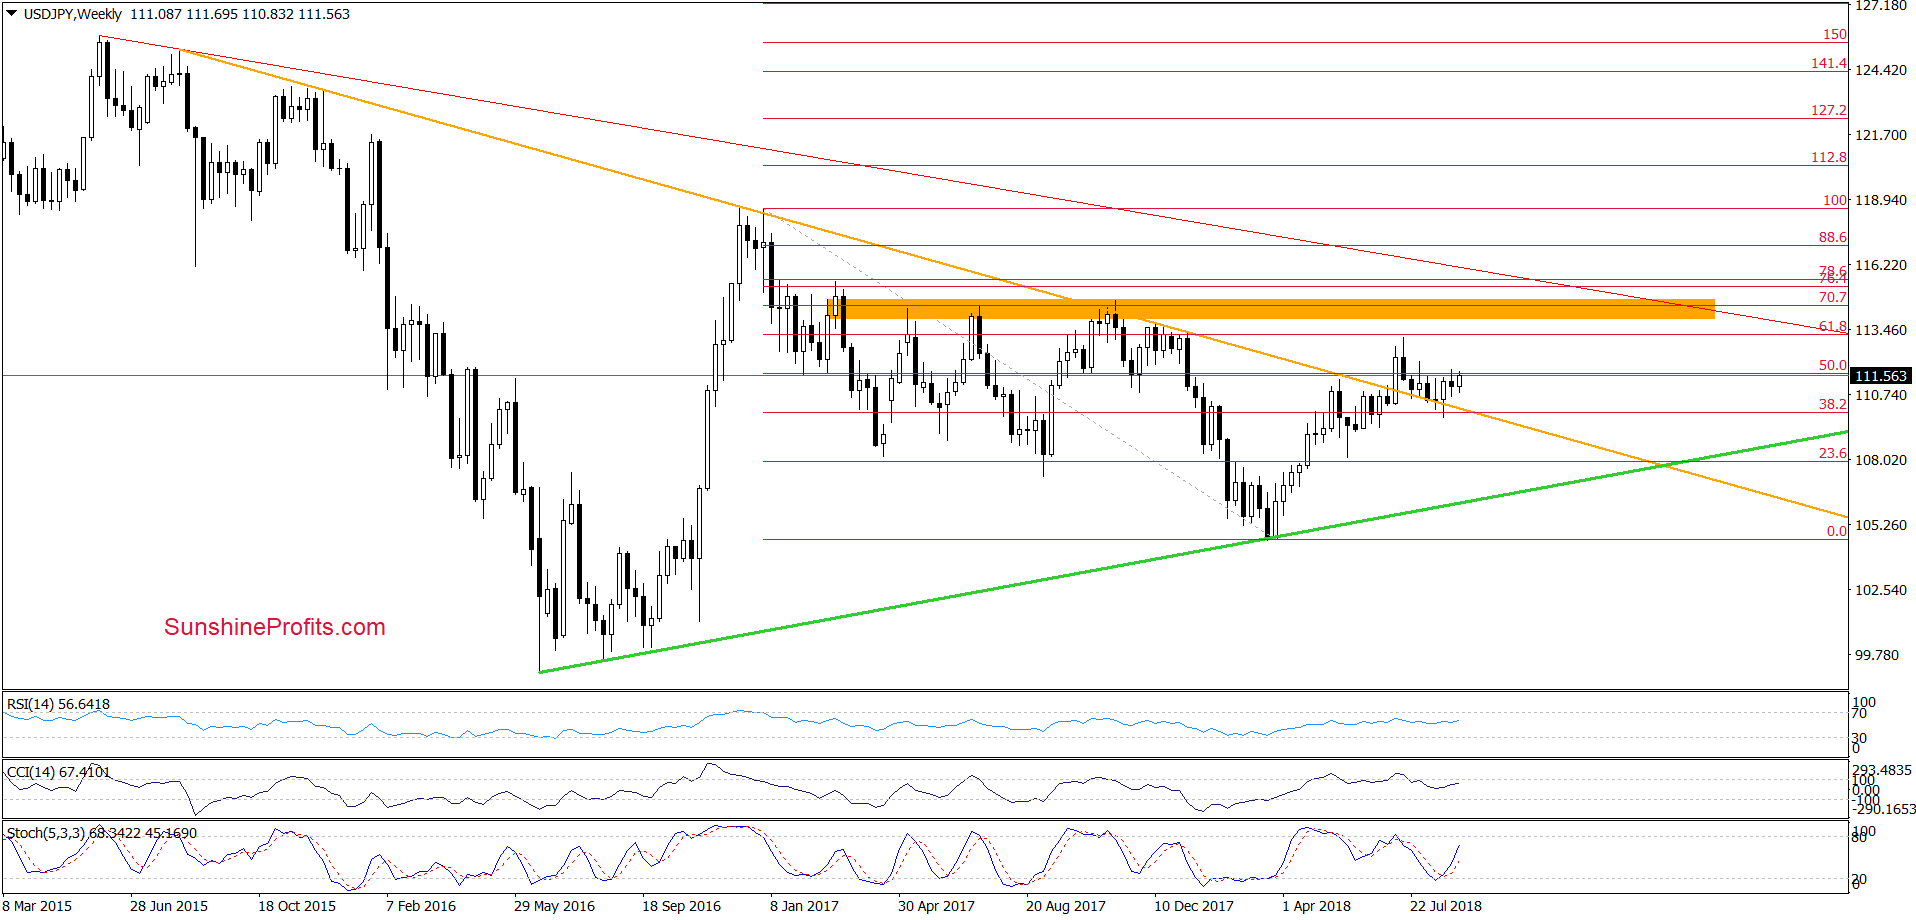
The overall situation in the medium term remains almost unchanged as USD/JPY is trading above the previously-broken long-term orange declining line (which serves as the major support), slightly below the last week’s high.
Will the short-term chart give us more clues about future moves? Let’s check.
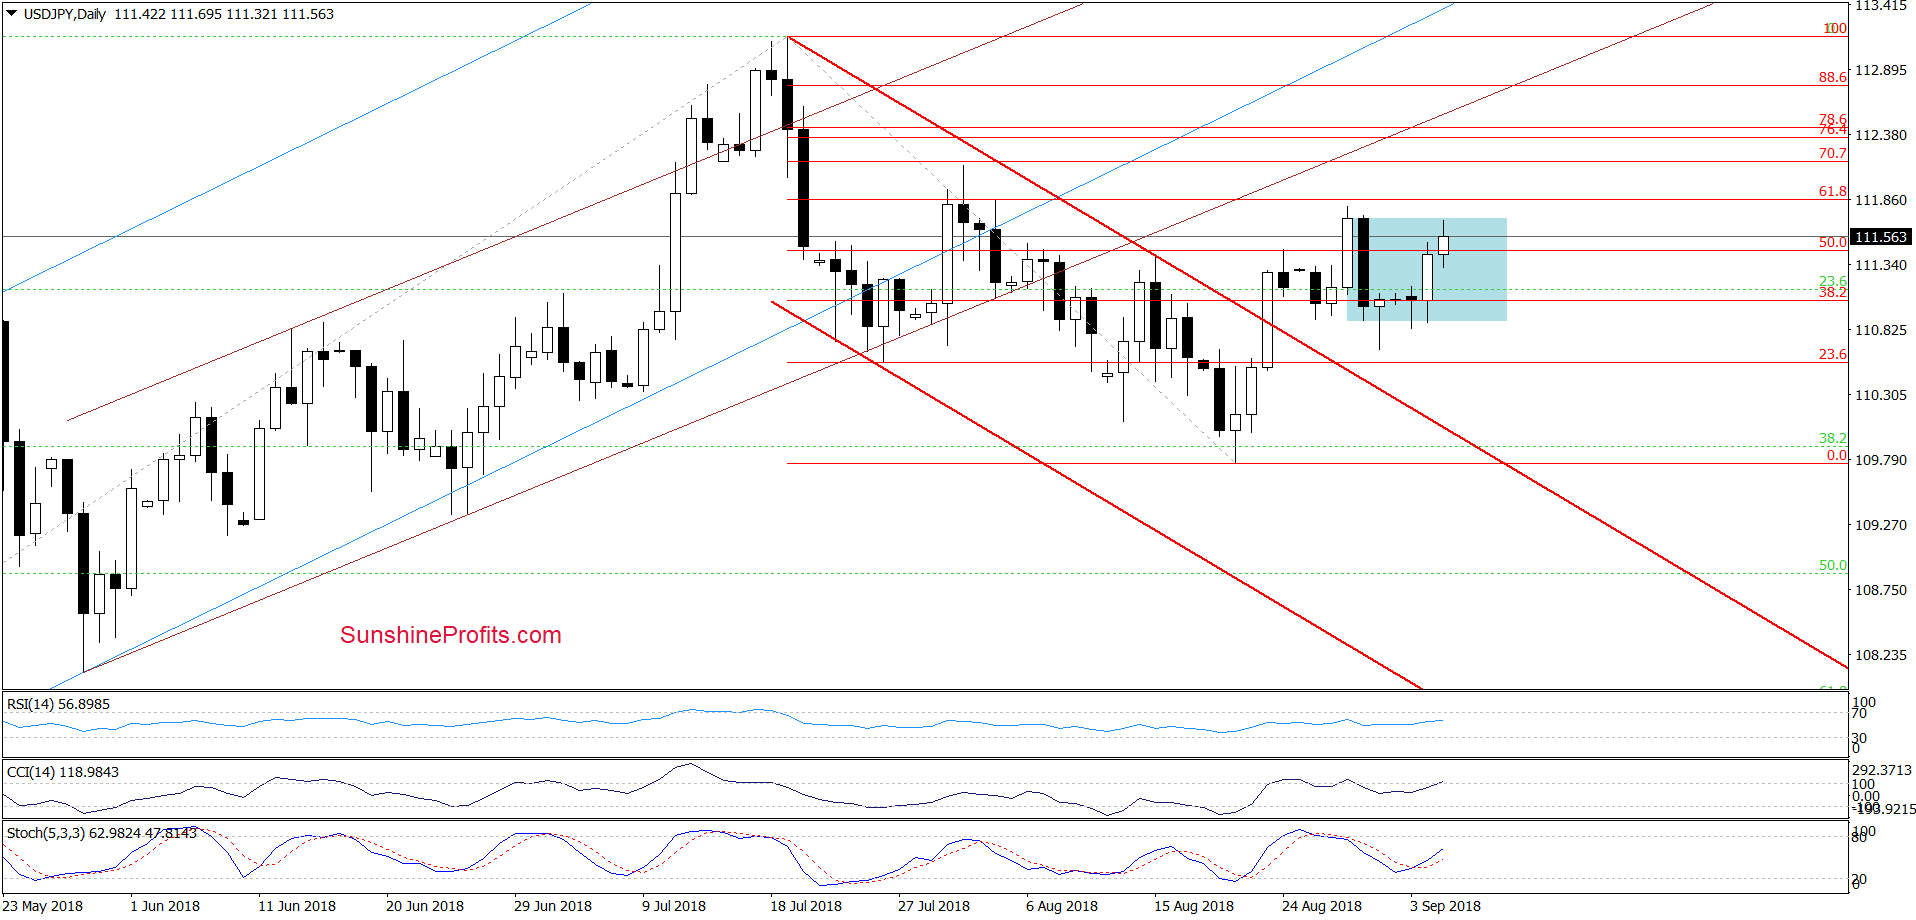
From the daily perspective, we see that although USD/JPY extended the recent rebound during today’s session, the very short-term picture hasn’t changed much as the exchange rate is still trading inside the blue consolidation slightly below the 61.8% Fibonacci retracement (based on the entire July-August decline) and the late-August peaks.
This means that as long as there is no breakout above the upper line of the formation (or a breakdown under the lower border) another bigger move to the upside is questionable and waiting at the sidelines is justified from the risk/reward perspective.
Nevertheless, the buy signals generated by the indicators remain in the cards, suggesting one more attempt to move higher in the very near future. If this is the case and the pair increases from here, we’ll likely see a test of the resistance area created by the 76.4% and 78.6% Fibonacci retracements (around 112.36-112.43) or even a climb to the previously-broken lower border of the brown rising trend channel in the following days.
Therefore, if we see a breakout above the late-August peak and the upper border of the consolidation, we’ll consider going long.
Trading position (short-term; our opinion): No positions are justified from the risk/reward perspective. We will keep you informed should anything change, or should we see a confirmation/invalidation of the above.
USD/CHF
In our last commentary on this currency pair, we wrote the following:
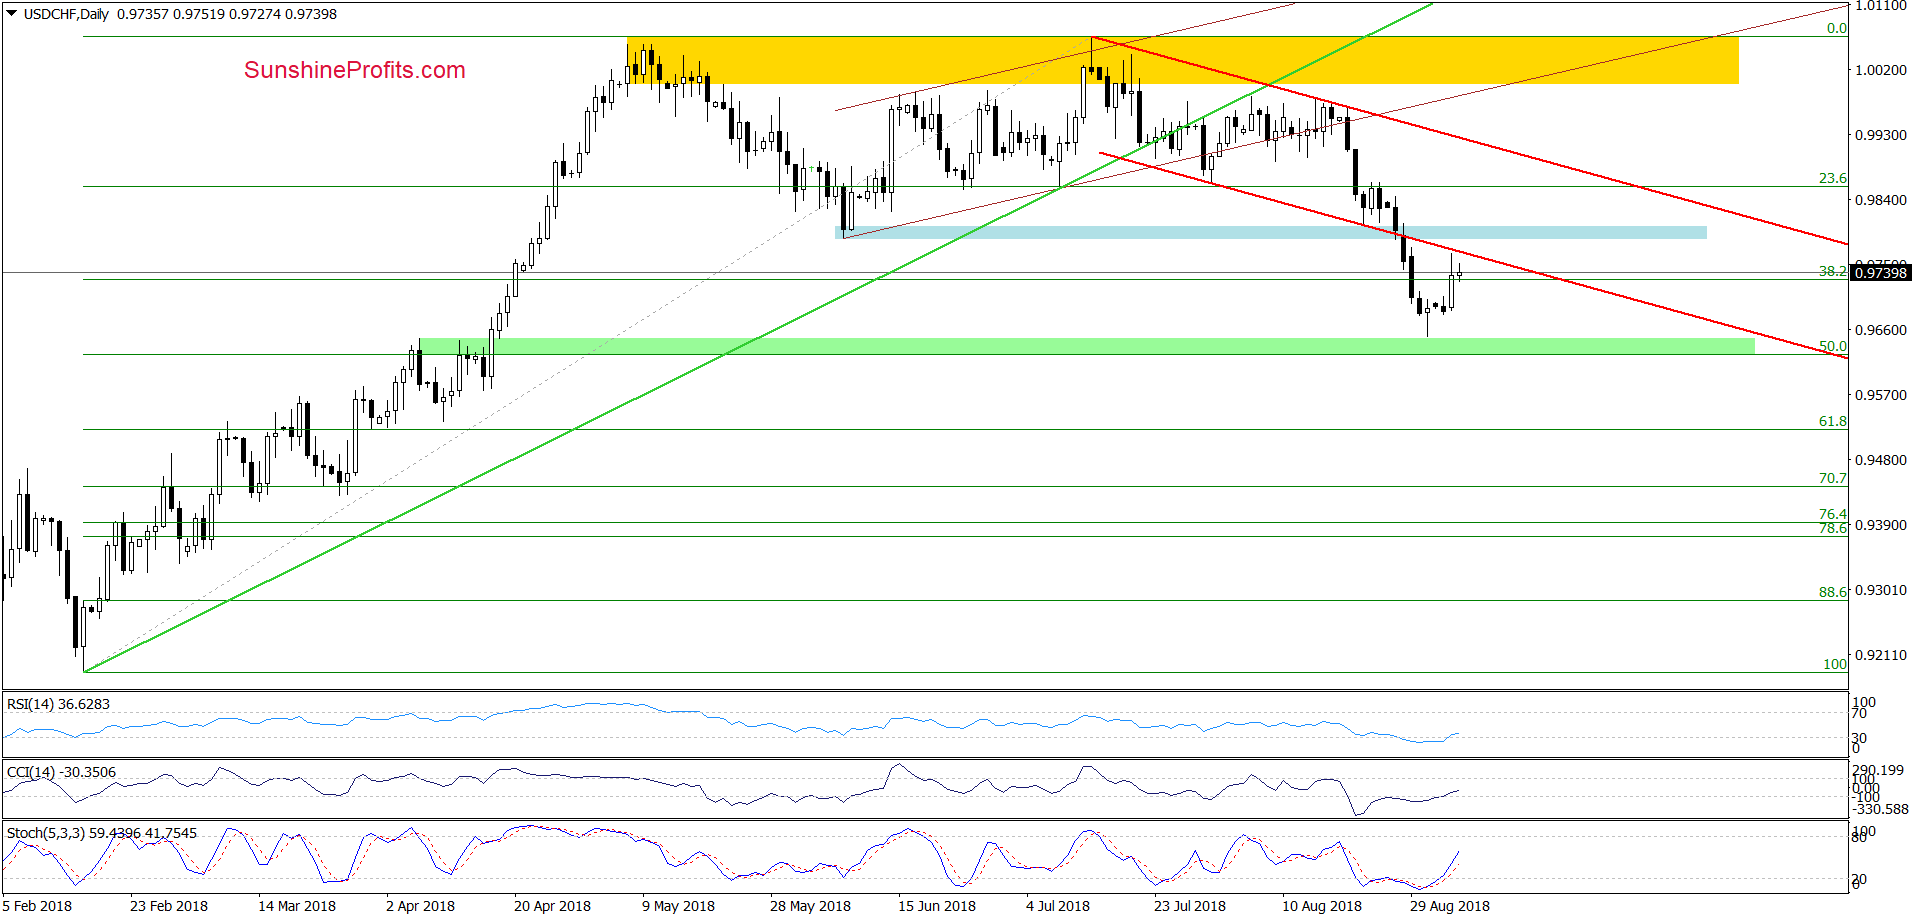
(…) The exchange rate not only declined below the lower border of the red declining trend channel, but also dropped under our next downside target.
Such situation doesn’t bode well for higher values of USD/CHF and suggests that we’ll see a test of the 38.2% Fibonacci retracement (based on the entire mid-February-mid-July upward move) in the coming days (around 0.9730).
As you see on the daily chart, currency bears not only tested our downside target, but also took USD/CHF lower on Friday. Thanks to this decline, the exchange rate approached the upper border of the green support zone (created by the early April highs and the 50% Fibonacci retracement), which triggered a rebound in the following days.
Yesterday, the pair moved quite sharply higher, but there was no comeback above the previously-broken lower border of the red declining trend channel, which suggests that we could observe a verification of the breakdown under this line. On the other hand, however, the buy signals generated by the indicators suggest that currency bulls will try to go higher.
Who will win in the coming days? It’s hard to predict with certainty, but we know that it is worth to wait at the sidelines (at least at the moment of writing this alert) and keep an eye on this currency pair, because a daily closure above the lower red line could translate into a rally to the upper border of the declining trend channel (in the case of an invalidation of the earlier breakdown we’ll consider opening long positions).
What can be the opposite scenario? Yesterday’s upswing was actually a verification of the earlier breakdown and USD/CHF will re-test the recent lows and the green support zone. Therefore, in the case of visible currency bulls’ weakness at current levels, we’ll consider going short. So, stay tuned as we will keep you informed should anything change, or should we see a confirmation/invalidation of the above.
Trading position (short-term; our opinion): No positions are justified from the risk/reward perspective.
Thank you.
Nadia Simmons
Forex & Oil Trading Strategist
Przemyslaw Radomski, CFA
Founder, Editor-in-chief, Gold & Silver Fund Manager
Gold & Silver Trading Alerts
Forex Trading Alerts
Oil Investment Updates
Oil Trading Alerts

