

Earlier today, the euro moved sharply higher against the greenback, which resulted in a breakout above recent highs and the resistance line. But how much resistances are there still in the game and what can they lead to in the coming days?
- EUR/USD: short (a stop-loss order at 1.1878; the initial downside target at 1.1343)
- GBP/USD: none
- USD/JPY: long (a stop-loss order at 110.80; the initial upside target at 112.88)
- USD/CAD: none
- USD/CHF: none
- AUD/USD: none
EUR/USD
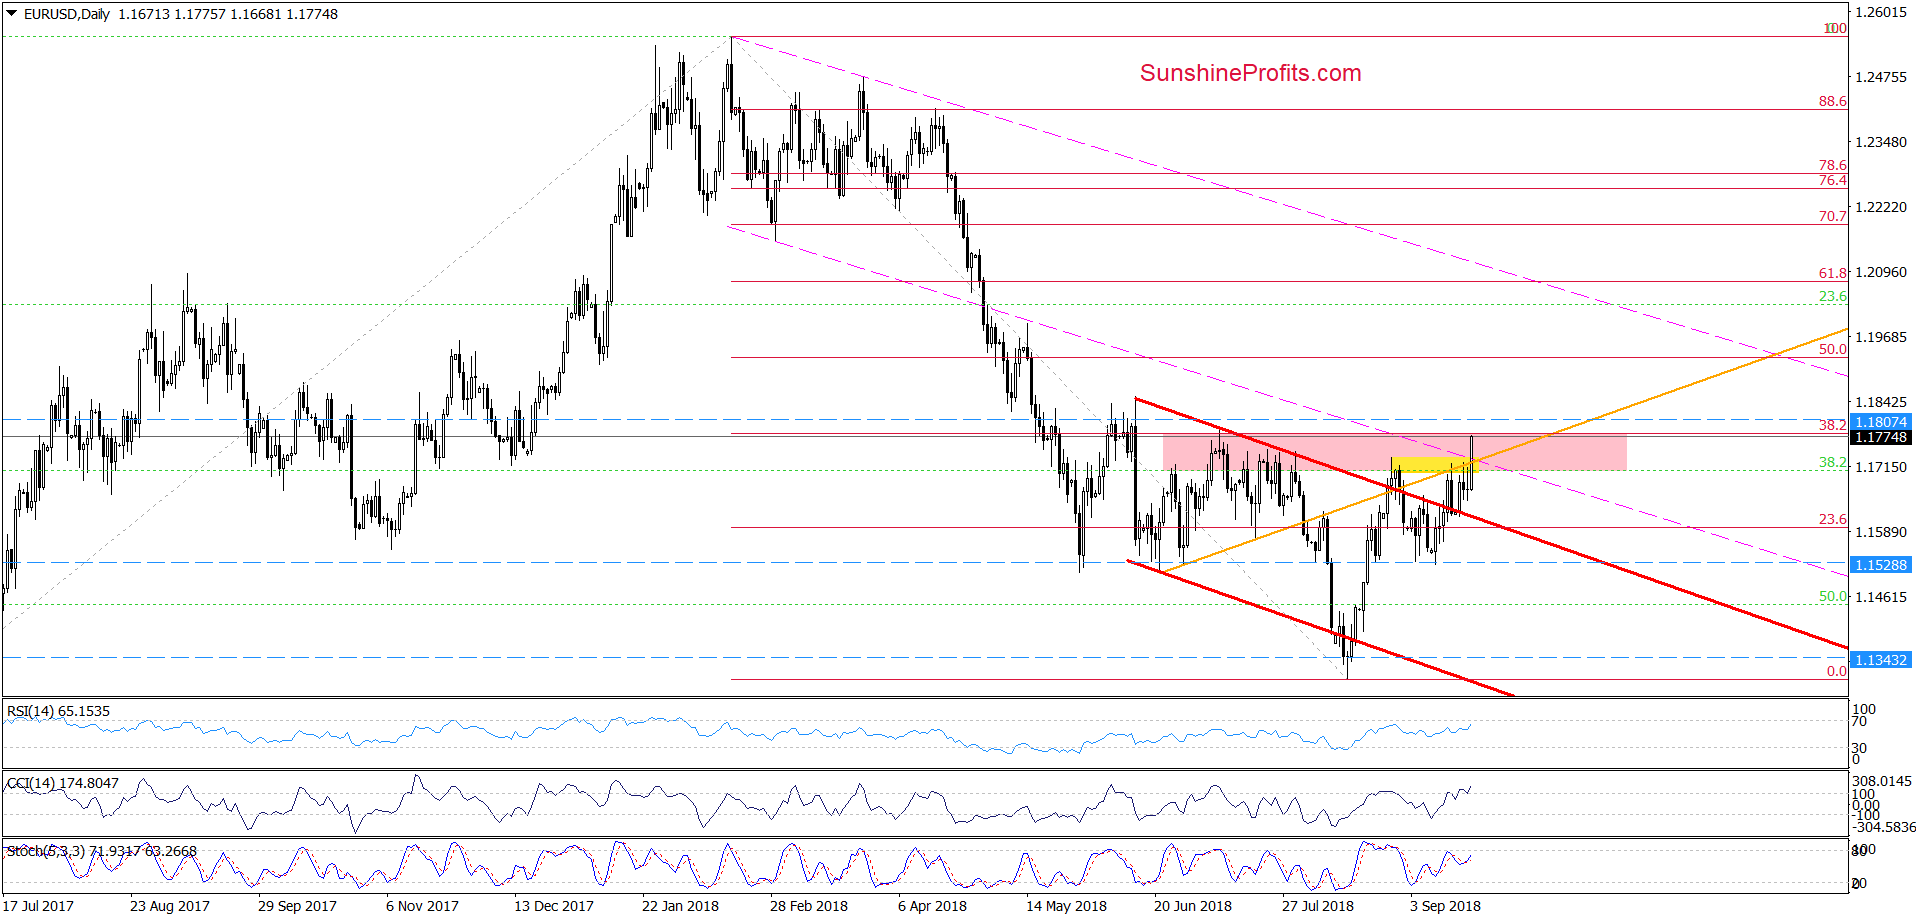
Earlier today, the exchange broke not only above the orange resistance line, but also above the yellow resistance zone based on the recent peaks.
Although this is a positive event, we should keep in mind that thanks to today’s increase, EUR/USD almost touched the 38.2% Fibonacci retracement based on the entire February-August downward move and the upper line of the pink resistance zone, which increases the probability that we’ll see another reversal and lower values of EUR/USD in the very near future.
This scenario is also reinforced by the medium-term picture.
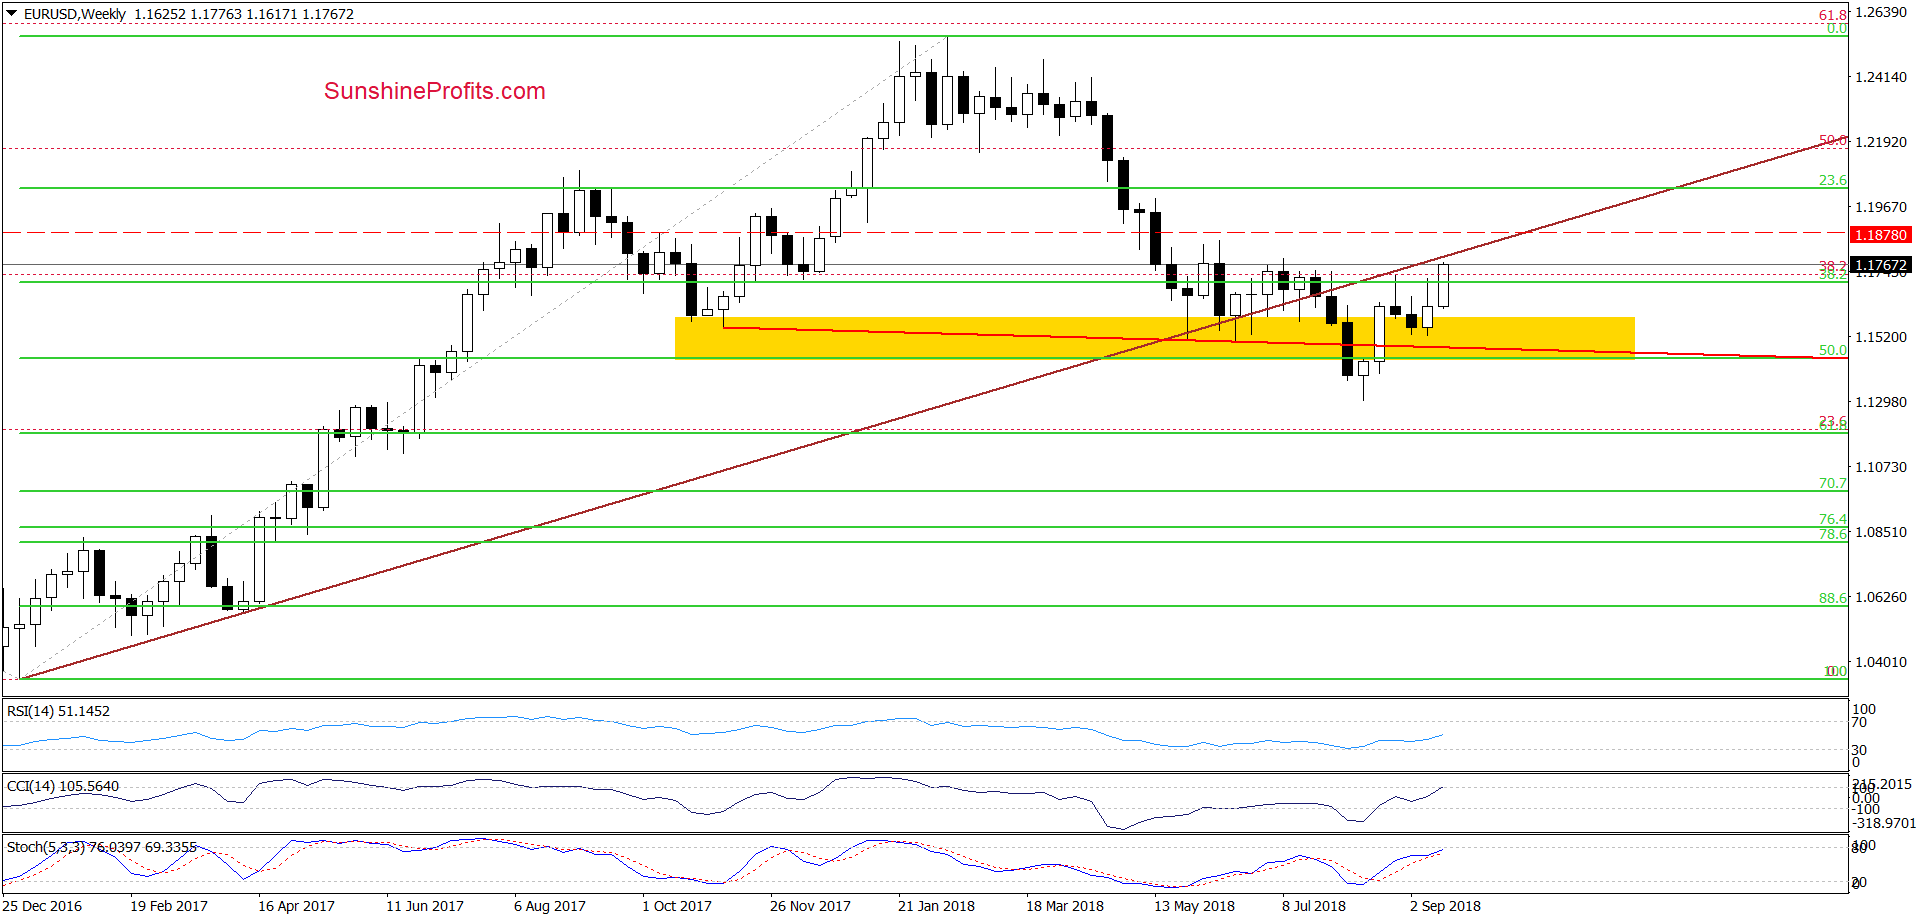
From this perspective, we see that the pair approached the previously-broken long-term brown line (at the moment of writing these words is around the barrier 1.800), which looks like a verification of the late-July breakdown.
At this point, it is worth noting that similar price action we saw at the end of August. Back then, the proximity to this important resistance encouraged currency bears to show their claws, which turned into decline.
This time, the sellers have on their side one more argument – the above-mentioned 38.2% Fibonacci retracement, which together with the upper line of the pink resistance zone and the long-term brown resistance line will likely stop further improvement in the very near future.
Nevertheless, to avoid closing our short positions, we decided to move our stop-loss order to 1.1878 – slightly above the long-term resistance line.
Trading position (short-term; our opinion): Short positions with a stop-loss order at 1.1878 and the initial downside target at 1.1343 are justified from the risk/reward perspective.
GBP/USD
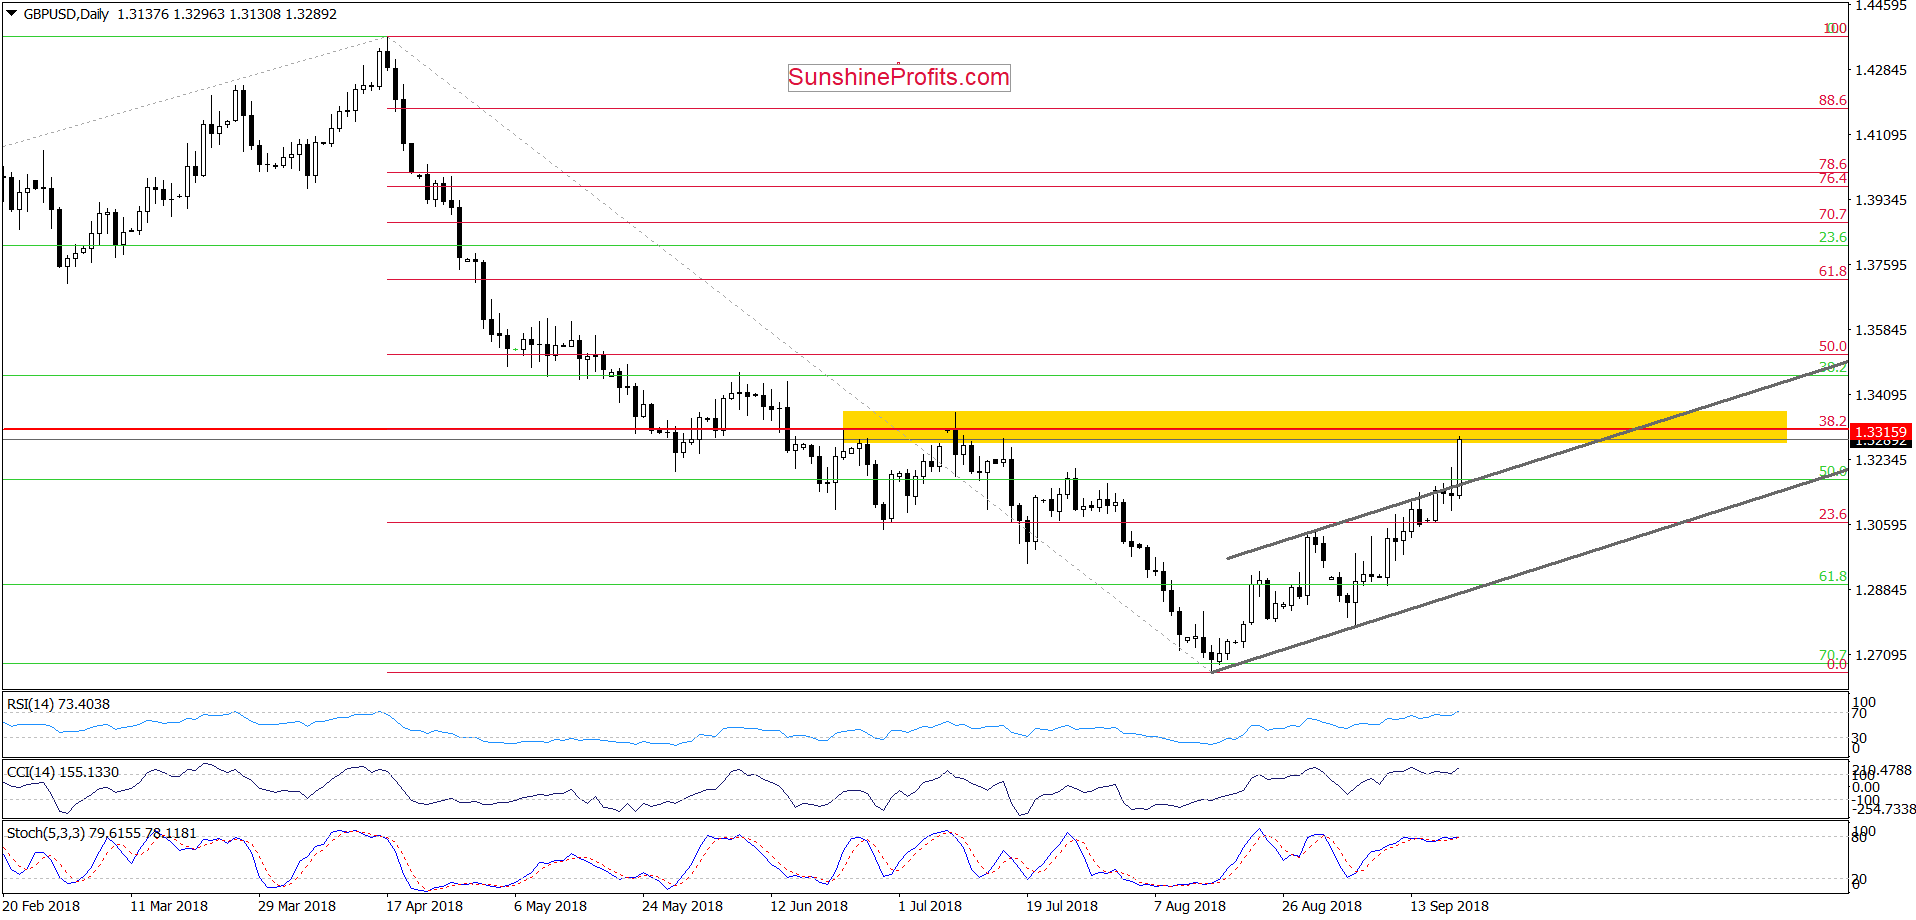
Although GBP/USD closed Tuesday’s session under the previously-broken upper line of the grey trend channel, although we saw a repeat of this price action during yesterday’s session, news from an informal summit of European Union leaders in Austria (there is no substantial progress on Brexit deal) pushed the exchange rate higher earlier today.
As a result, the pair rallied well above the upper line of the grey rising trend channel, activating our stop-loss order, which protected our capital against major losses. Thanks to today’s move, GBP/USD (similarly to what we saw in the case of EUR/USD) climbed to the yellow resistance zone created by the July highs and reinforced by the 38.2% Fibonacci retracement (based on the entire mid-April-mid-August downward move).
Additionally, slightly above these levels is also the previously-broken long-term blue resistance line (seen more clearly on the weekly chart below), which in combination with the above-mentioned technical obstacles increased the likelihood of reversal in the coming day(s).
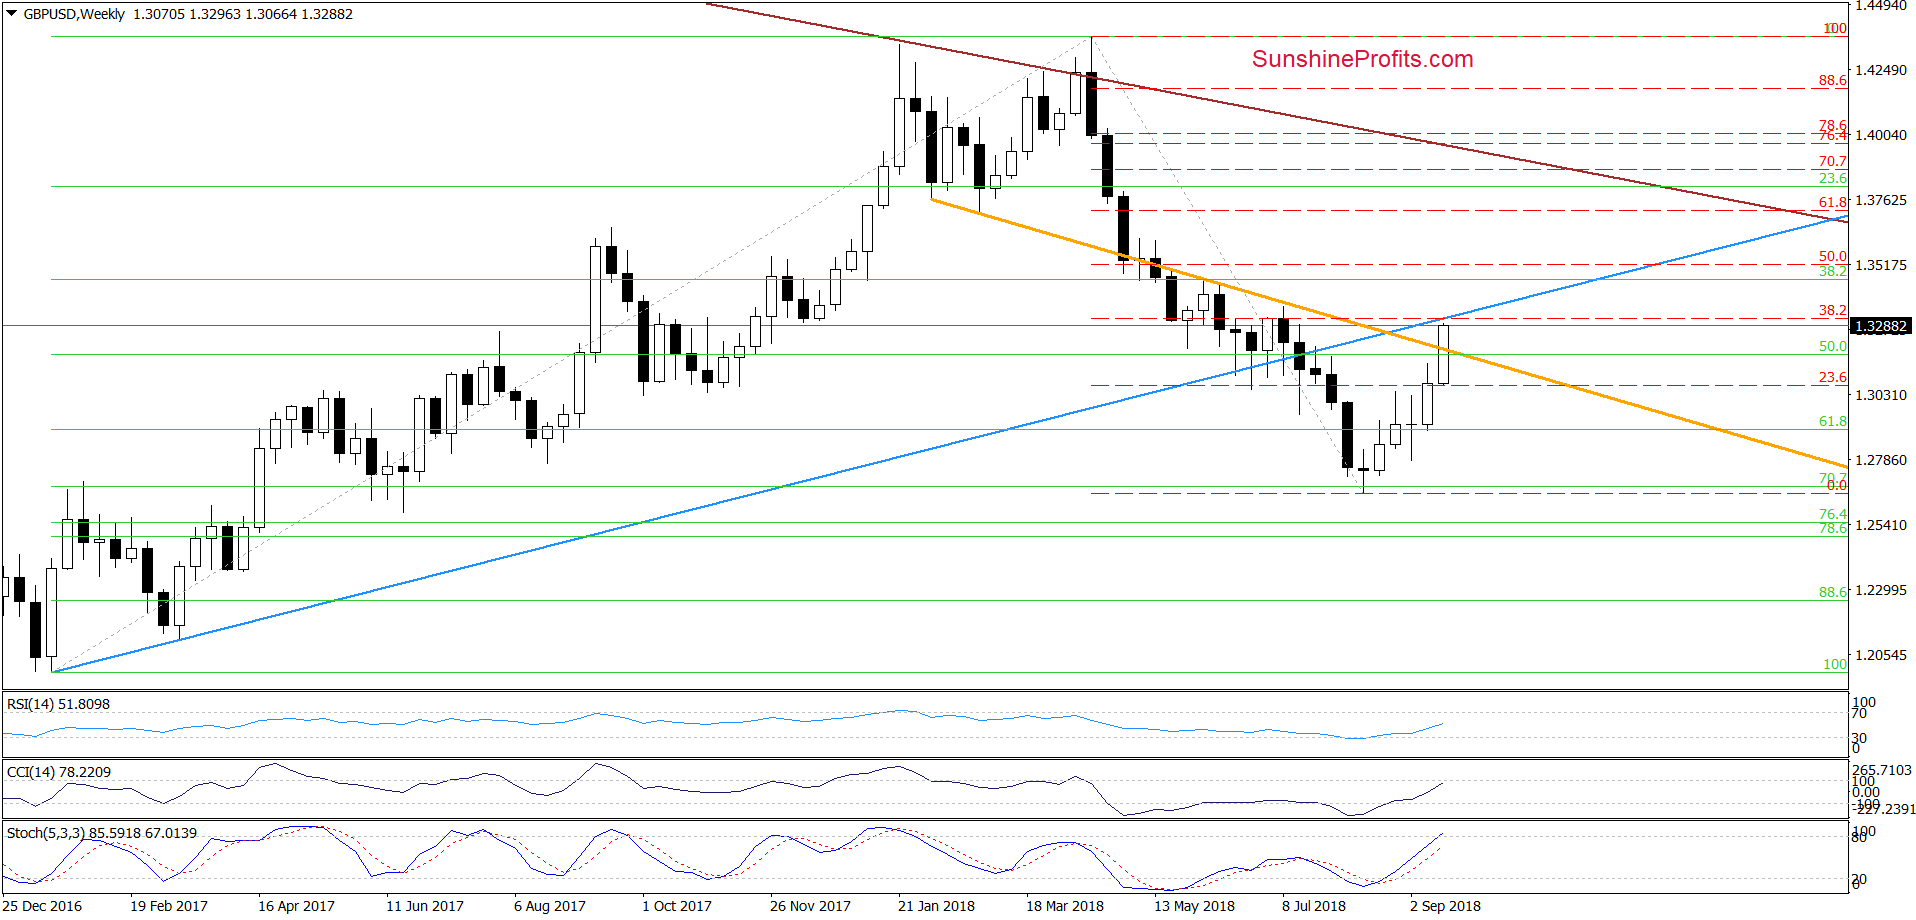
If this is the case, and we see oil bulls’ weakness in this area, we’ll likely re-open short positions at more favorable levels. We will keep you informed should anything change, or should we see a confirmation/invalidation of the above.
Trading position (short-term; our opinion): No positions are justified from the risk/reward perspective.
USD/JPY
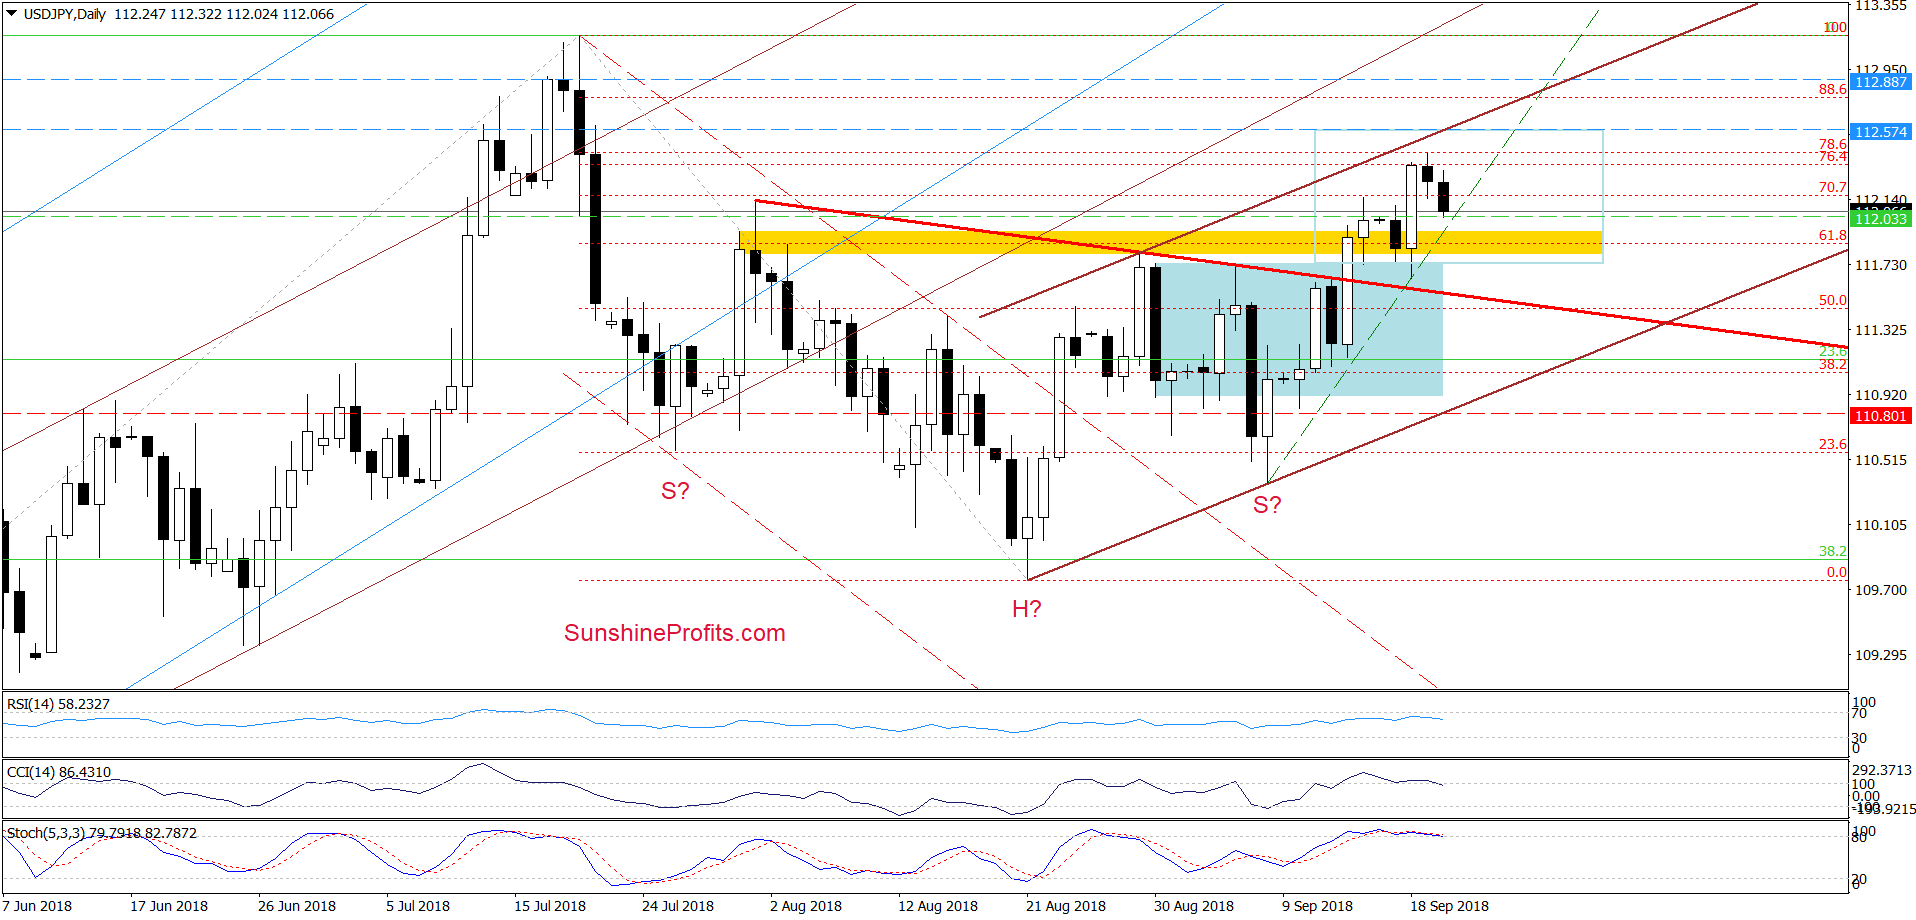
Looking at the daily chart, we see that although USD/JPY moved lower earlier today, the pair is still trading above the previously-broken yellow zone, the upper border of the blue consolidation and well above the red declining resistance line based on August peaks (the neck line of the reverse head and shoulders formation).
Additionally, the very short-term black dashed support line based on the September lows withstood the selling pressure earlier today, which suggests that (at least) one more upswing and a test of the upper border of the brown rising trend channel is very likely – especially when we factor in the fact that in this area (around 112.57) the size of the upward move will correspond to the height of the blue consolidation.
Trading position (short-term; our opinion): Long positions with a stop-loss order at 110.80 and the initial upside target at 112.88 are justified from the risk/reward perspective.
Thank you.
Nadia Simmons
Forex & Oil Trading Strategist
Przemyslaw Radomski, CFA
Founder, Editor-in-chief, Gold & Silver Fund Manager
Gold & Silver Trading Alerts
Forex Trading Alerts
Oil Investment Updates
Oil Trading Alerts

