

Since the beginning of the week the EUR/USD chart has already bored us awfully as the currency pair moved in a very narrow range slightly above two very important support lines. When will we finally see the breakthrough and open position?
In our opinion the following forex trading positions are justified - summary:
- EUR/USD: none
- GBP/USD: short (a stop-loss order at 1.4549; the initial downside target at 1.4000)
- USD/JPY: none
- USD/CAD: short (a stop-loss order at 1.2852; the next downside target at 1.2510)
- USD/CHF: none
- AUD/USD: none
EUR/USD
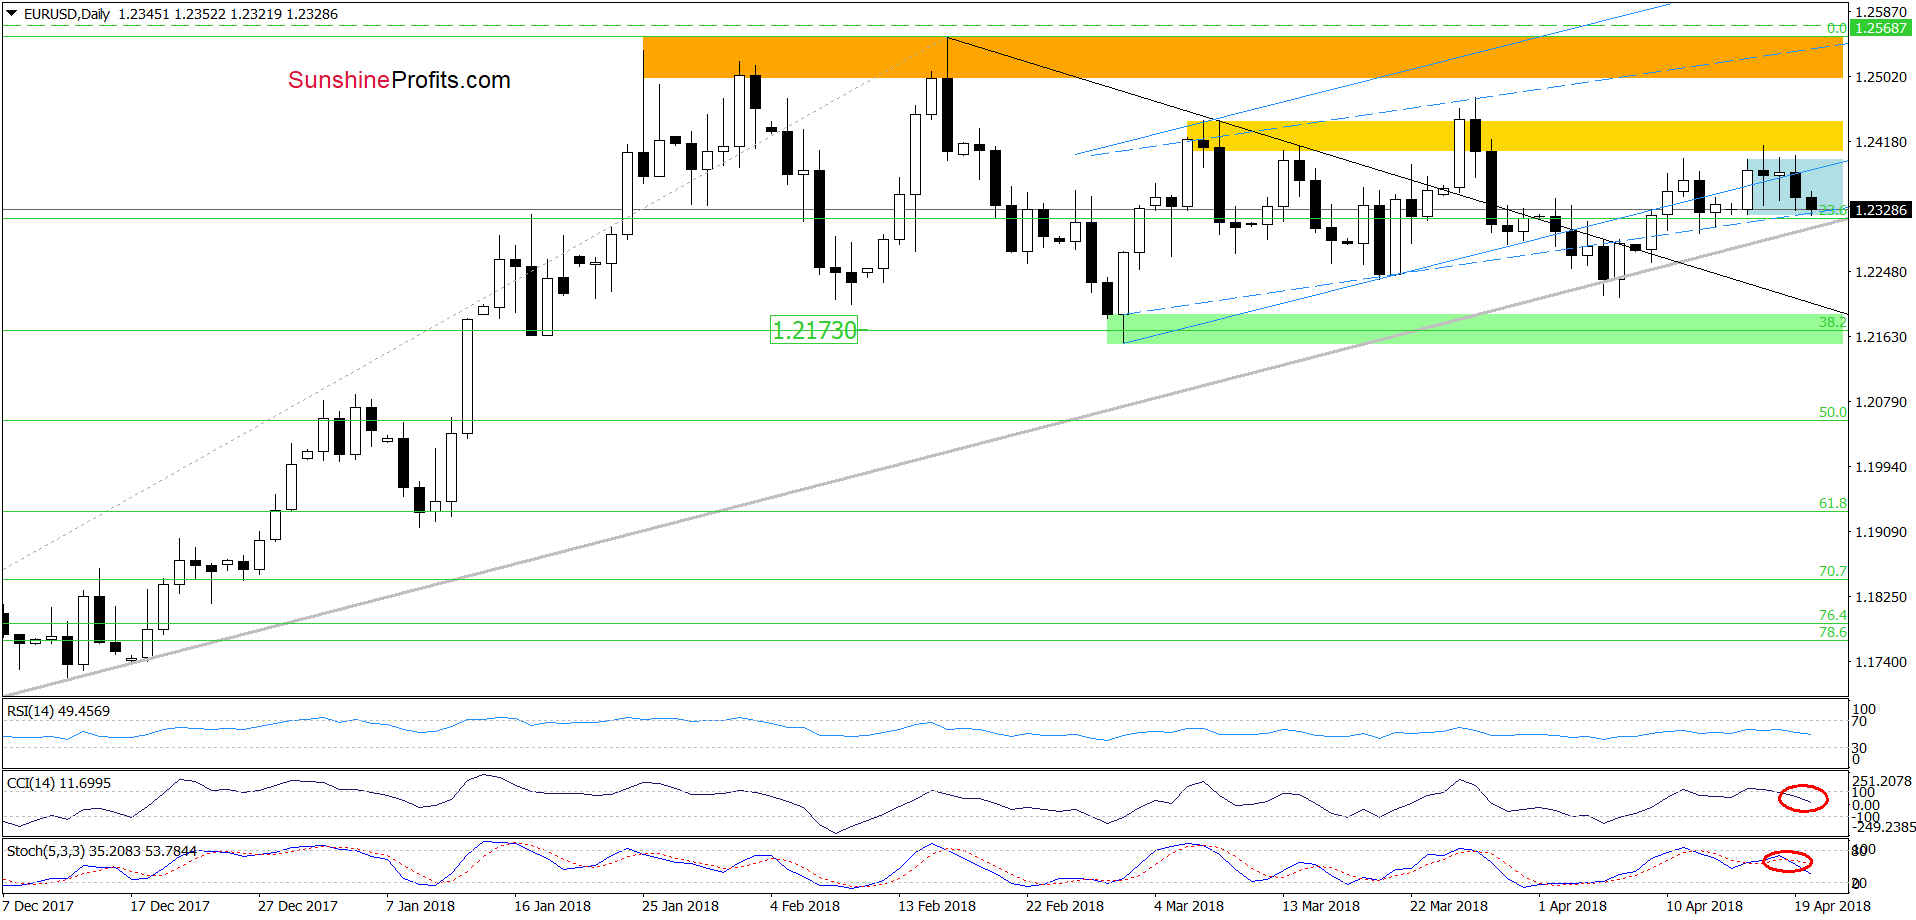
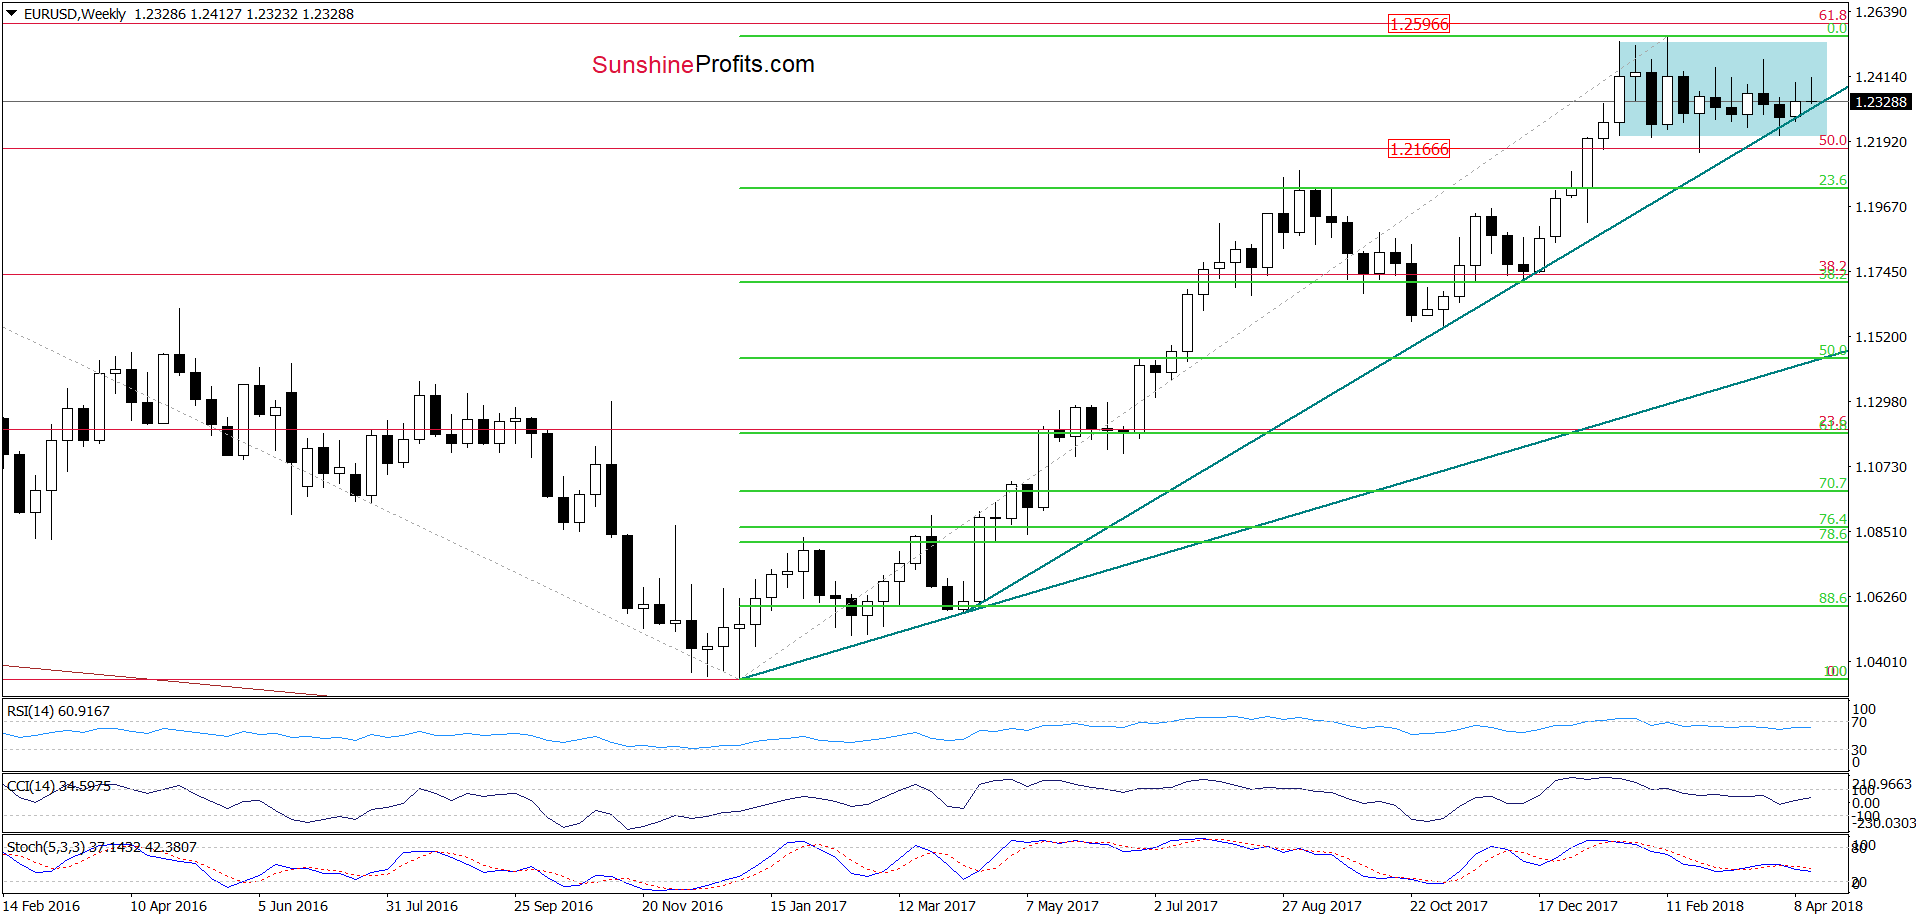
Looking at the daily chart, we see that although the exchange rate moved lower once again during yesterday’s session, EUR/USD is still trading inside the blue consolidation slightly above the medium-term grey support line and the long-term green line marked on the weekly chart below. This means that as long as there is no breakdown below them a bigger move to the downside is not reliable enough to justify opening short positions.
Trading position (short-term; our opinion): No positions are justified from the risk/reward perspective. Nevertheless, if EUR/USD closes today’s session under the above-mentioned support lines, we’ll likely open short positions. We will keep you informed should anything change, or should we see a confirmation/invalidation of the above.
GBP/USD
On Wednesday, we wrote the following:
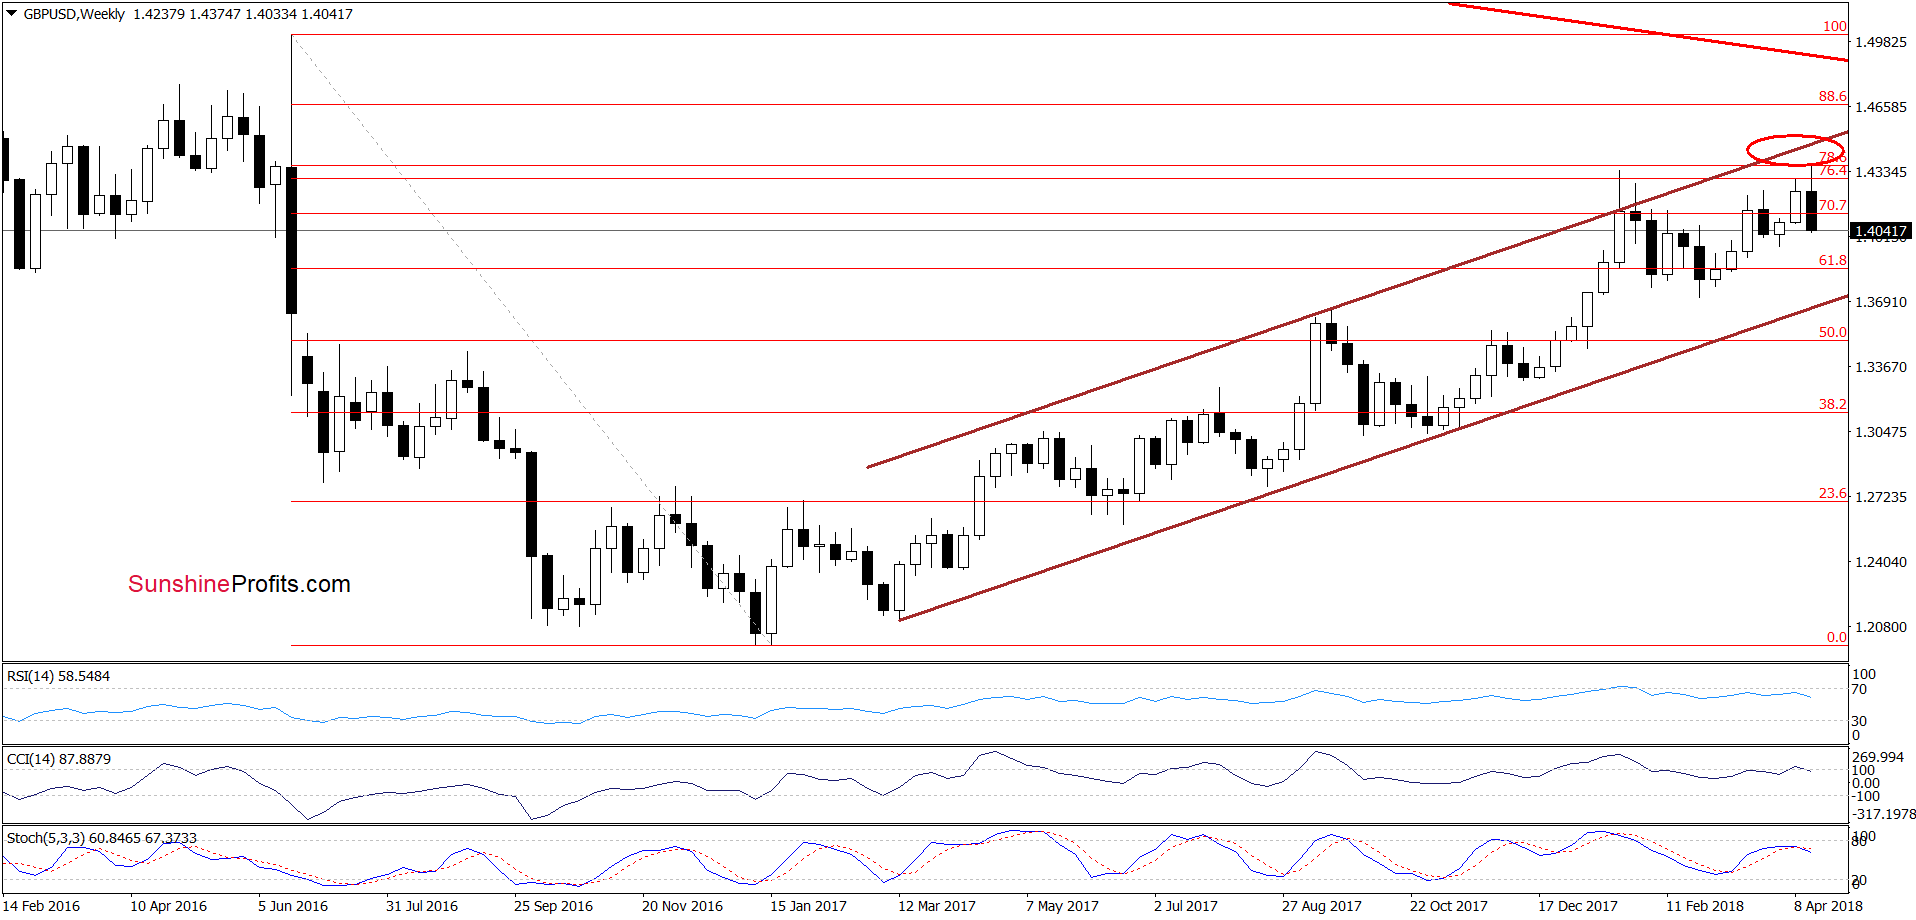
(…) GBP/USD extended gains on Monday, touching our next upside target - the 78.6% Fibonacci retracement. Despite this improvement, currency bulls didn’t manage to hold gained levels, which resulted in a pullback and a comeback below the January peak.
In this way, the exchange rate invalidated the earlier breakout (a sign of weakness), which in combination with the above-mentioned strong resistance zone, the sell signals generated by all daily indicators and potential reversal in the USD Index increases the probability of another move to the downside.
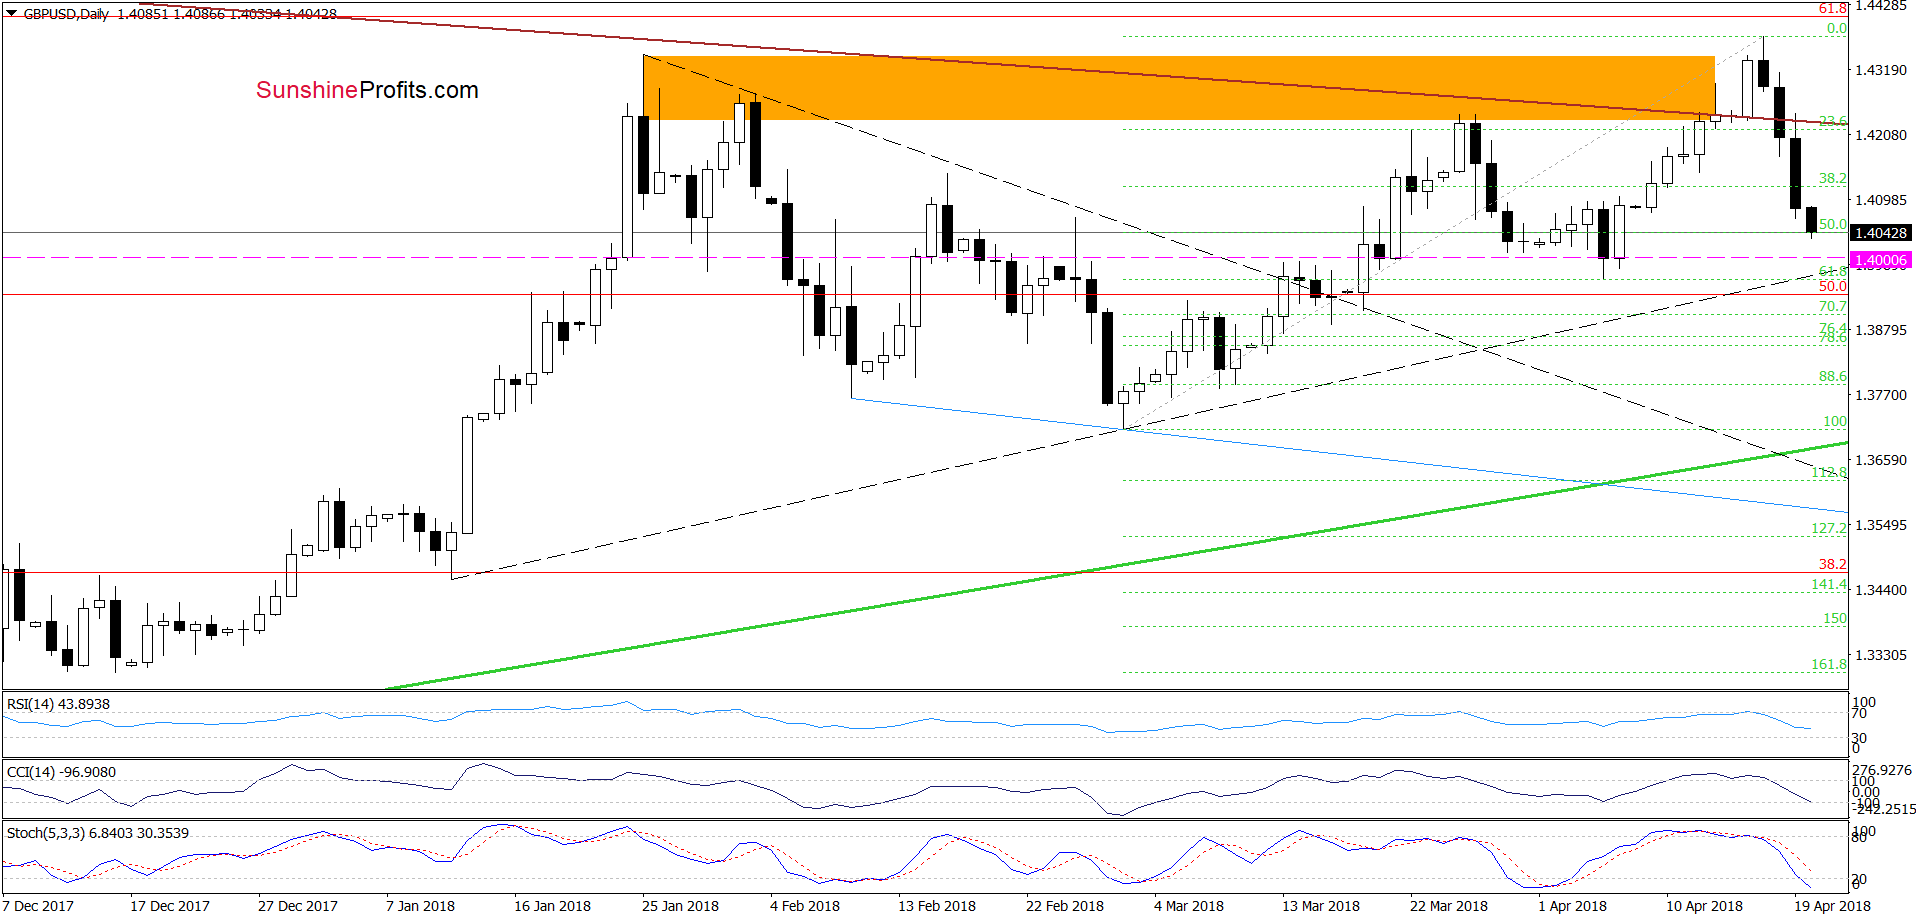
As you see on the daily chart, the situation developed in tune with our assumptions and GBP/USD extended losses after our alert was posted. Thanks to the Wednesday’s decline, the pair invalidated also the earlier breakout above the long-term brown declining resistance line (based on the June and August 2015 peaks) and verified this drop on the following day which accelerated declines, making our short positions more profitable.
Yesterday’s sharp move took the pair under the 38.2% Fibonacci retracement, which resulted in further deterioration and a drop to the next retracement earlier today. Although this support could trigger a small rebound, the sell signals generated by the daily indicators remains in the cards, supporting currency bears and lower values of the exchange rate.
And speaking about the signals… thanks to this week’s decline the weekly indicators (the CCI and the Stochastic Oscillator) also generated the sell signals, increasing the probability of further deterioration in the coming week(s).
Where will GBP/USD head next if it extends losses from current levels?
In our opinion, the first downside target will be around 1.39-64-1.4000, where the early April lows (in terms of an intraday and closing prices) are. This area is also supported by the black dashed line based on the previous lows, which increases the importance of this area for both sides of the market. Why? If currency bulls win, we’ll see a bigger rebound (maybe even to the above-mentioned long-term brown declining resistance line). However, if the sellers manage to break below this zone, we could see a downward move even to around 1.3786-1.3812, where the early March lows (in terms of an intraday and closing prices) and the 88.6% Fibonacci retracement are.
Trading position (short-term; our opinion): Profitable short positions (with a stop-loss order at 1.4549 and the initial downside target at 1.4000) are justified from the risk/reward perspective. We will keep you informed should anything change, or should we see a confirmation/invalidation of the above.
AUD/USD
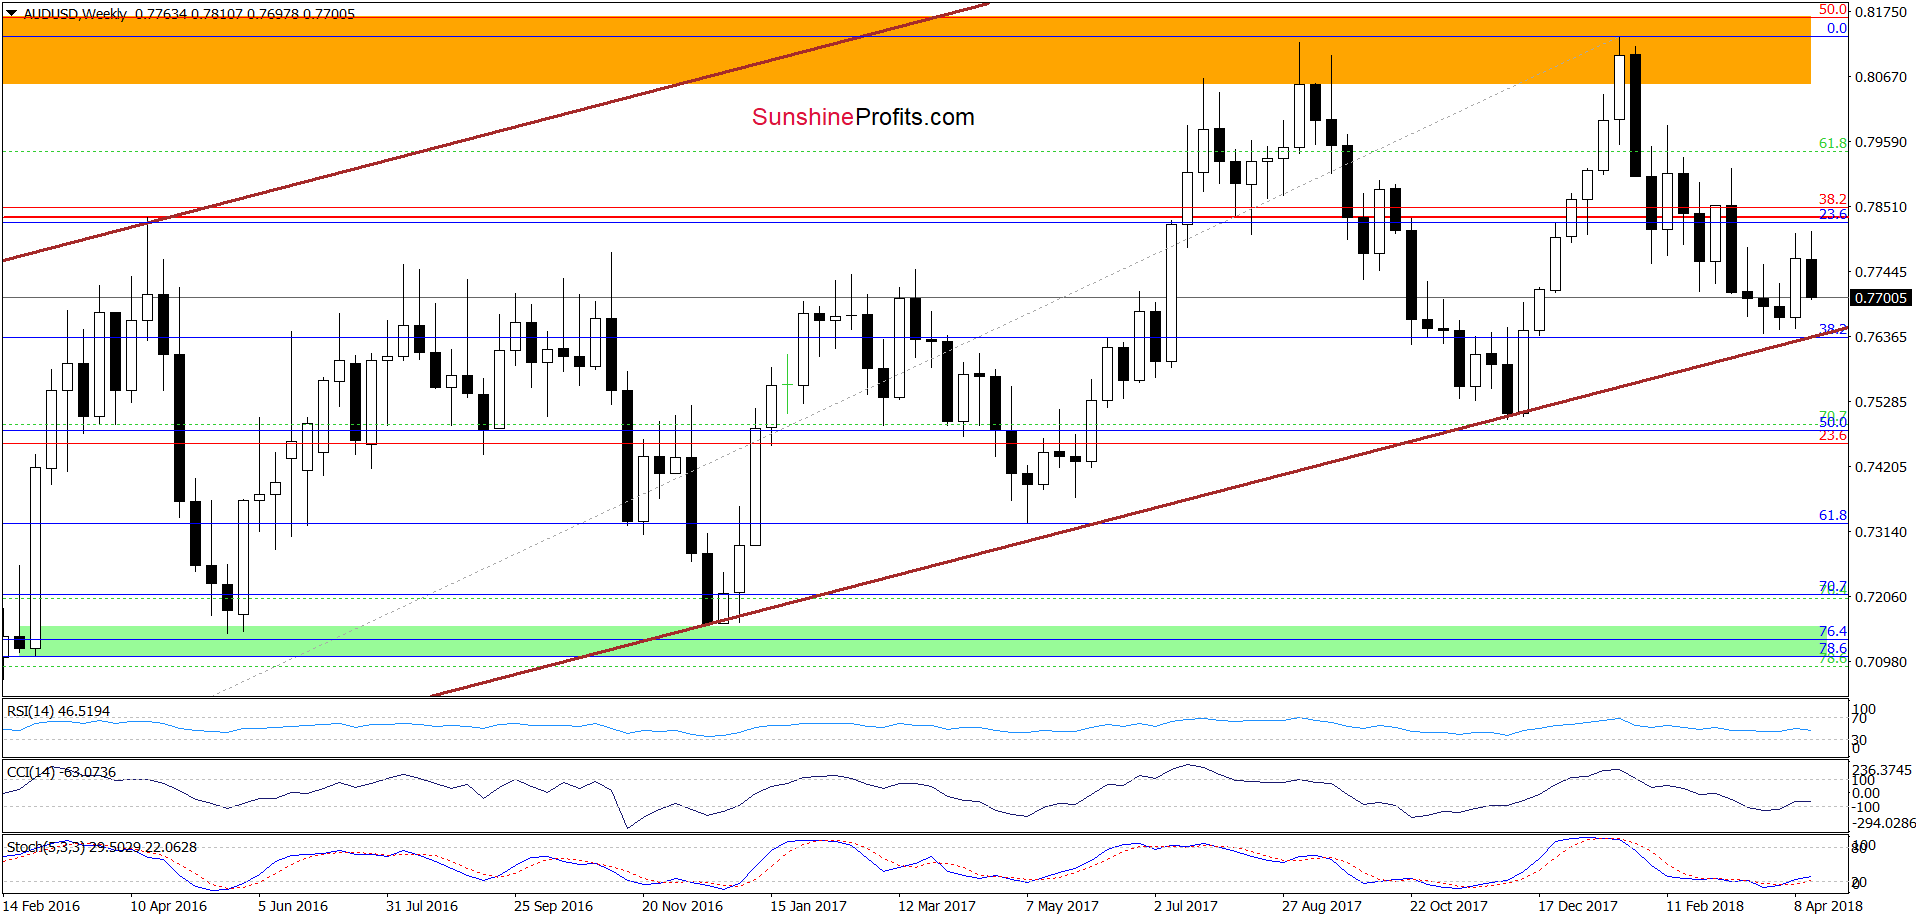
Looking at the medium-term chart, we see that AUD/USD reversed and erased over 60% of the last week’s increase in recent days. How did this drop affect the very short-term picture of the exchange rate? Let’s check on the daily chart below.
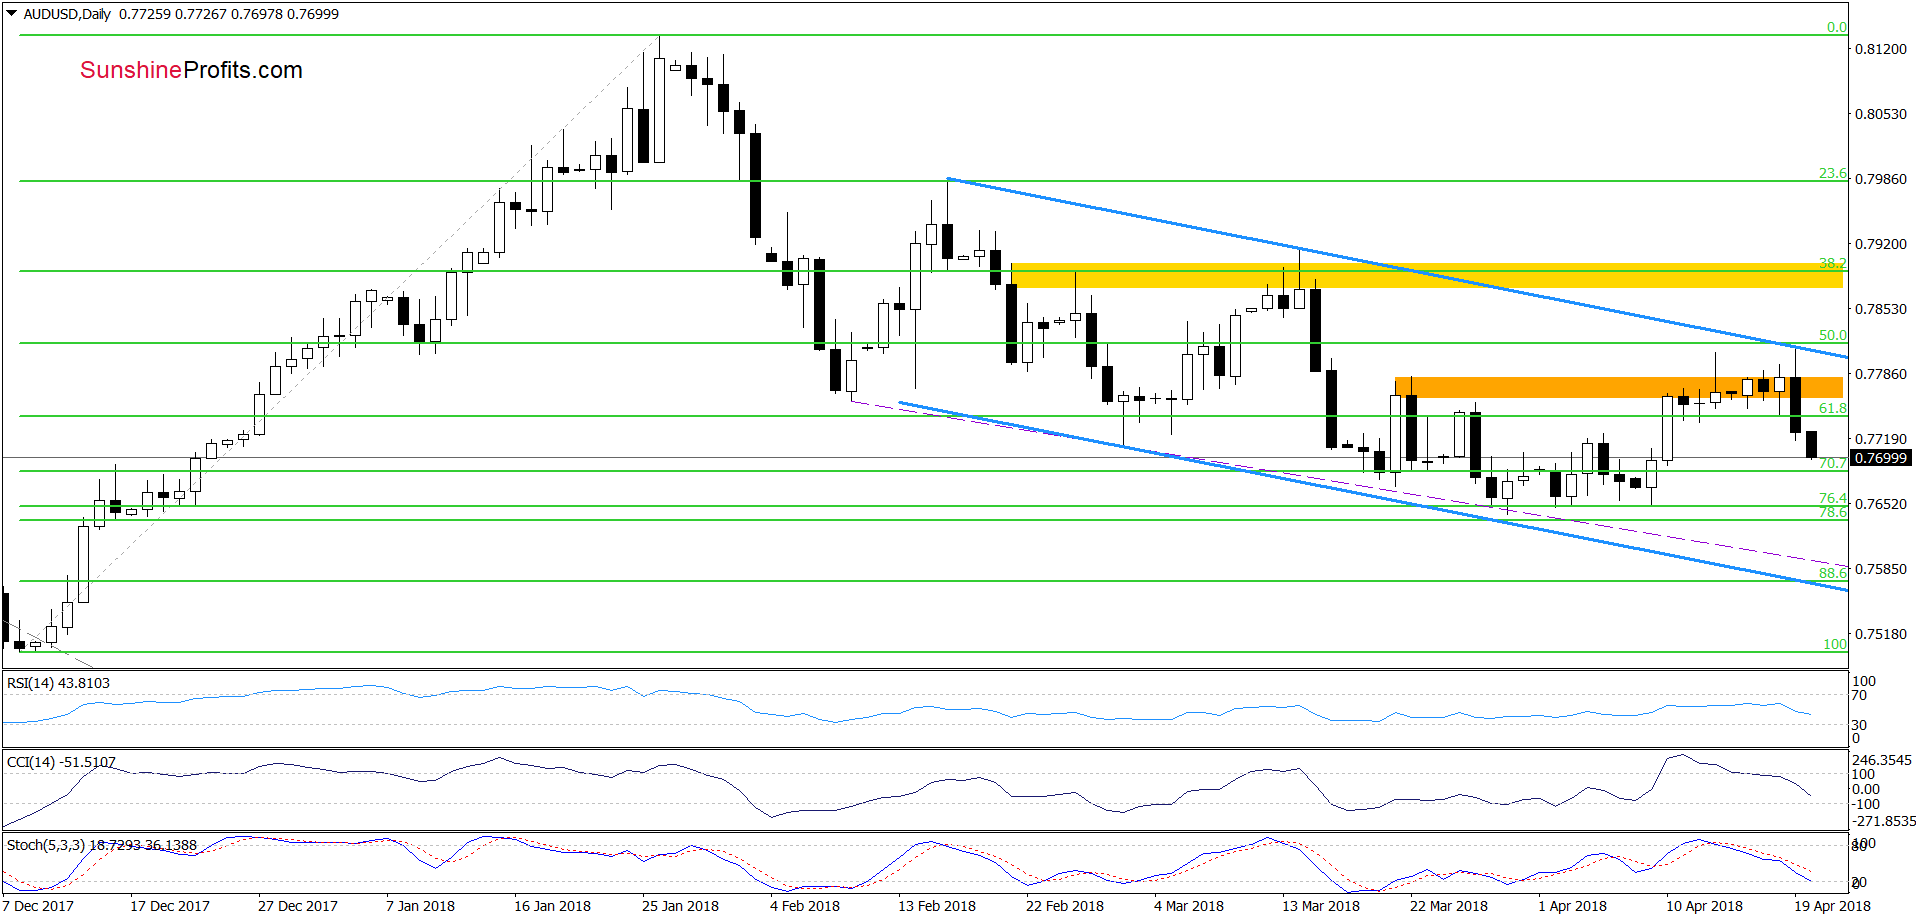
From today’s point of view, we see that although AUD/USD broke above the orange resistance zone once again during yesterday’s session, this improvement was very temporary as the upper border of the blue declining trend channel encouraged currency bears to act.
Thanks to their attack, the pair slipped under the orange zone, invalidating the earlier breakout, which together with the sell signals generated by the CCI and the Stochastic Oscillator suggests further deterioration in the coming days.
How low could AUD/USD go?
In our opinion, if the pair extends losses, we’ll likely see a test of the recent lows, which are currently reinforced by the lower border of the long-term brown rising trend channel seen on the weekly chart.
Trading position (short-term; our opinion): No positions are justified from the risk/reward perspective. We will keep you informed should anything change, or should we see a confirmation/invalidation of the above.
Thank you.
Nadia Simmons
Forex & Oil Trading Strategist
Przemyslaw Radomski, CFA
Founder, Editor-in-chief, Gold & Silver Fund Manager
Gold & Silver Trading Alerts
Forex Trading Alerts
Oil Investment Updates
Oil Trading Alerts

