

In our opinion the following forex trading positions are justified - summary:
- EUR/USD: short (a stop-loss order at 1.2250; the initial downside target at 1.1510)
- GBP/USD: short (a stop-loss order at 1.3773; the next downside target at 1.3000)
- USD/JPY: none
- USD/CAD: none
- USD/CHF: none
- AUD/USD: none
EUR/USD
On Friday, we wrote the following:
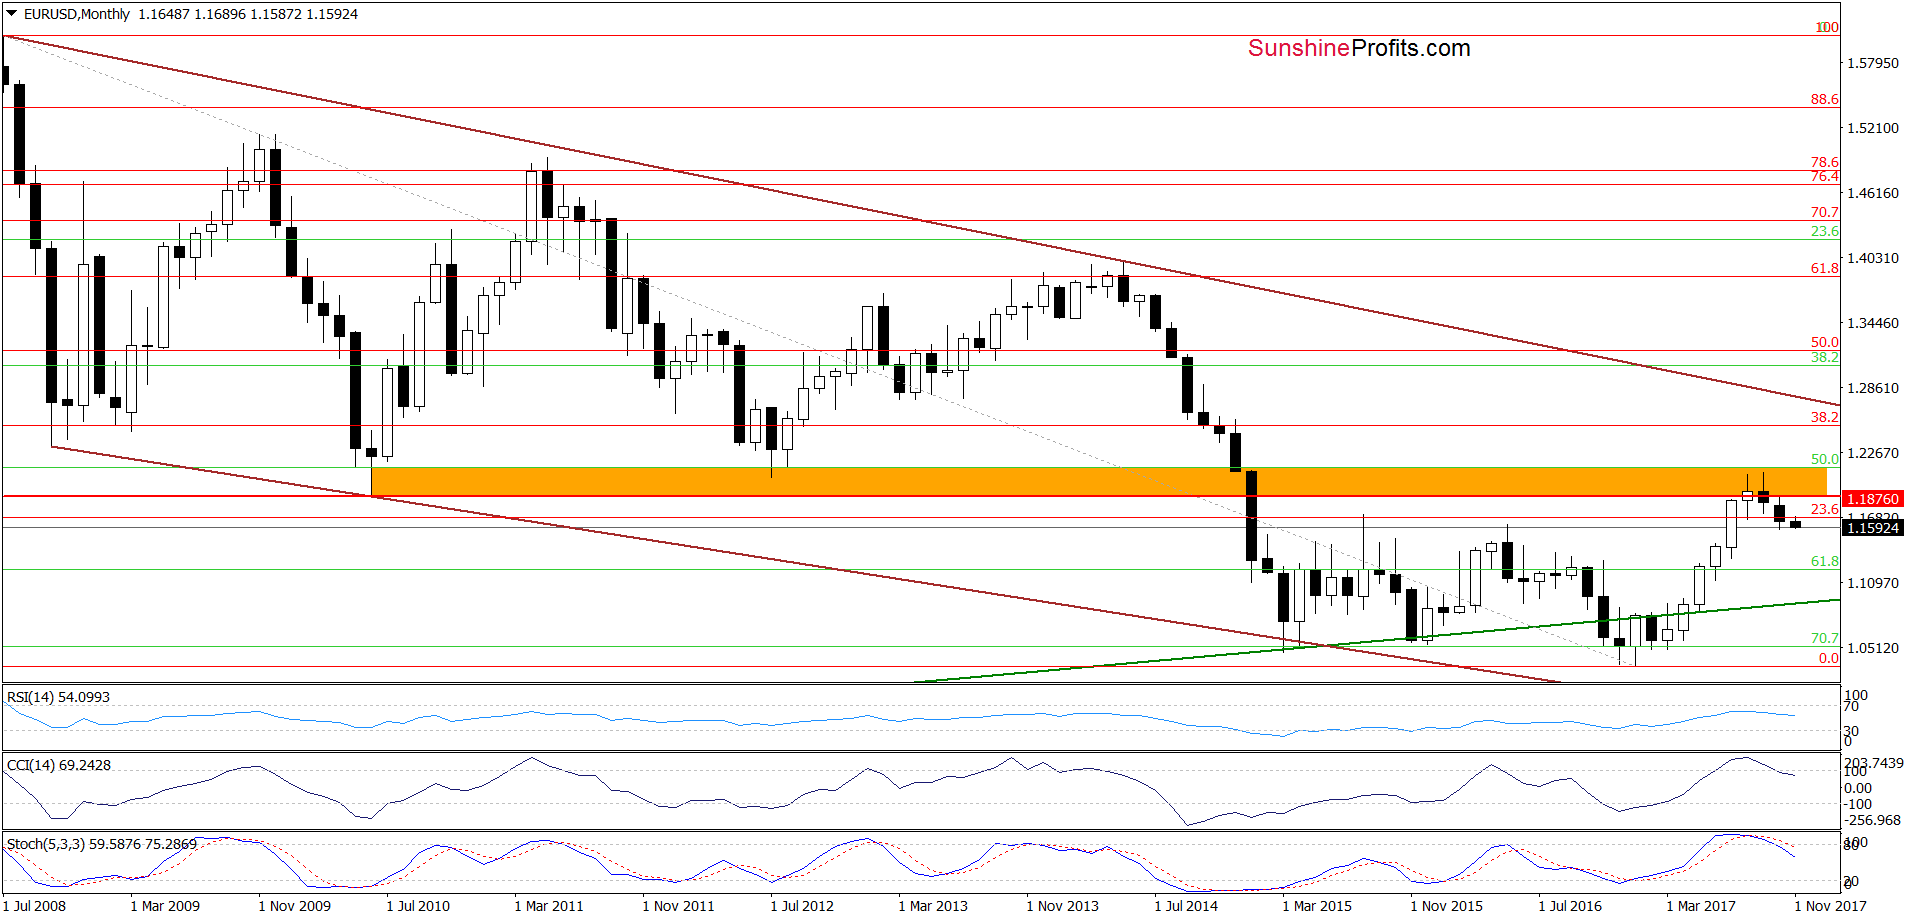
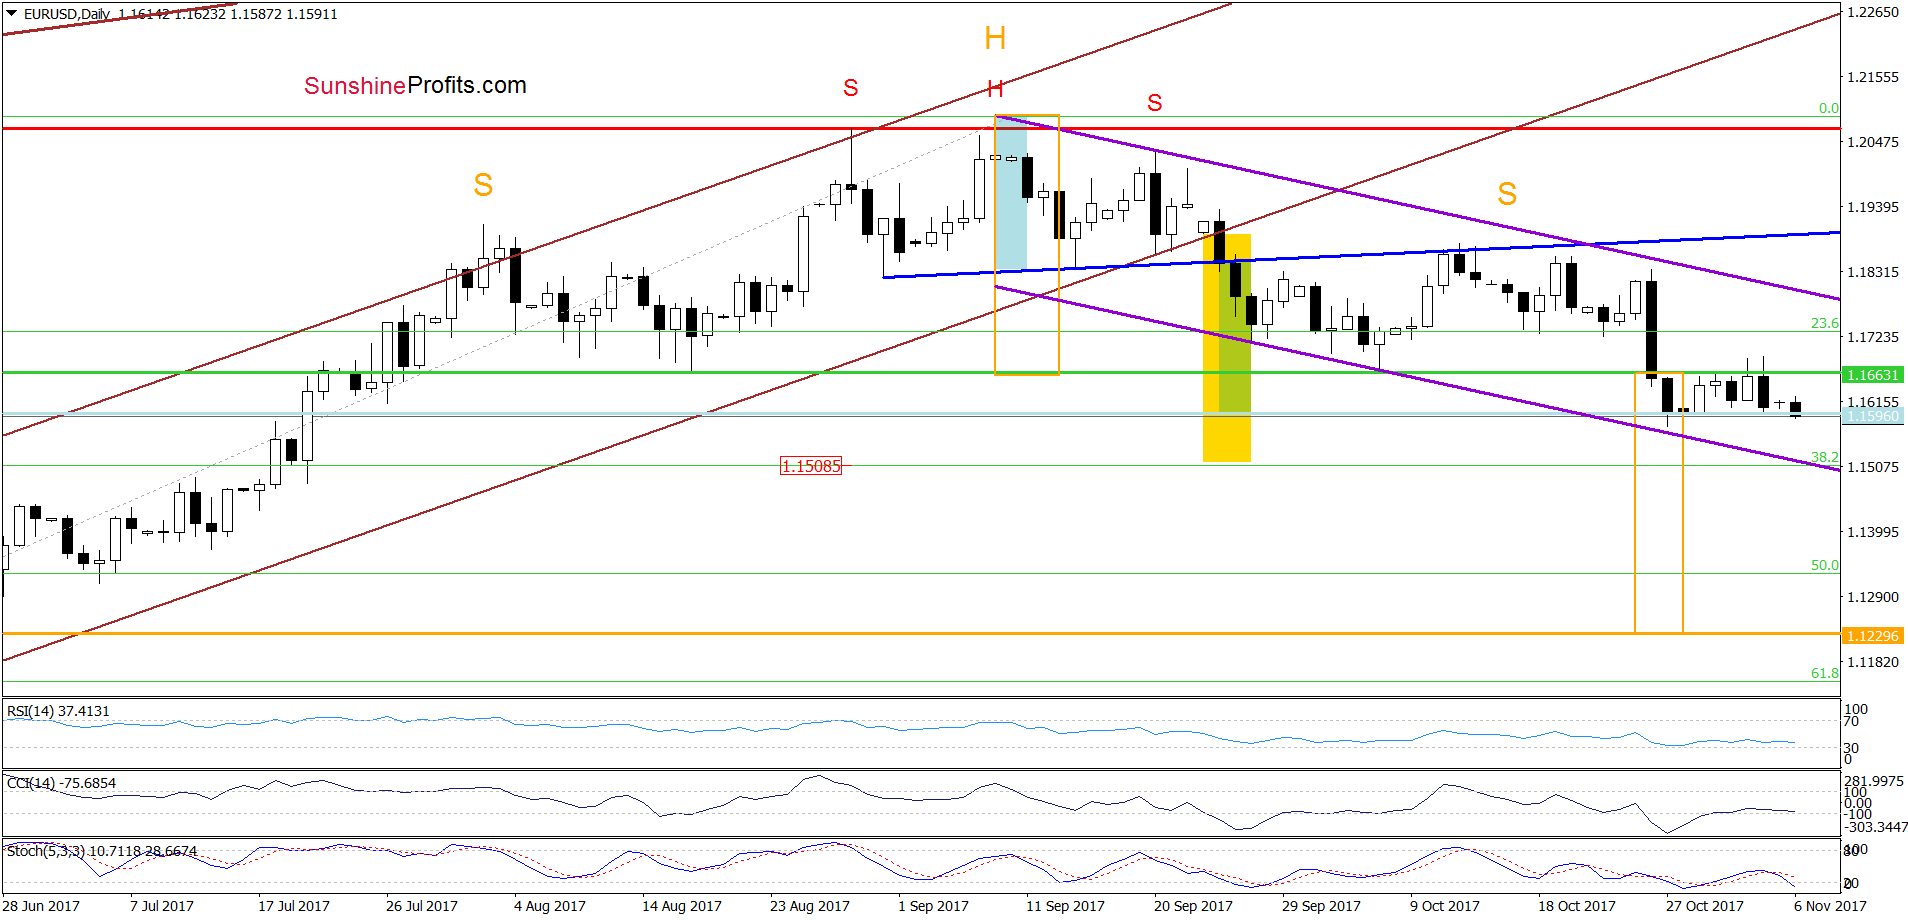
(…) EUR/USD wavers in a narrow range around the green horizontal line (…) in our opinion, as long as there is no daily closure above this resistance all upswings could be nothing more than verifications of the earlier breakdown below this line.
What does it mean for the exchange rate? In our opinion, if this is the case and EUR/USD reverses from current levels in the near future, currency bears will likely not only test the recent lows, but also push the exchange rate to around 1.1508, where the size of declines will be equal to the height of the brown rising trend channel. Additionally, slightly below this level is also the 38.2% Fibonacci retracement, which increases the probability of reversal.
From today’s point of view, we see that the situation developed in line with the above scenario and EUR/USD declined on Friday, invalidating the tiny move above the green horizontal line. In this way, the exchange rate verified the earlier breakdown under this important line (this is a neck line of a bigger hear and shoulders pattern), which suggests further deterioration and a realization of our Friday scenario in the very near future.
Very short-term outlook: mixed with bearish bias
Short-term outlook: bearish
MT outlook: mixed
LT outlook: mixed
Trading position (short-term; our opinion): Profitable short positions (with a stop-loss order at 1.2250 and the initial downside target at 1.1510) are justified from the risk/reward perspective. We will keep you informed should anything change, or should we see a confirmation/invalidation of the above.
USD/JPY
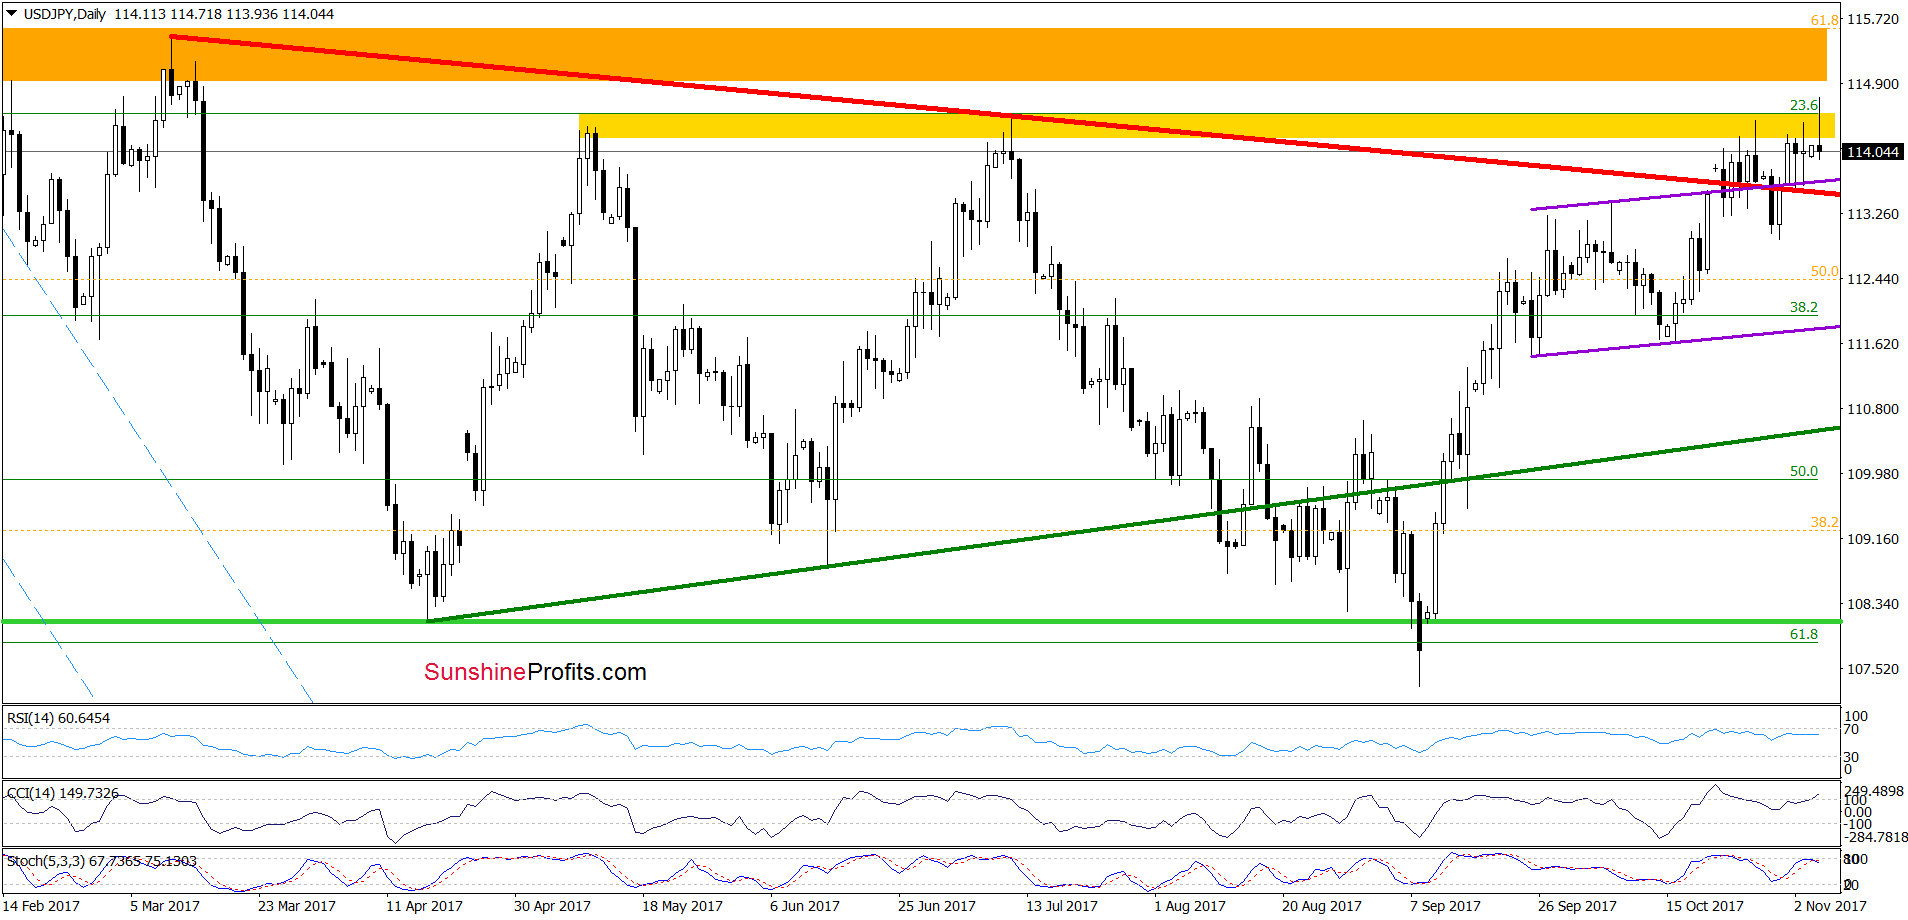
The first thing that catches the eye on the daily chart is an invalidation of the breakdown under the upper border of the purple rising trend channel and the long-term red declining resistance line. This positive event triggered further improvement and a re-test of the yellow resistance zone.
Despite this improvement, the above-mentioned area stopped currency bulls, triggering a pullback, which took USD/JPY under the May and July peaks. Such price action suggests an invalidation of the tiny breakout above these highs, which could translate into a bigger move to the downside – especially when we factor in the medium-term picture.
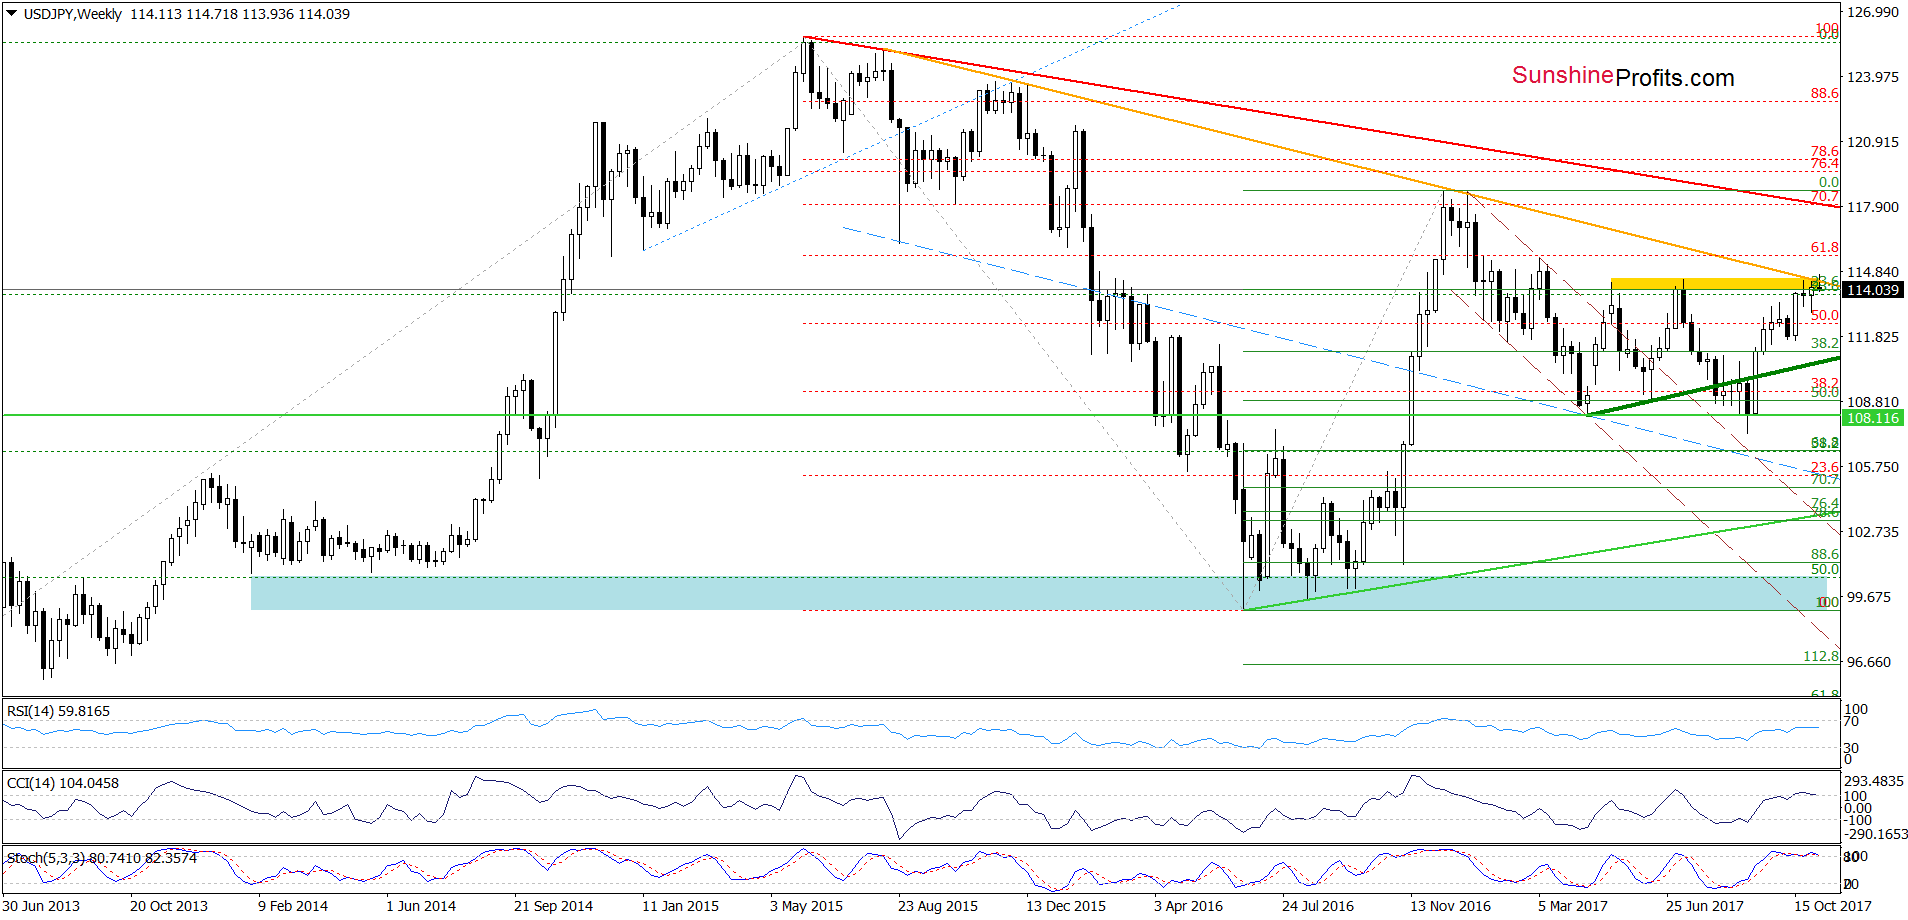
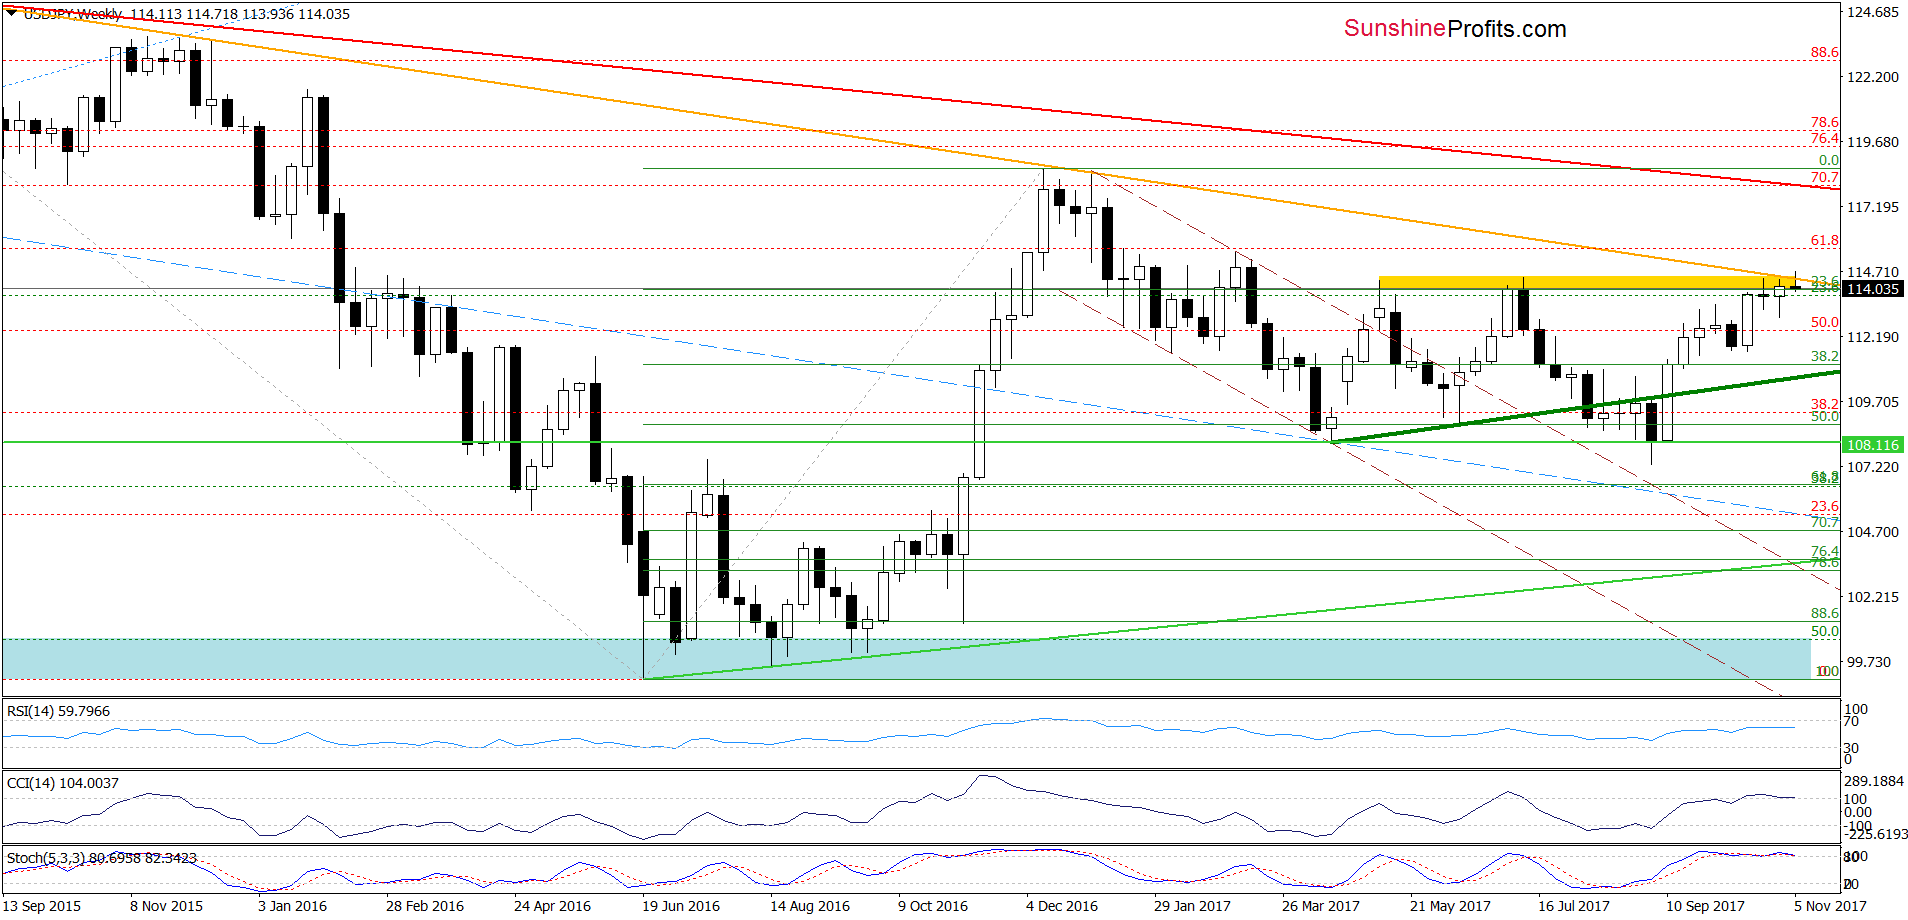
From this perspective, we see that USD/JPY increased to the long-term orange declining resistance line. As you see on the weekly chart, it was strong enough to stop currency bulls in December 2016 and January 2017, which suggests that history may repeat itself once again and we could see another reversal and declines in the following week(s). Nevertheless, this scenario will be more likely and reliable if the exchange rate closes one of the following sessions under the upper border of the purple rising trend channel and the long-term red declining resistance line seen on the daily chart. Until this time, one more attempt to break above the yellow resistance zone can’t be ruled out.
Very short-term outlook: mixed
Short-term outlook: mixed with bearish bias
MT outlook: mixed
LT outlook: mixed
Trading position (short-term; our opinion): No positions are justified from the risk/reward perspective at the moment. We will keep you informed should anything change, or should we see a confirmation/invalidation of the above.
USD/CAD
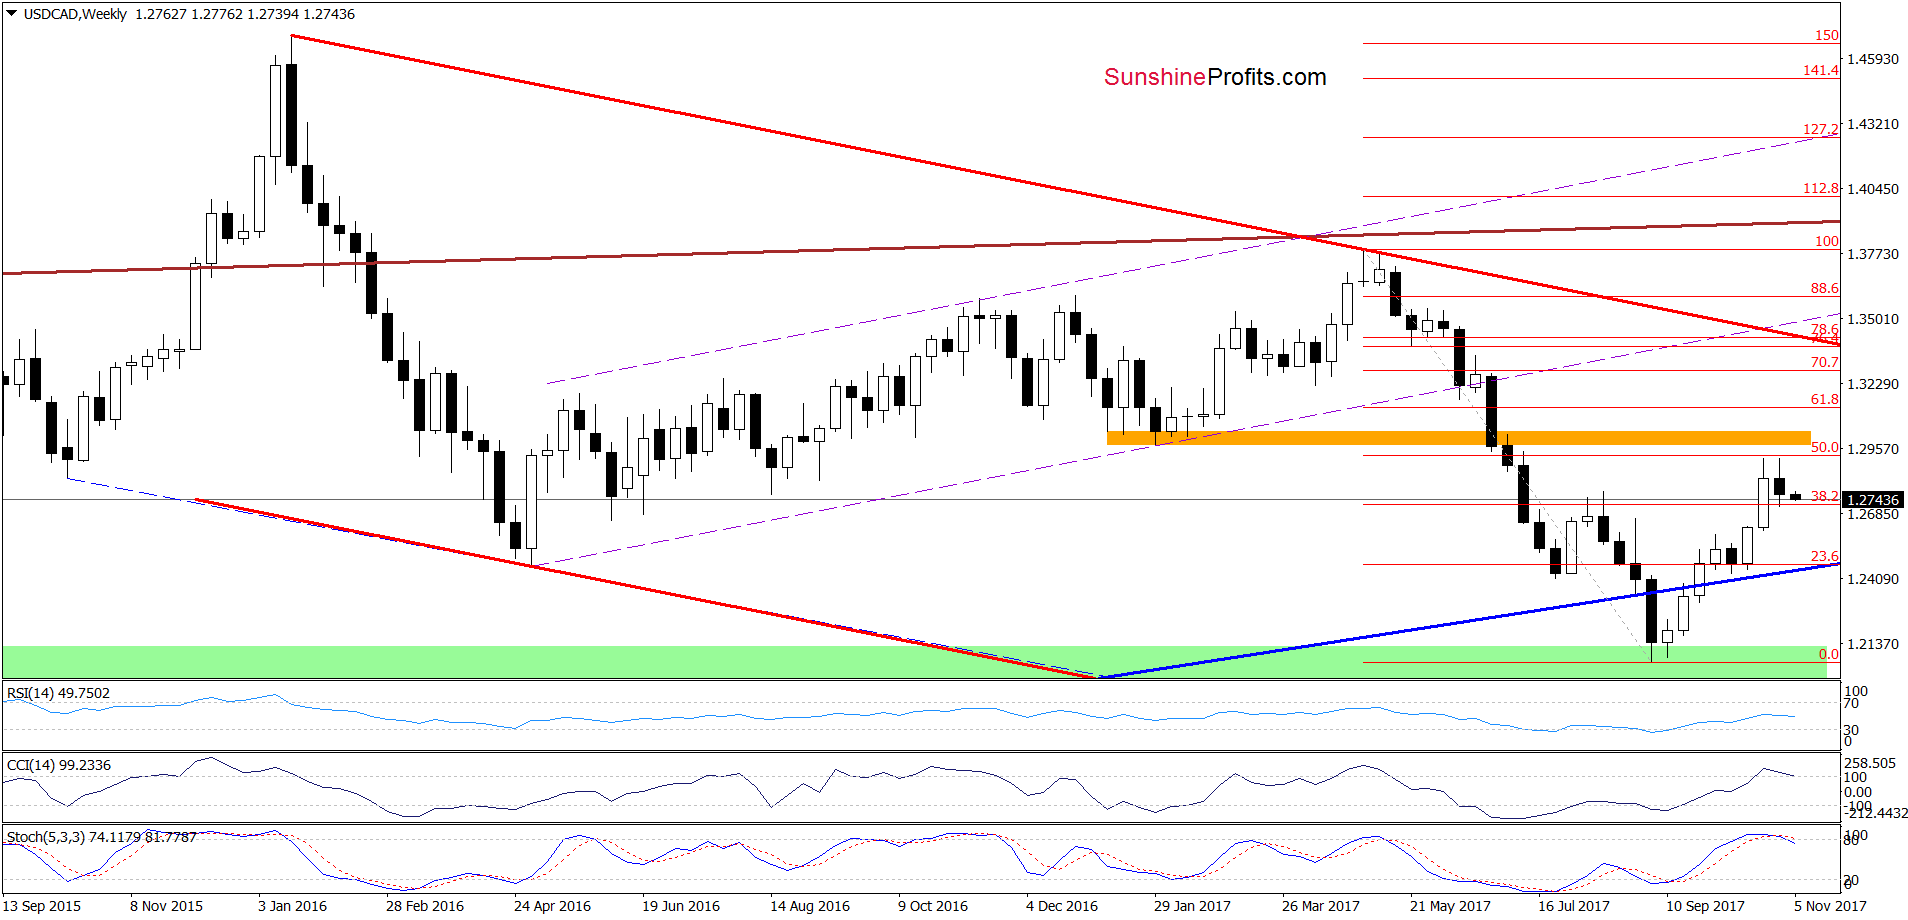
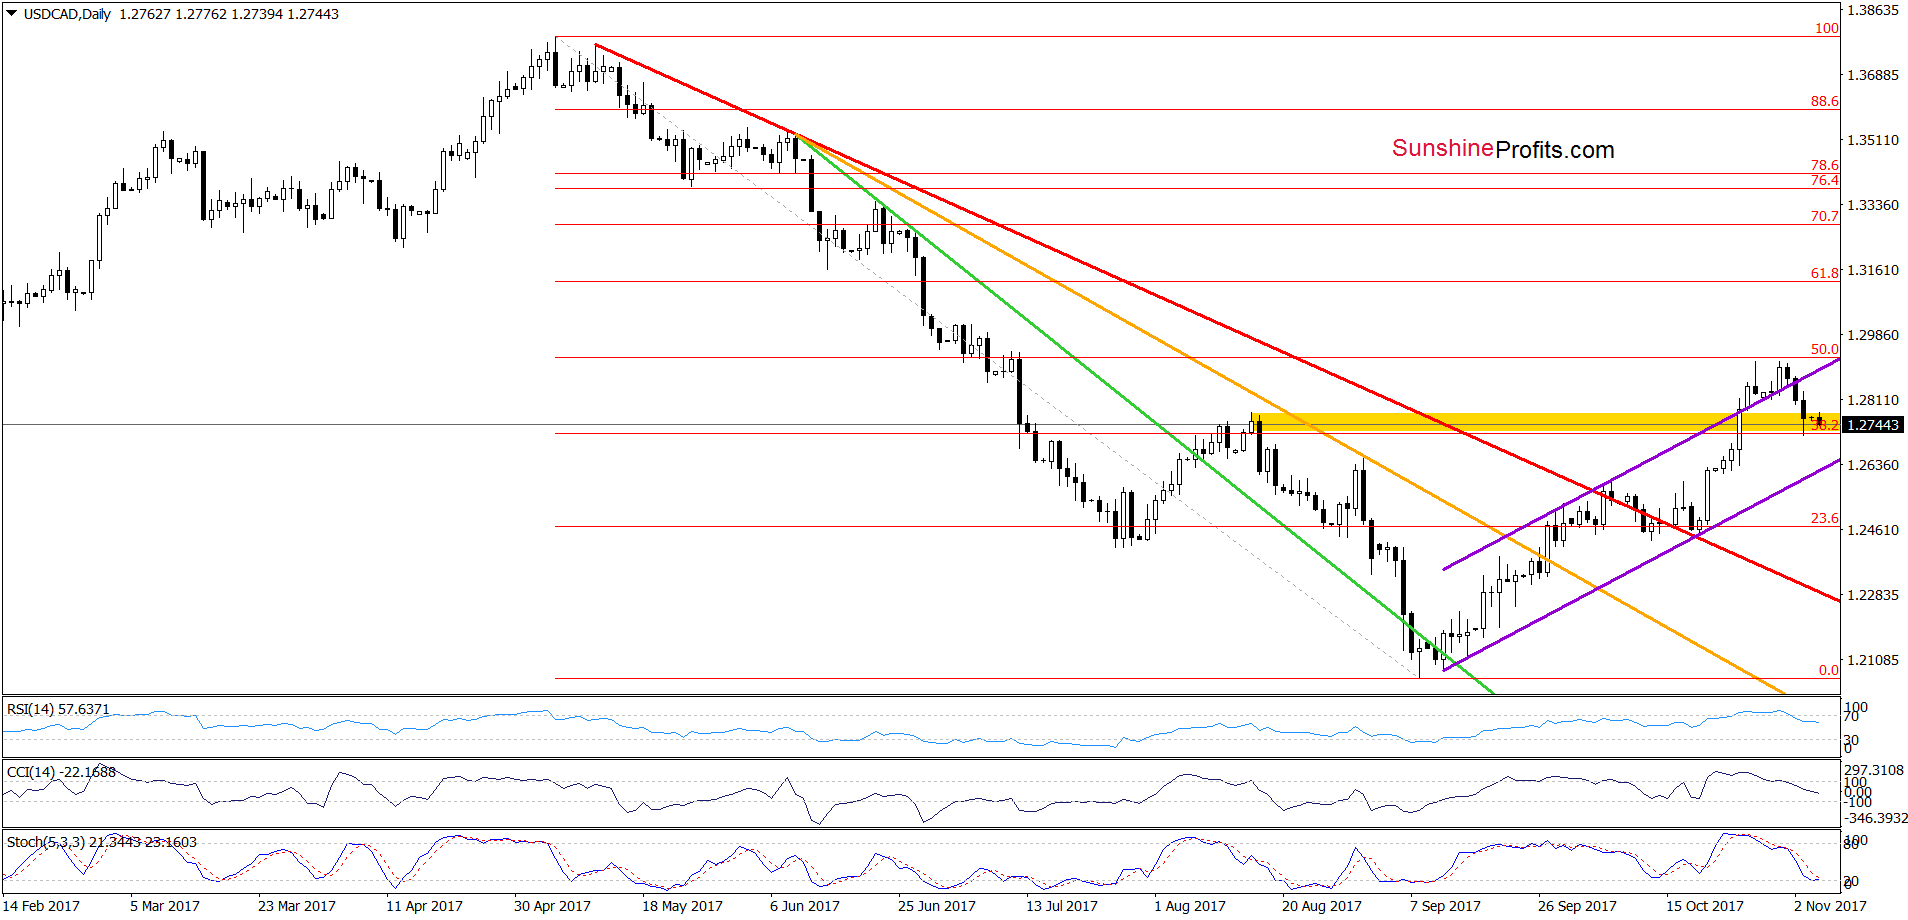
Looking at the daily chart, we see that an invalidation of the breakout above the upper border of the purple rising trend channel together with the sell signals generated by the indicators encouraged currency bears to act. As a result, the exchange rate extended losses and dropped to the previously-broken yellow zone created by the mid-August highs and the 38.2% Fibonacci retracement.
What’s next for USD/CAD? Taking into account the lack of the buy signals generated by the indicators, it seems that the pair will extend declines and test the lower border of the purple rising trend channel in the following days. Nevertheless, such price action will be likely only if the exchange rate drops under the 38.2% Fibonacci retracement.
Very short-term outlook: mixed with bearish bias
Short-term outlook: mixed
MT outlook: mixed
LT outlook: mixed
Trading position (short-term; our opinion): No positions are justified from the risk/reward perspective at the moment. We will keep you informed should anything change, or should we see a confirmation/invalidation of the above.
Thank you.
Nadia Simmons
Forex & Oil Trading Strategist
Przemyslaw Radomski, CFA
Founder, Editor-in-chief, Gold & Silver Fund Manager
Gold & Silver Trading Alerts
Forex Trading Alerts
Oil Investment Updates
Oil Trading Alerts

