

Earlier today, the euro moved higher against the greenback, which resulted in a comeback above the previously-broken resistance line. Is this a show of currency bulls’ strength or rather a pause before another bigger move to the downside?
In our opinion the following forex trading positions are justified - summary:
- EUR/USD: short (a stop-loss order at 1.2568; the initial downside target at 1.2173)
- GBP/USD: short (a stop-loss order at 1.4480; the initial downside target at 1.3851)
- USD/JPY: none
- USD/CAD: short (a stop-loss order at 1.3221; the next downside target at 1.2790)
- USD/CHF: long (a stop-loss order at 0.9329; the initial upside target at 0.9736)
- AUD/USD: none
EUR/USD
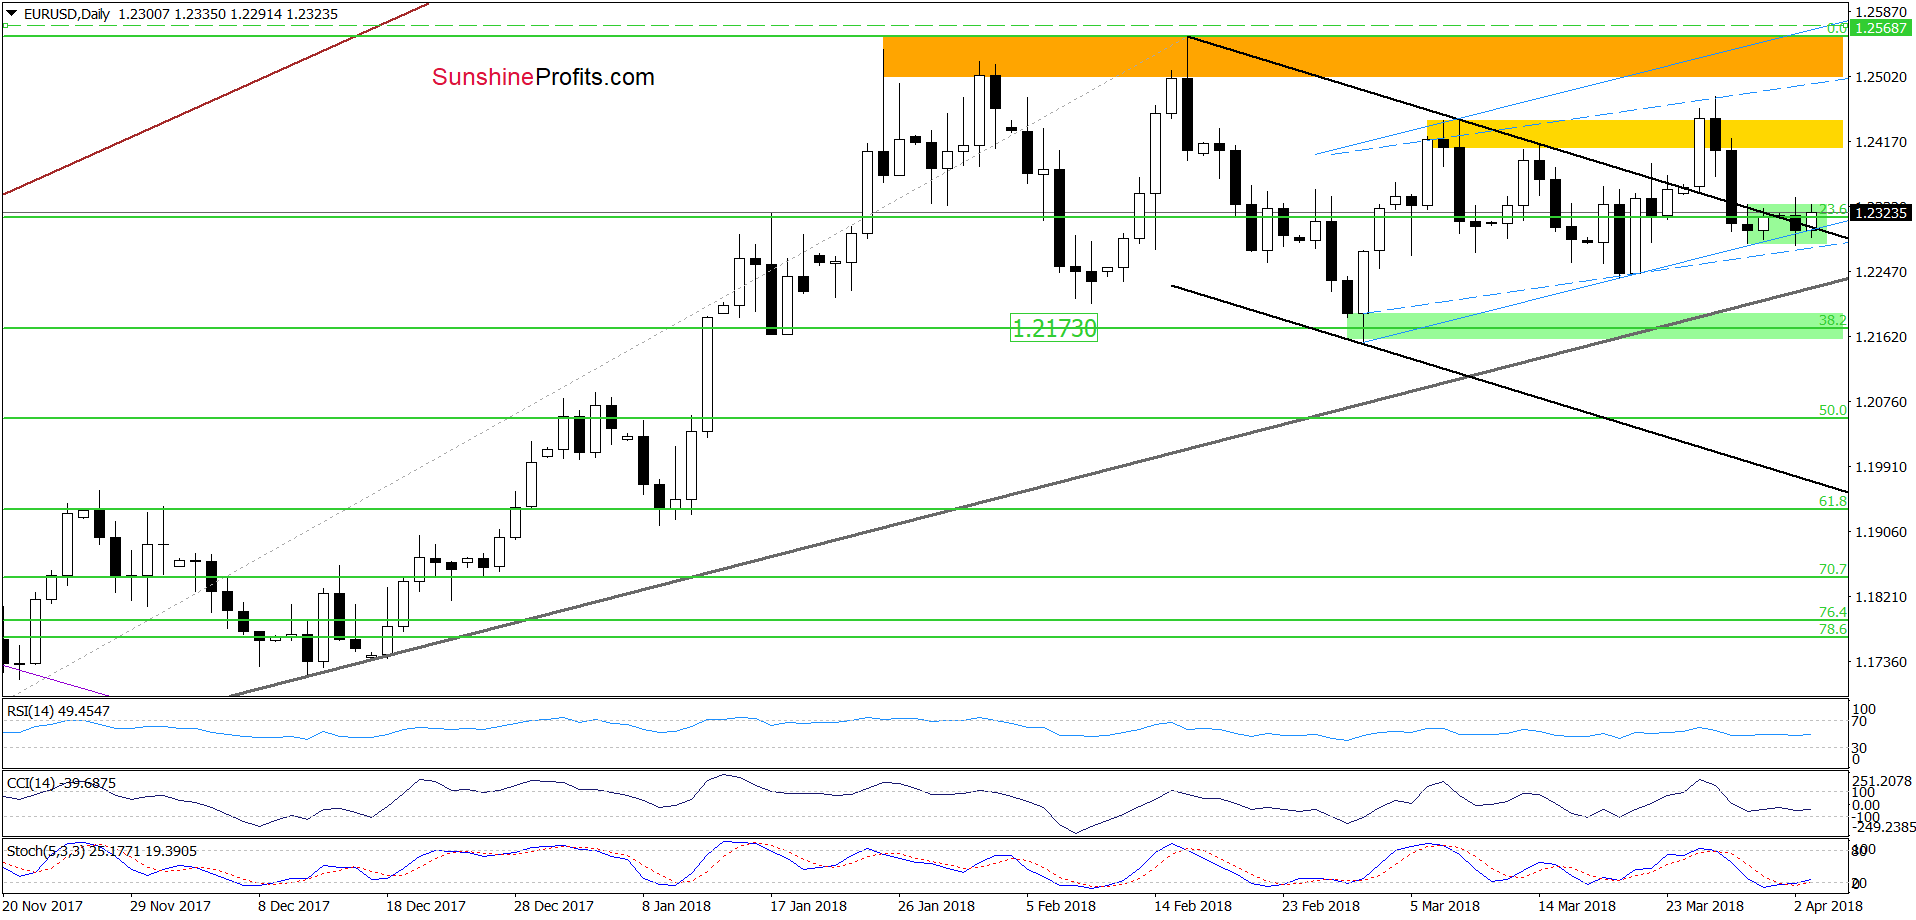
Looking at the daily chart, we see that although EUR/USD came back above the previously-broken upper border of the black declining trend channel, the pair is still trading inside the green consolidation slightly below the 23.6% Fibonacci retracement.
What does it mean for the exchange rate? In our opinion, as long as there is no daily closure above the upper line of the formation and the black support/resistance line another move to the downside and a test of the green support zone is likely.
Trading position (short-term; our opinion): Short positions (with a stop-loss order at 1.2568 and the initial downside target at 1.2173) are justified from the risk/reward perspective. We will keep you informed should anything change, or should we see a confirmation/invalidation of the above.
GBP/USD
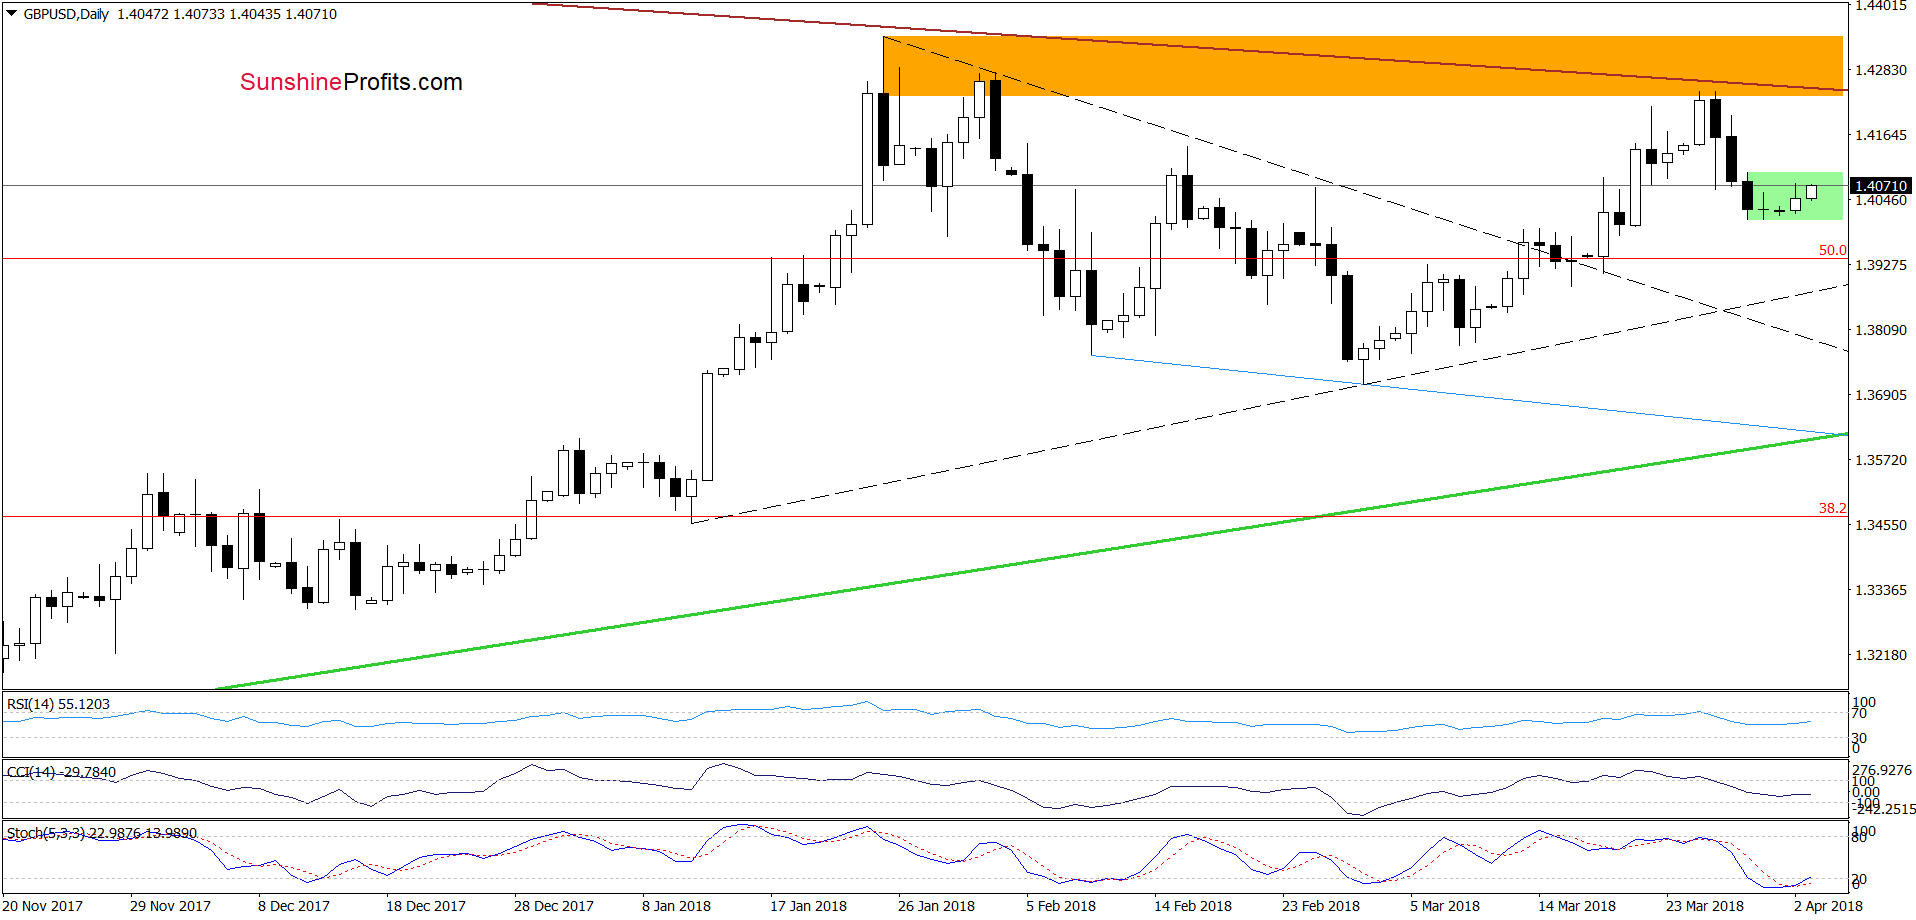
From today’s point of view, we see that the current situation looks quite similar to what we already saw in the case of EUR/USD as GBP/USD is also trading in the narrow green consolidation.
As you see on the daily chart, the size of rebound is quite small compared to the earlier decline (at the moment of writing these words), which suggests that anther attempt to move lower may be just around the corner.
If this is the case and the exchange rate reverses and declines from here, the pair will test the lower border of the black triangle (marked with dashed lines on the daily chart) in the coming days (currently at 1.3872).
Trading position (short-term; our opinion): Short positions with the stop-loss order at 1.4480 and the initial downside target at 1.3851 are justified from the risk/reward perspective. We will keep you informed should anything change, or should we see a confirmation/invalidation of the above.
AUD/USD
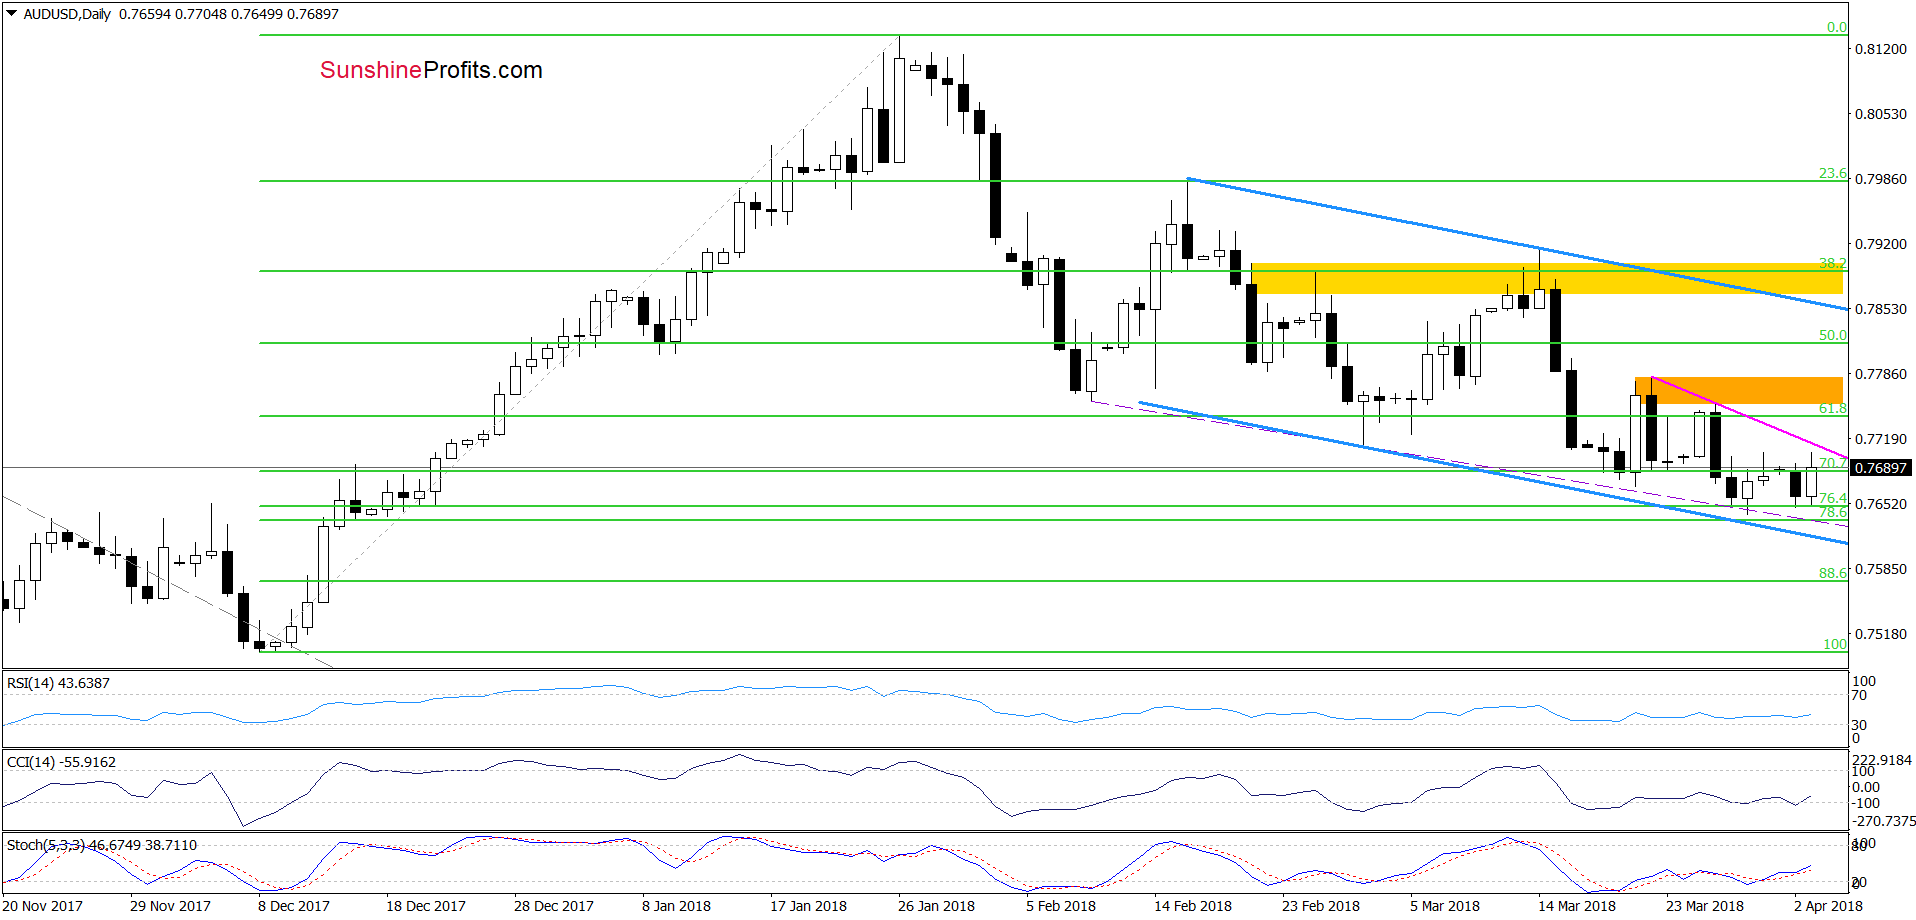
Looking at the daily chart, we see that the major short-term supports (two Fibonacci retracements, the lower border of the blue declining trend channel and the purple dashed line based on the previous lows) continue to keep declines in check.
Earlier today, AUD/USD moved visibly higher, but as long as there is no breakout above the pink declining resistance line based on the previous highs, we think that further improvement is not likely to be seen. Nevertheless, if currency bulls use buy signals generated by the daily indicators and push the pair above this line, the way to the orange resistance zone will be open.
Trading position (short-term; our opinion): No positions are justified from the risk/reward perspective. We will keep you informed should anything change, or should we see a confirmation/invalidation of the above.
Thank you.
Nadia Simmons
Forex & Oil Trading Strategist
Przemyslaw Radomski, CFA
Founder, Editor-in-chief, Gold & Silver Fund Manager
Gold & Silver Trading Alerts
Forex Trading Alerts
Oil Investment Updates
Oil Trading Alerts

