

Yesterday’s session took EUR/USD above the upper line of the short-term declining trend channel. Earlier today, currency bulls went even higher, breaking above the upper line of the consolidation. But is everything as positive as it might seem at the first glance?
- EUR/USD: short (a stop-loss order at 1.1878; the initial downside target at 1.1343)
- GBP/USD: short (a stop-loss order at 1.3377; the initial downside target at 1.2923)
- USD/JPY: none
- USD/CAD: none
- USD/CHF: none
- AUD/USD: none
EUR/USD
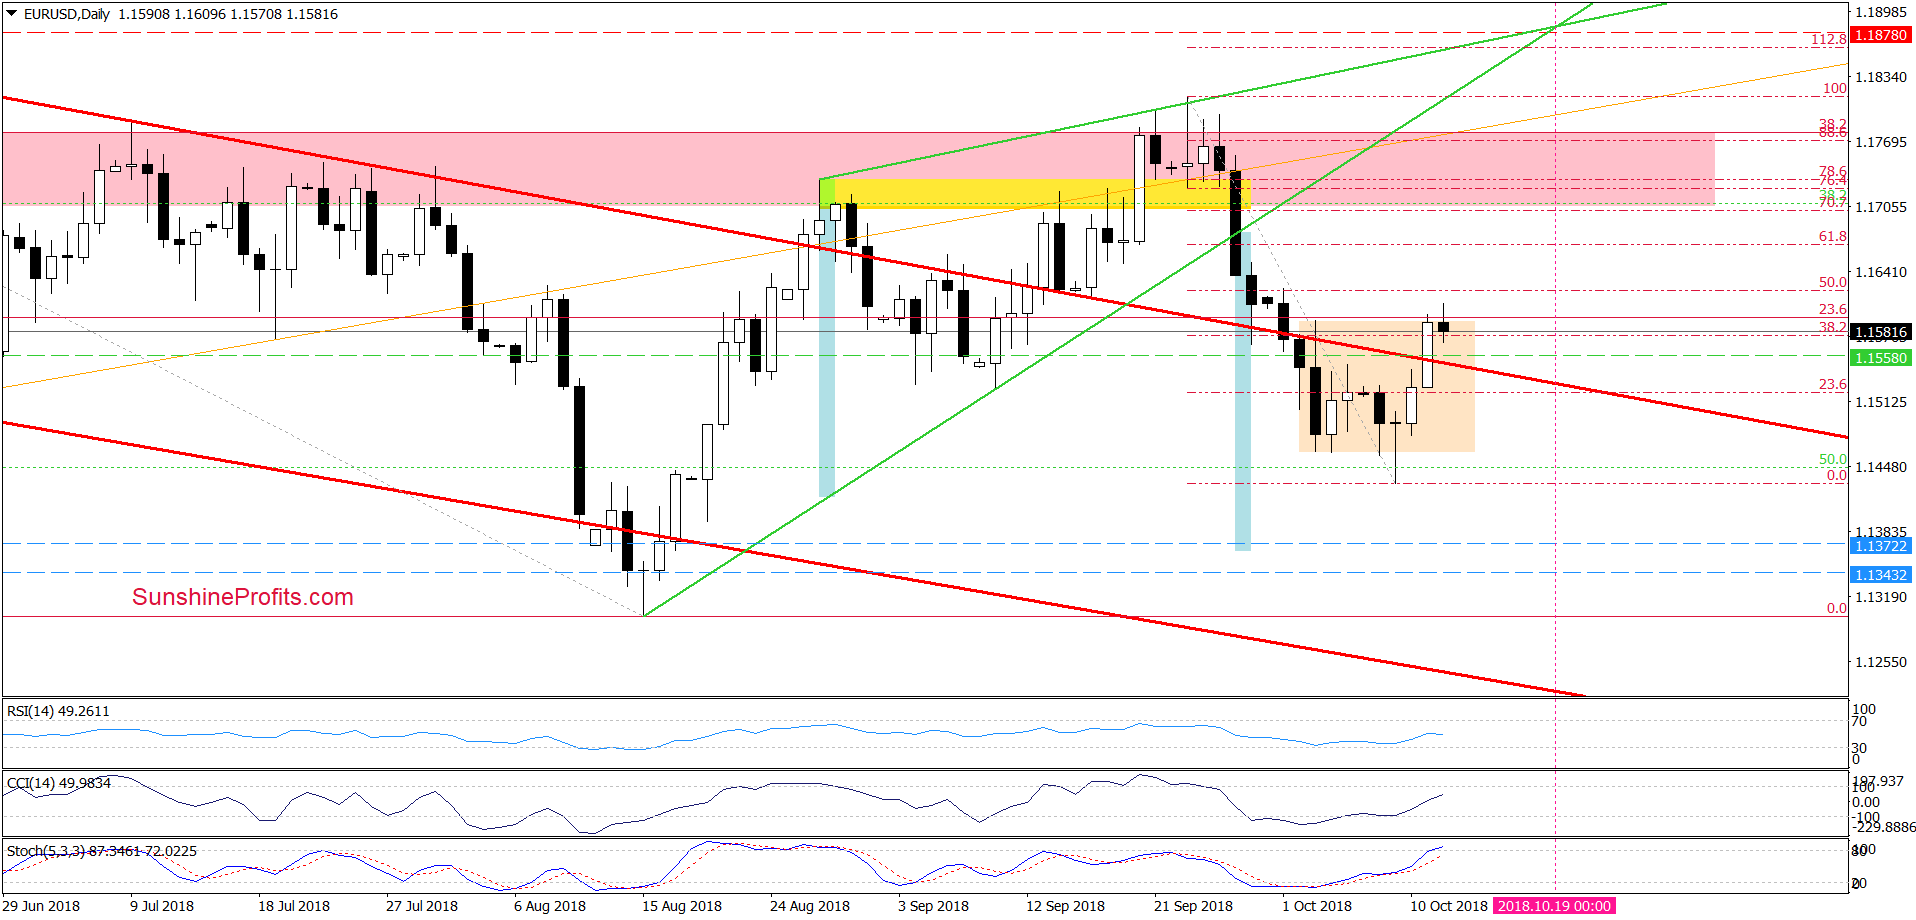
Looking at the daily chart, we see that although EUR/USD broke above the upper border of the red declining trend channel during yesterday’s session, currency bulls didn’t manage to close the day above the upper line of the consolidation.
Earlier today, they tried to go higher once again, buy they failed, which resulted in a pullback and an invalidation of the earlier tiny breakout above the consolidation. Such price action doesn’t confirm the buyers’ strength and suggests that further deterioration is just around the corner.
If the situation develops in line with the above assumption, the pair will also invalidate yesterday’s breakout above the upper border of the red declining trend channel in the very near future (maybe even later in the day).
Therefore, we think that short positions continue to be justified from the risk/reward perspective as a next bigger move to the downside is ahead of us. We will keep you informed should anything change, or should we see a confirmation/invalidation of the above.
Trading position (short-term; our opinion): Short positions with a stop-loss order at 1.1878 and the initial downside target at 1.1343 are justified from the risk/reward perspective.
USD/JPY
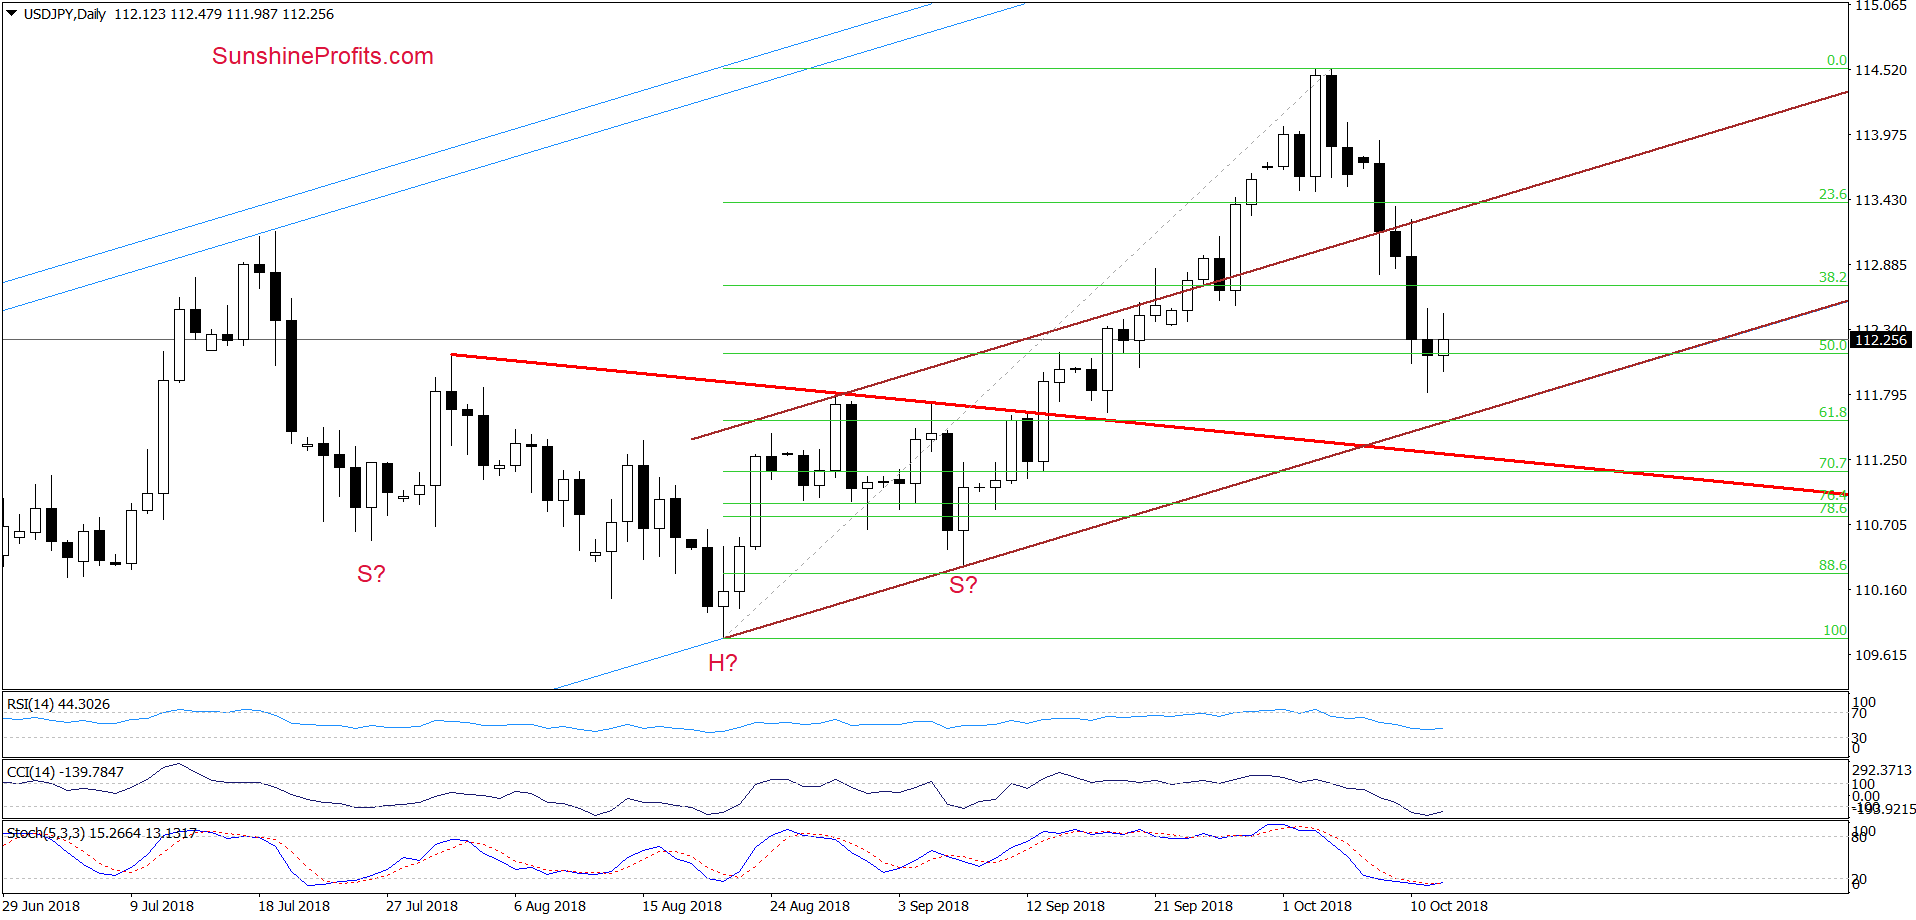
From today’s point of view, we see that USD/JPY extended the recent correction since our last commentary on this currency pair was posted. As a result, the pair declined to the 50% Fibonacci retracement and closed yesterday’s session slightly below it.
Despite this deterioration, currency bulls pushed the exchange rate a bit higher earlier today, which caused an invalidation of this small breakdown. Additionally, the CCI and the Stochastic Oscillator are extremely oversold, which increases the probability of buy signals in the following day(s).
Nevertheless, in our opinion, further improvement will be more reliable if the pair closes today’s session above the retracement and the indicators really generate signals. Until this time, one more downswing and a test of the lower border of the brown rising trend channel and the 61.8% Fibonacci retracement can’t be ruled out.
Trading position (short-term; our opinion): No positions are justified from the risk/reward perspective.
USD/CAD
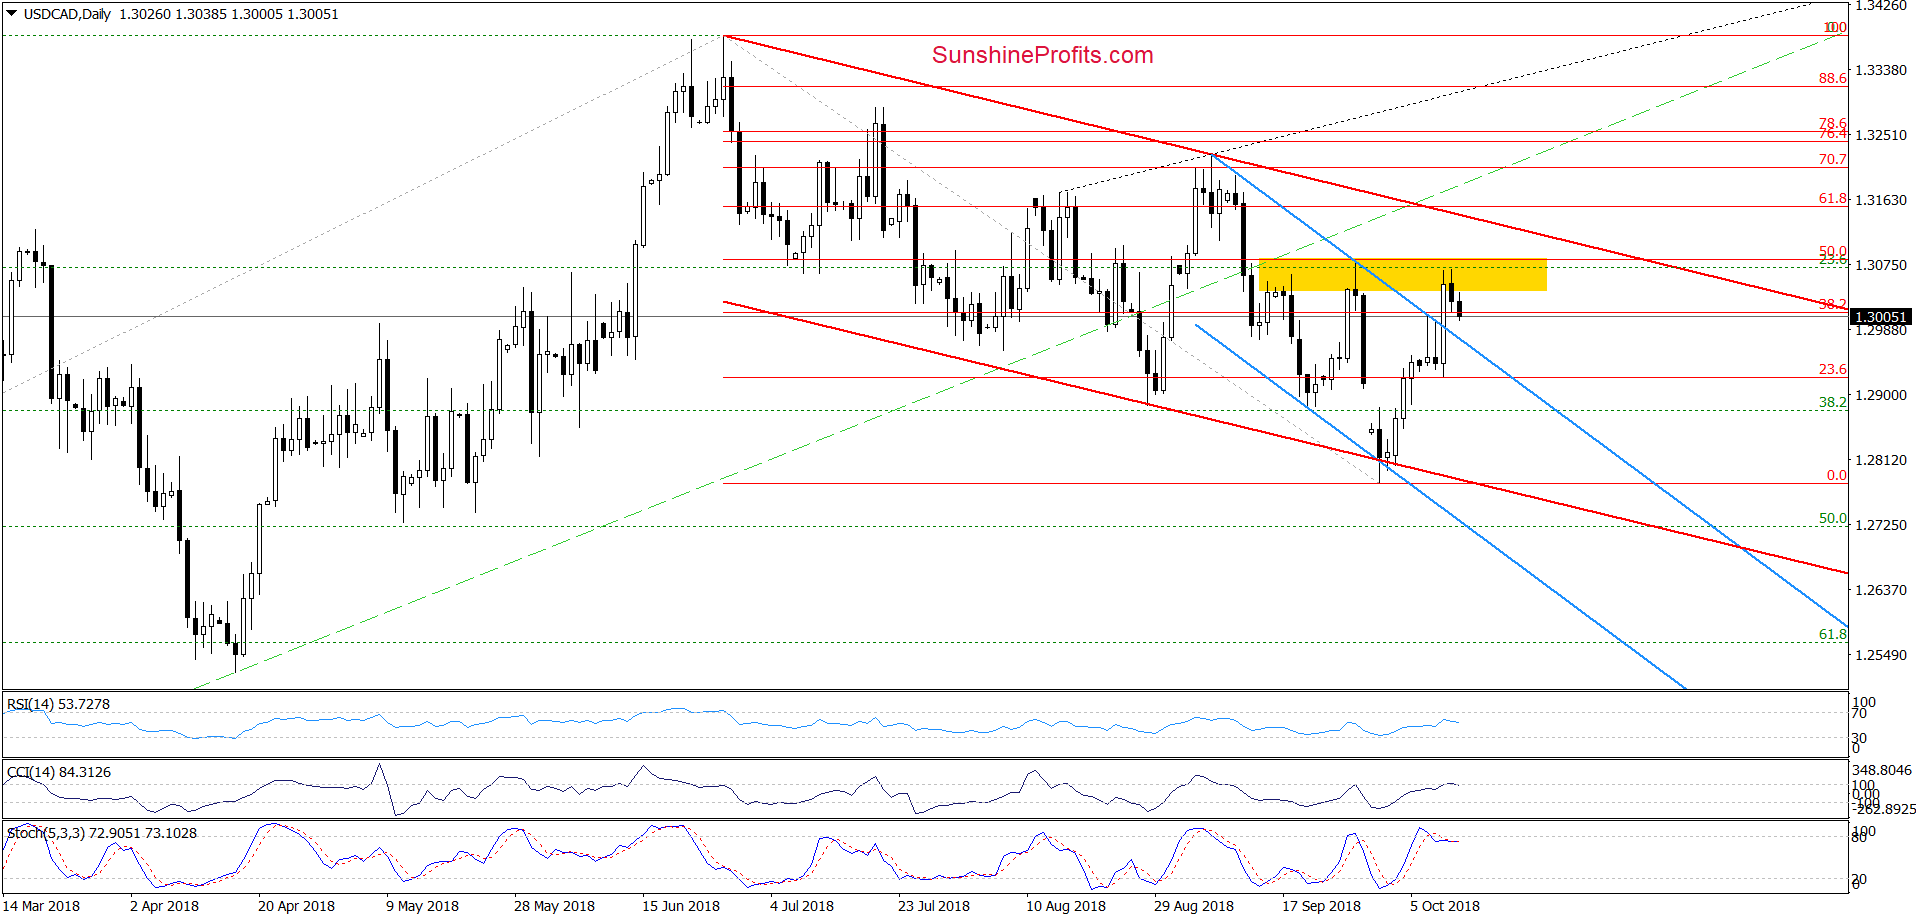
On Wednesday, USD/CAD broke above the upper border of the blue declining trend channel, which triggered a climb to the yellow resistance zone created by the peaks formed in the second half of September and the 50% Fibonacci retracement (based on the entire June-October decline).
As you see on the chart, this area stopped further improvement and the exchange rate pulled back, which in combination with the sell signals generated by the daily indicators suggests that we’ll likely see (at least) a test of the previously-broken upper line of the blue rising trend channel in the coming day(s).
If this is the case and we see currency bulls’ weakness in this area, the exchange rate will likely test Wednesday’s low and we’ll consider opening short positions. We will keep you informed should anything change, or should we see a confirmation/invalidation of the above.
Trading position (short-term; our opinion): No positions are justified from the risk/reward perspective.
Thank you.
Nadia Simmons
Forex & Oil Trading Strategist
Przemyslaw Radomski, CFA
Founder, Editor-in-chief, Gold & Silver Fund Manager
Gold & Silver Trading Alerts
Forex Trading Alerts
Oil Investment Updates
Oil Trading Alerts

