

The beginning of the month wasn’t good for currency bulls as the euro extended losses against the greenback. Thanks to the sellers’ attack EUR/USD slipped to the levels that we didn’t see since late December. Is the worst already behind the buyers?
In our opinion the following forex trading positions are justified - summary:
EUR/USD
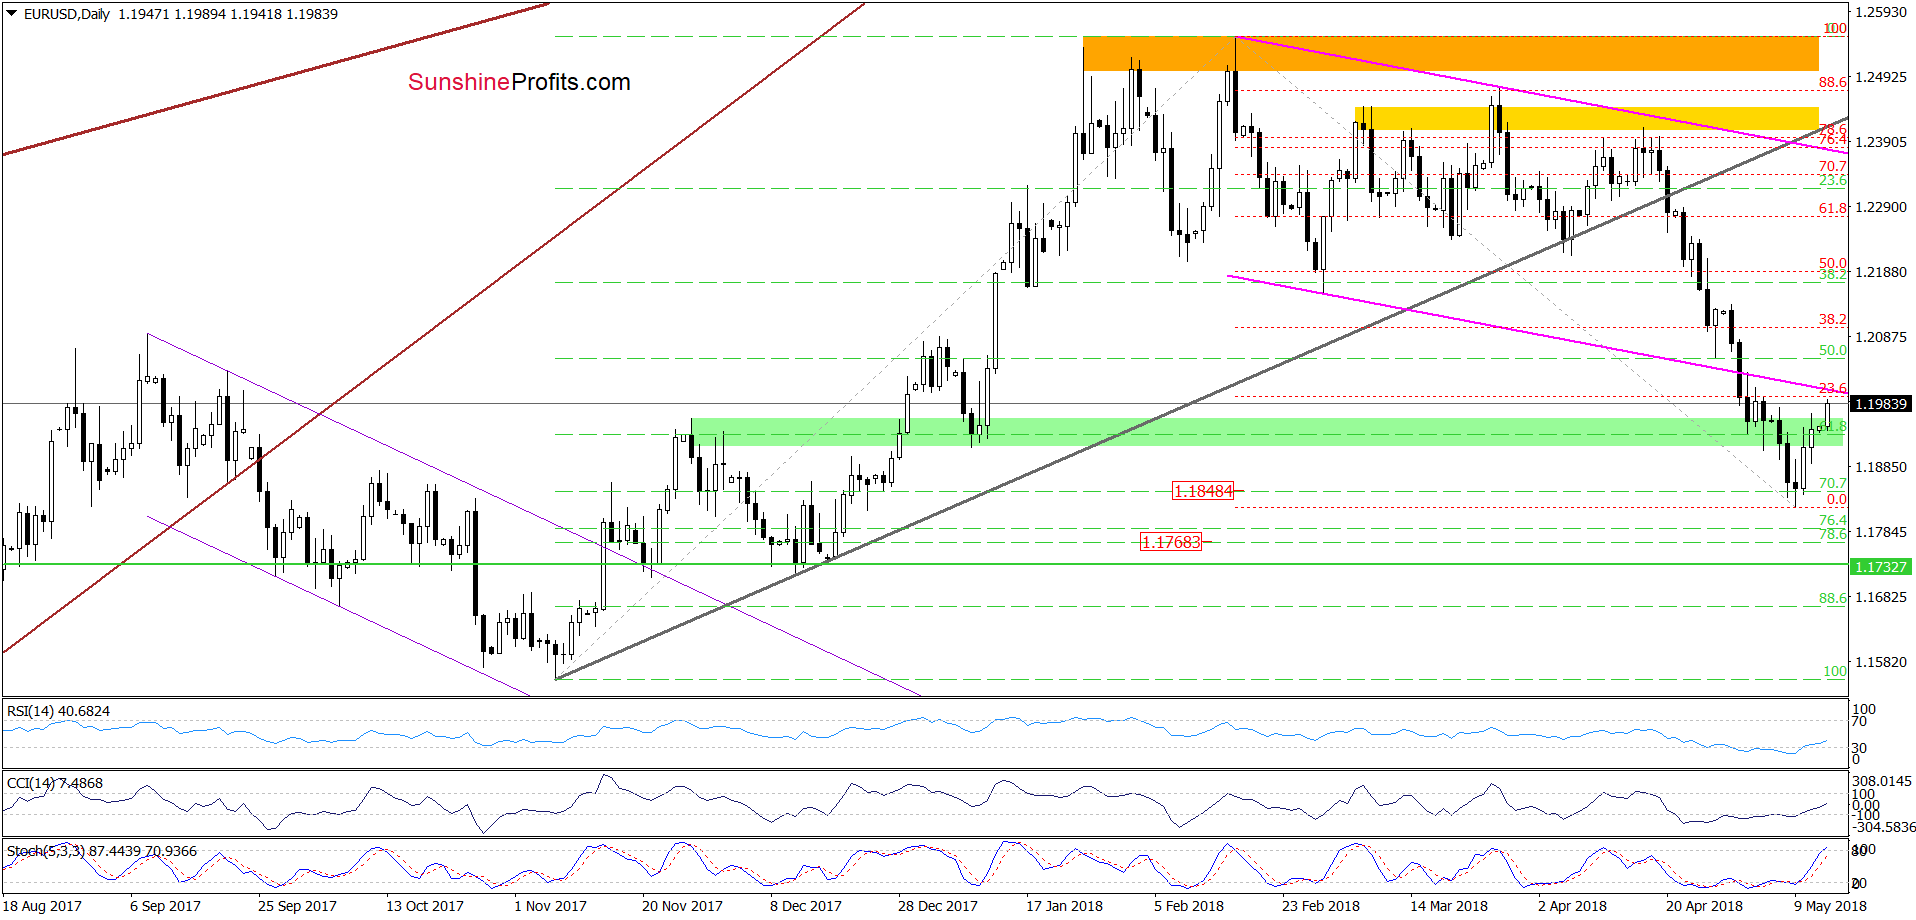
Earlier today, EUR/USD extended Friday’s gains, but despite this move, the exchange rate is still trading under the previously-broken lower border of the pink declining trend channel. Additionally, the size of rebound is tiny (compared to the entire downward move that started in mid-February) as the pair didn’t even erased 23.6% of the earlier declines. These facts do not confirm currency bulls’ strength (at least at the moment of writing these words), which means that waiting at the sidelines for more reliable signs is justified from the risk/reward perspective.
Nevertheless, if we see an invalidation of the earlier breakdown below the lower line of the pink trend channel, we’ll consider going long. Stay tuned.
Trading position (short-term; our opinion): No positions are justified from the risk/reward perspective. We will keep you informed should anything change, or should we see a confirmation/invalidation of the above.
USD/CAD
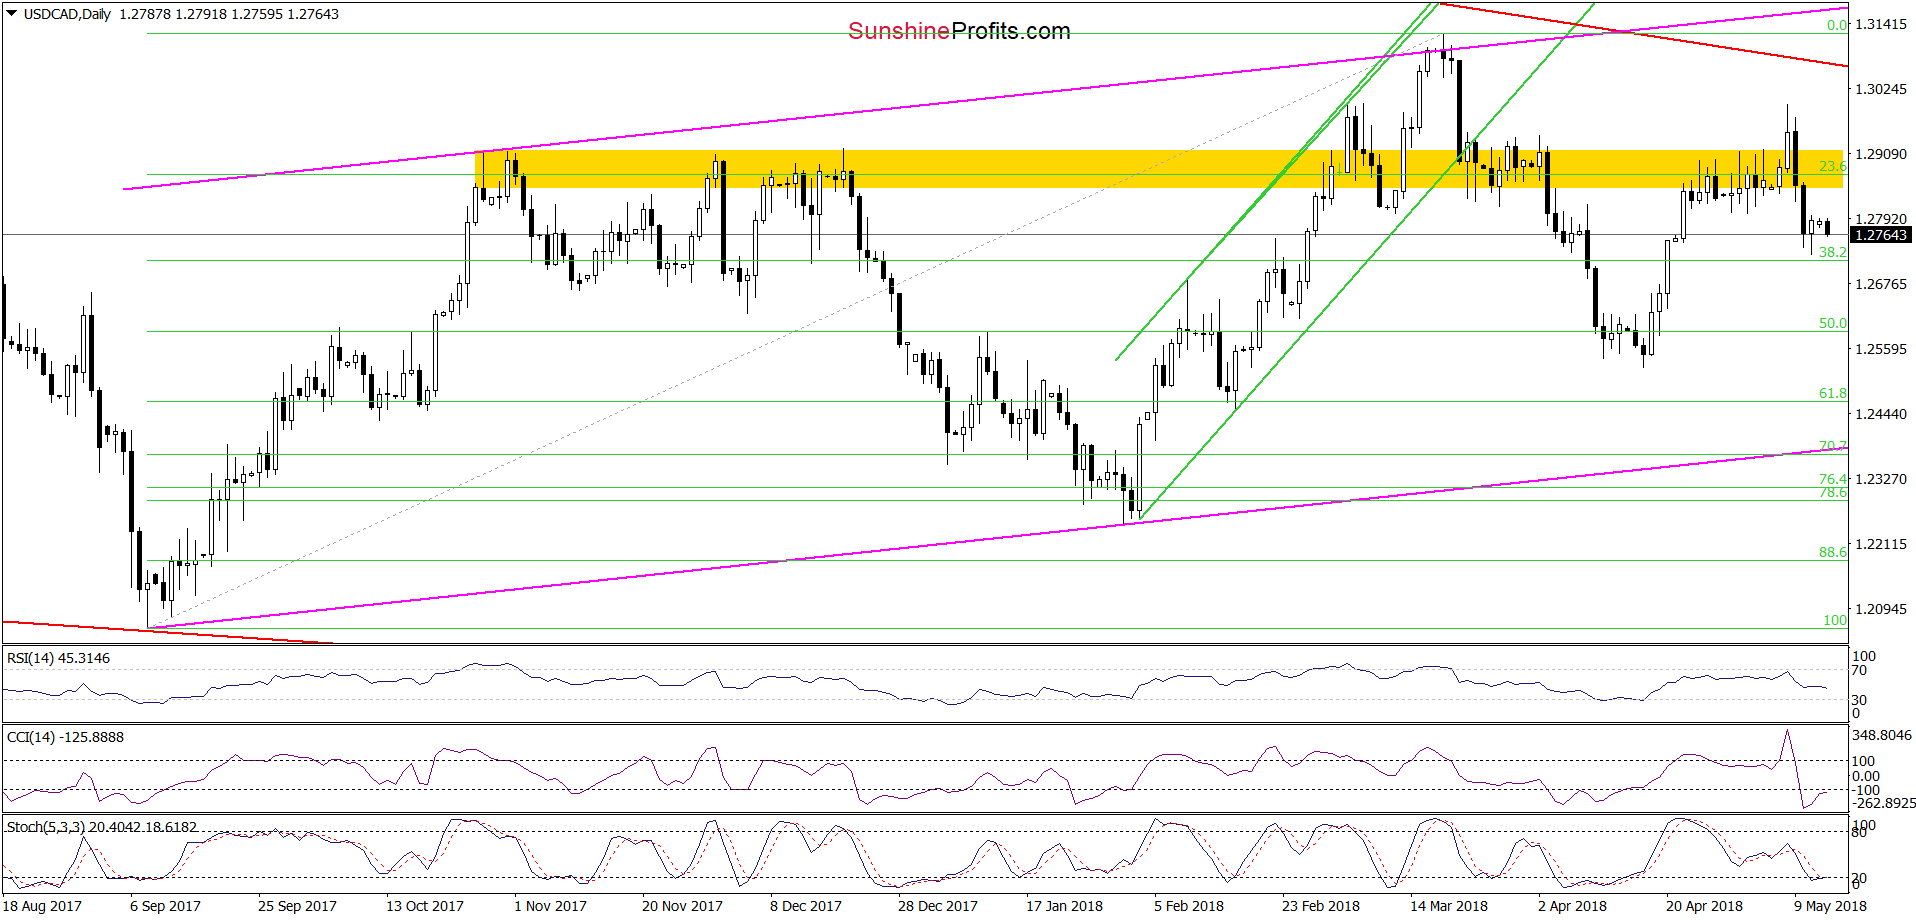
Although currency bulls pushed USD/CAD above the yellow resistance zone in the previous week, they didn’t manage to hold gained levels. As a result, the pair pulled back, which invalidated the earlier breakout and encouraged their opponents to act. Thanks to their attack the exchange rate erased 50% of the upward move from the second half of April and beginning of May at the end of the previous week.
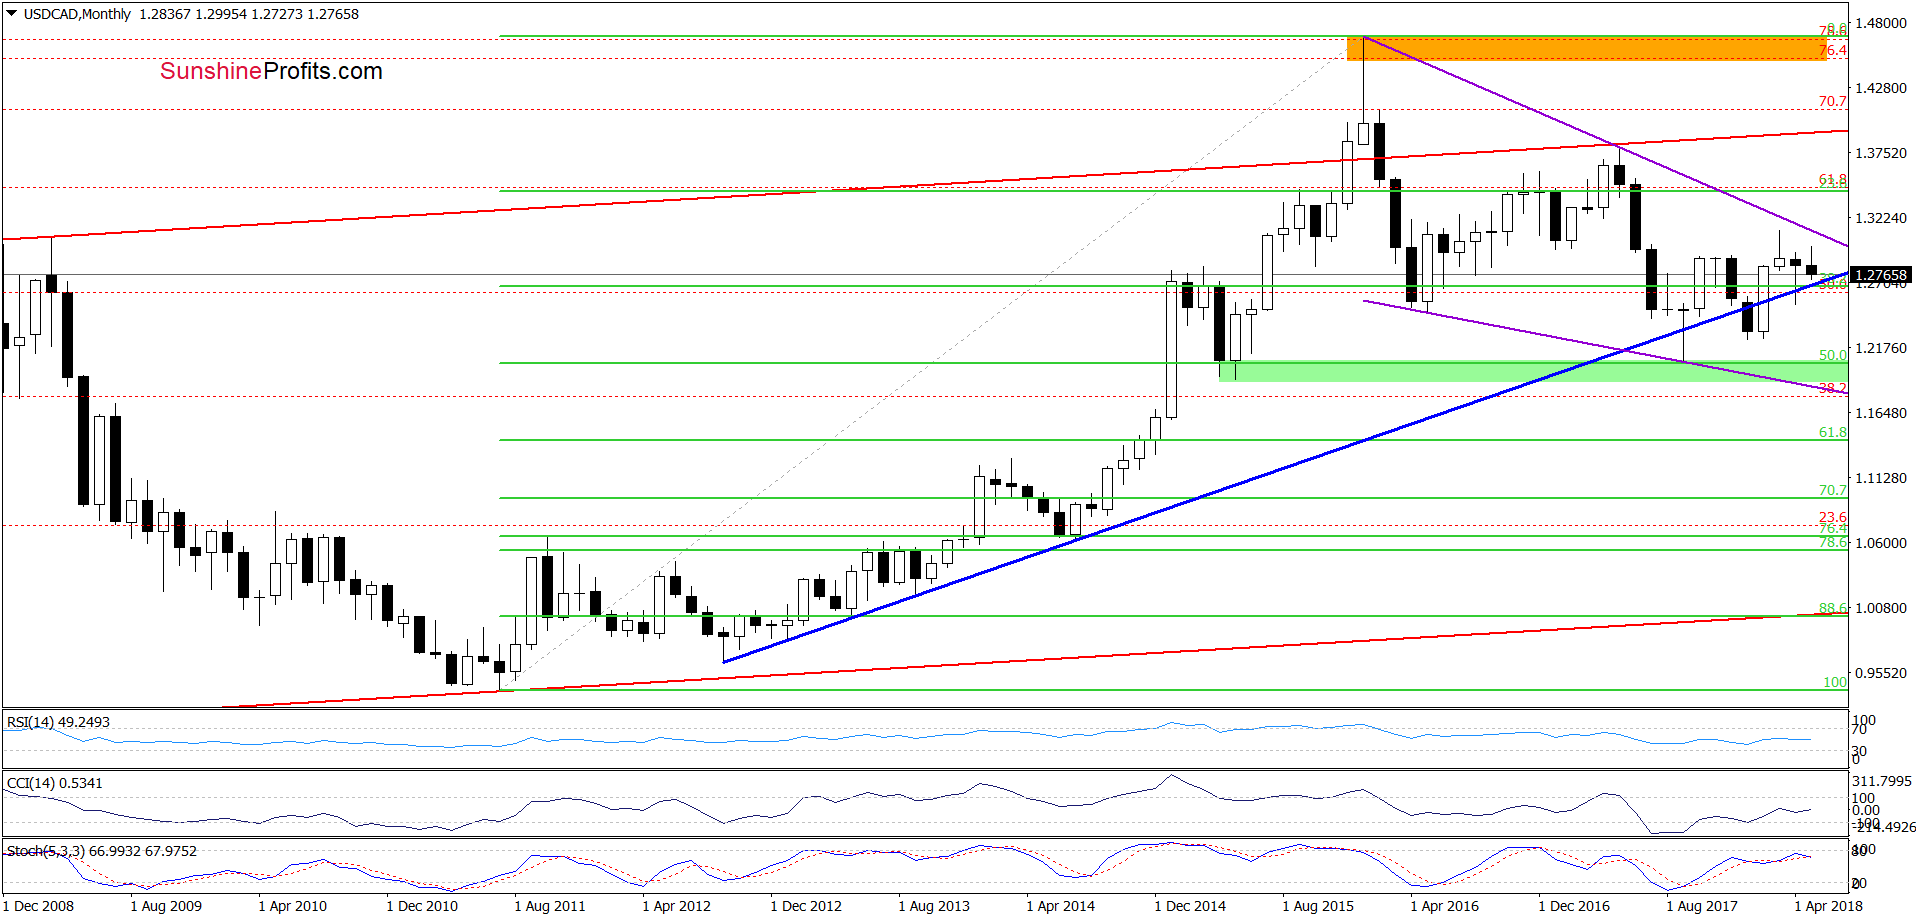
On Friday, USD/CAD rebounded slightly, but one more downswing and a fresh low around 1.2700 seems to us very likely. Why there? Because in this area currency bulls will find the long-term blue line (based on the September 2012, September 2013 and July 2014 lows), which serves as the nearest important support.
Trading position (short-term; our opinion): No positions are justified from the risk/reward perspective. We will keep you informed should anything change, or should we see a confirmation/invalidation of the above.
USD/CHF
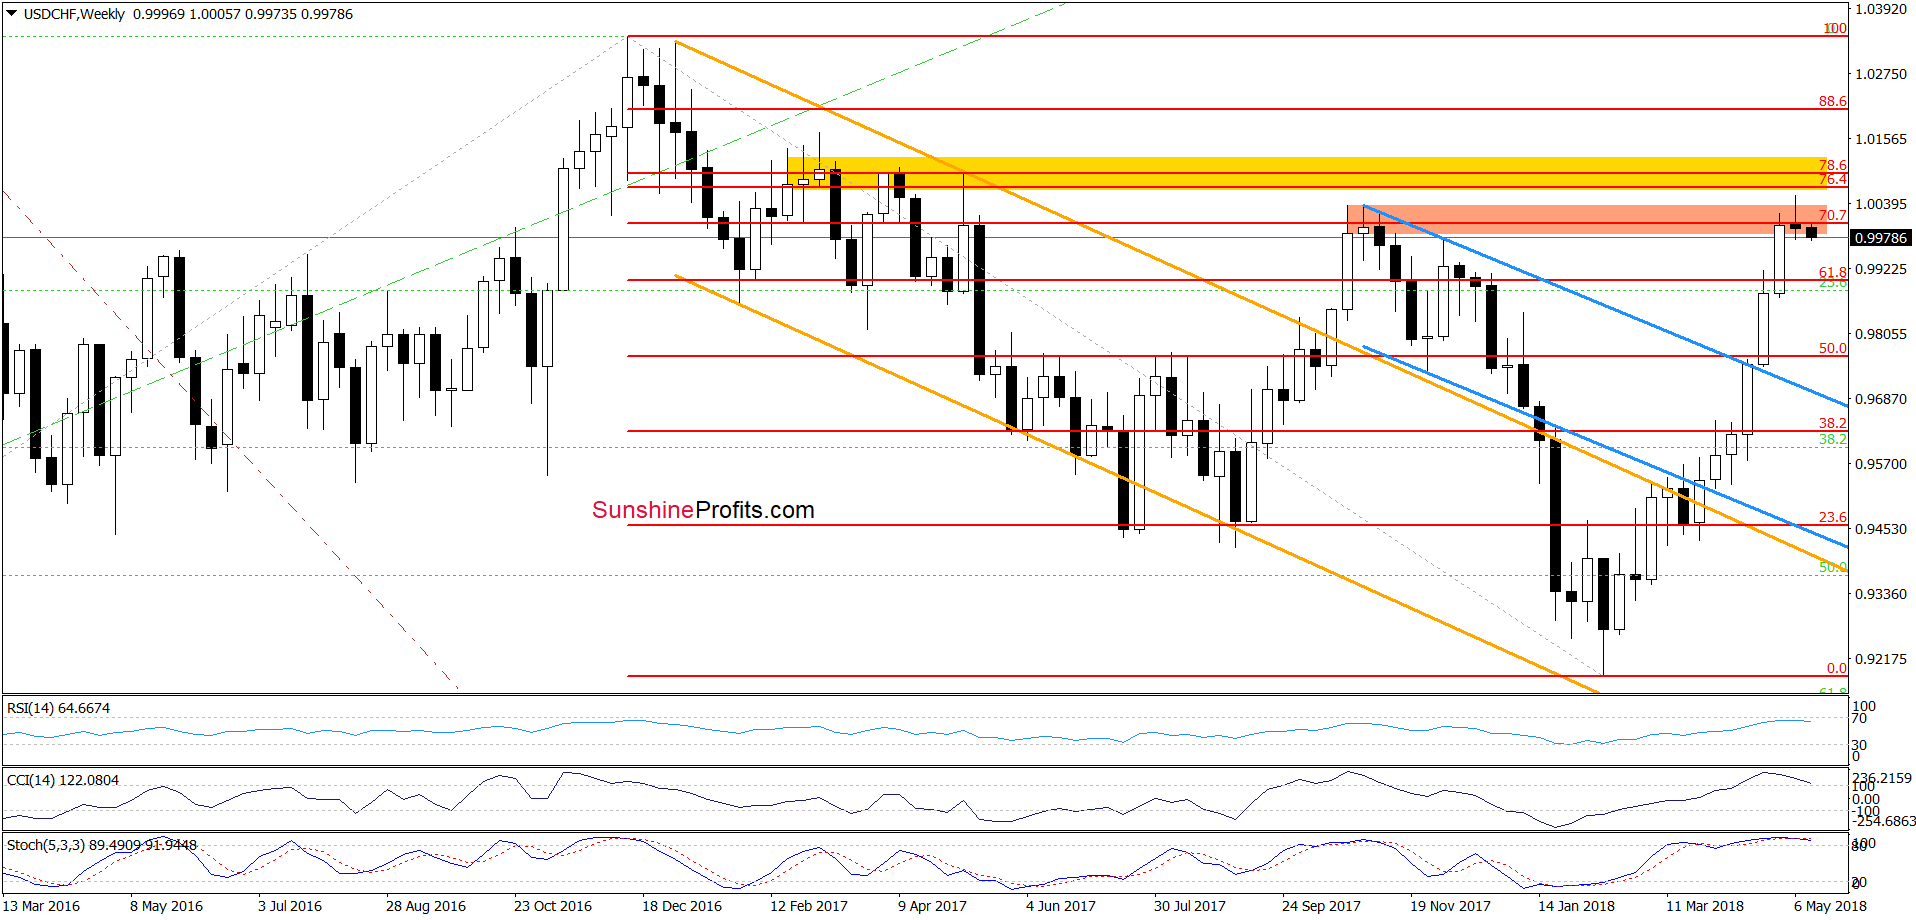
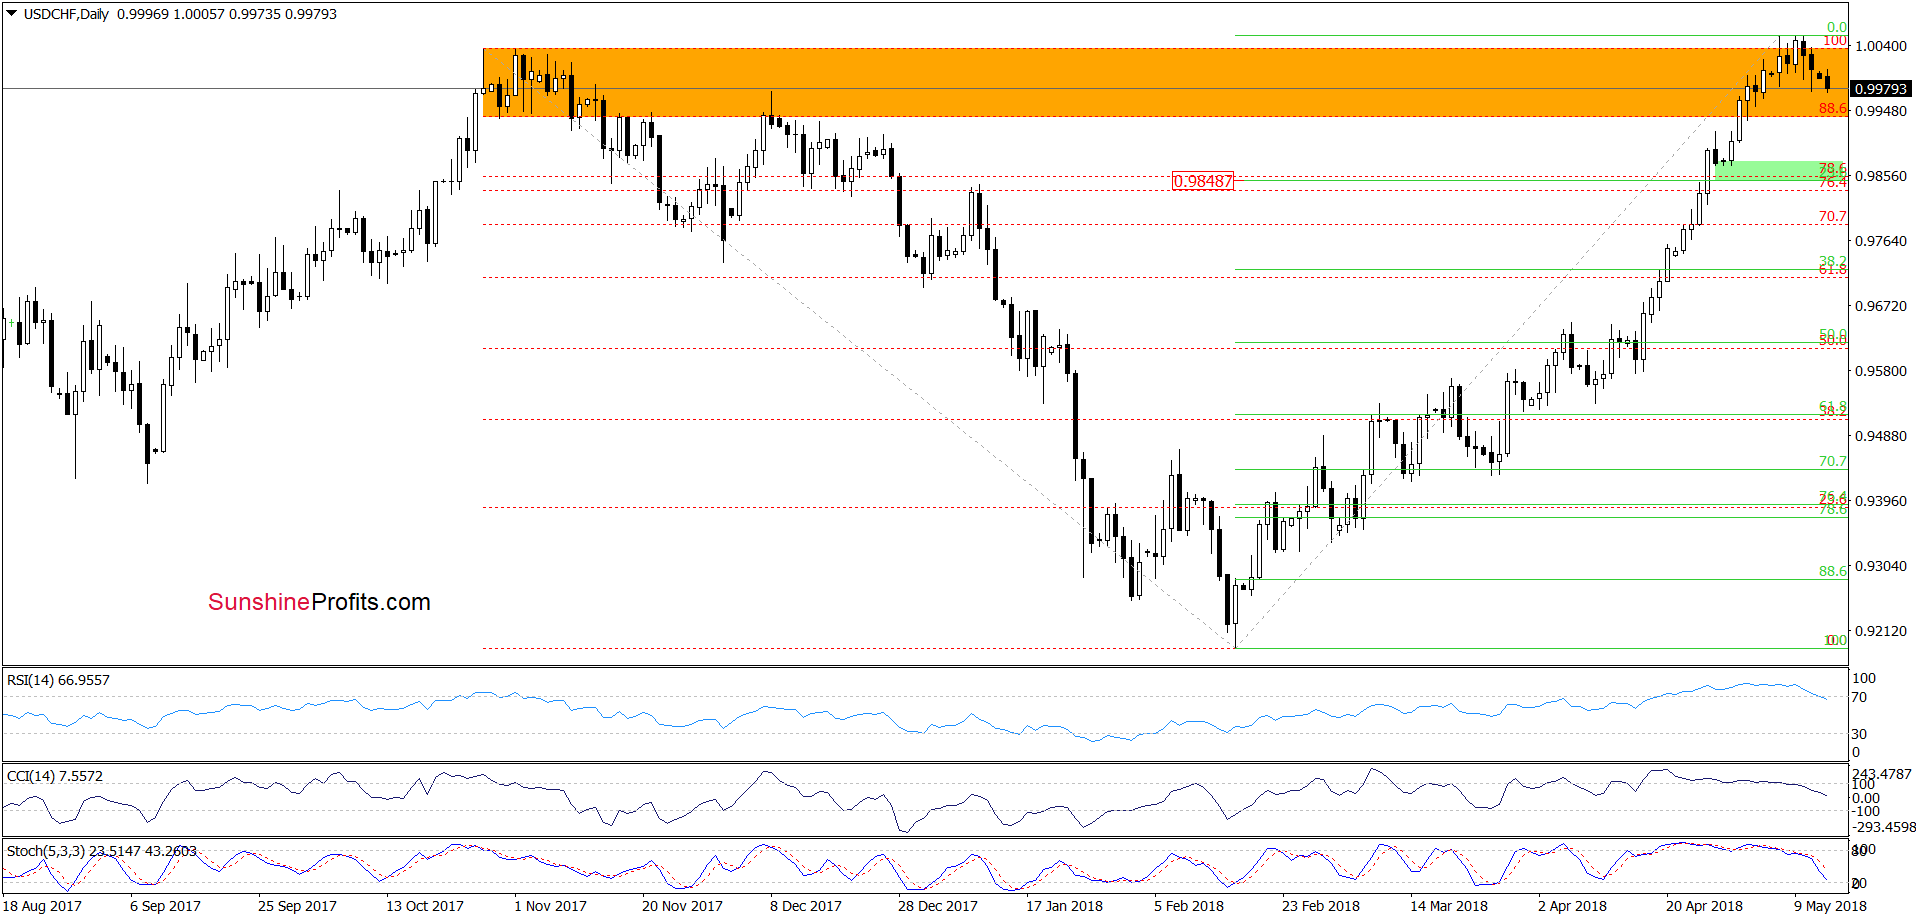
On the above charts, we see that although USD/CHF climbed above the orange resistance zone in the previous week, the 70.7% Fibonacci retracement in combination with the proximity to the yellow resistance zone (seen on the weekly chart) stopped the rally, triggering a pullback, which invaidated the earlier breakout above October and November peaks.
This show of currency bulls’ weakness resulted in further deterioration earlier today, which together with the sell signals generated by the indicators suggests that we’ll see lower values of USD/CHF in the coming day(s).
How low could the pair go? In our opinion, if the exchange rate slips under the lower border of the orange zone, we could see a drop to around 0.9850-0.9875, where the green support zone (marked on the daily chart) is.
Trading position (short-term; our opinion): No positions are justified from the risk/reward perspective. We will keep you informed should anything change, or should we see a confirmation/invalidation of the above.
Thank you.
Nadia Simmons
Forex & Oil Trading Strategist
Przemyslaw Radomski, CFA
Founder, Editor-in-chief, Gold & Silver Fund Manager
Gold & Silver Trading Alerts
Forex Trading Alerts
Oil Investment Updates
Oil Trading Alerts

