

Tuesday’s session showed that currency bulls are stronger than it seemed on Monday. Thanks to their determination, EUR/USD tested the next Fibonacci retracement and closed the day above the previously-broken June lows. Will the falling U.S. dollar continue to support the European currency in the coming days?
EUR/USD
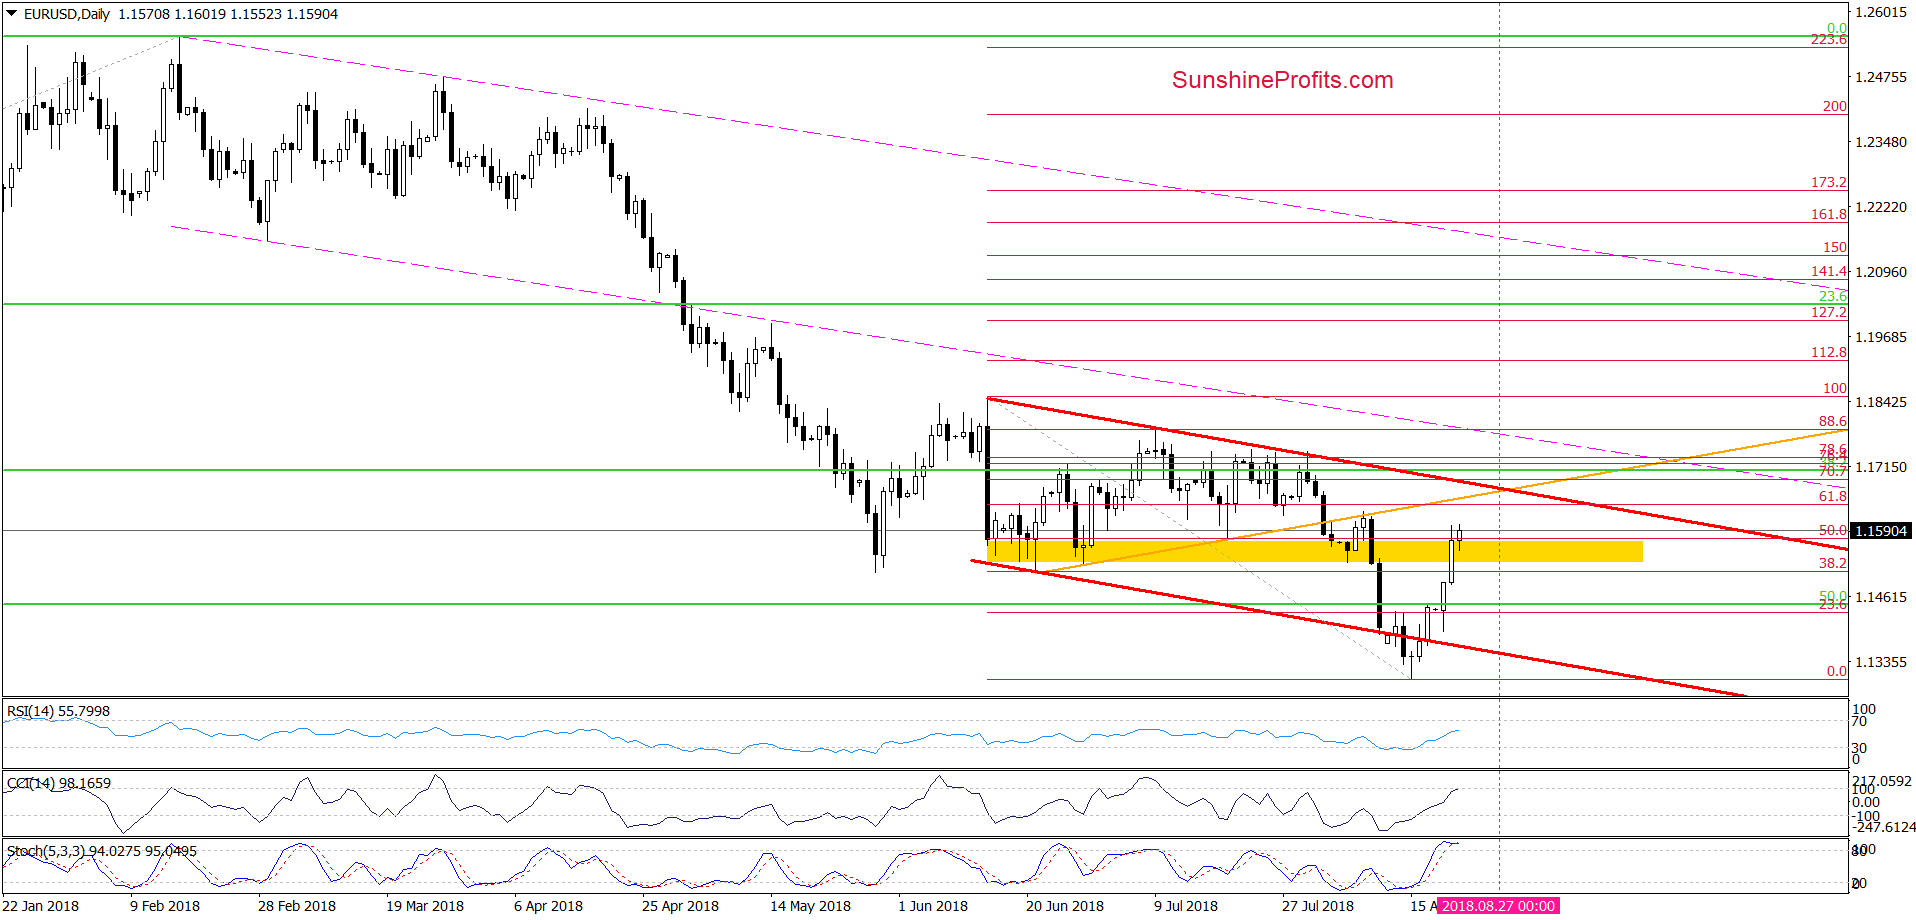
Looking at the very short-term changes, we see that EUR/USD extended gains after our yesterday’s alert was posted, which resulted in a breakout above the yellow resistance zone based on June lows.
Although the exchange rate pulled back at the end of the day, currency bulls didn’t give up and triggered another upswing, breaking above this area once again and showing further strength earlier today.
Taking all the above into account, it seems to us that the pair will test not only the 61.8% Fibonacci retracement and the previously-broken orange line (which serve as the nearest resistances), but also the upper border of the red declining trend channel in the following days.
This scenario is also reinforced by the current situation in the USD Index about which we write more below.
Focus on the USD Index
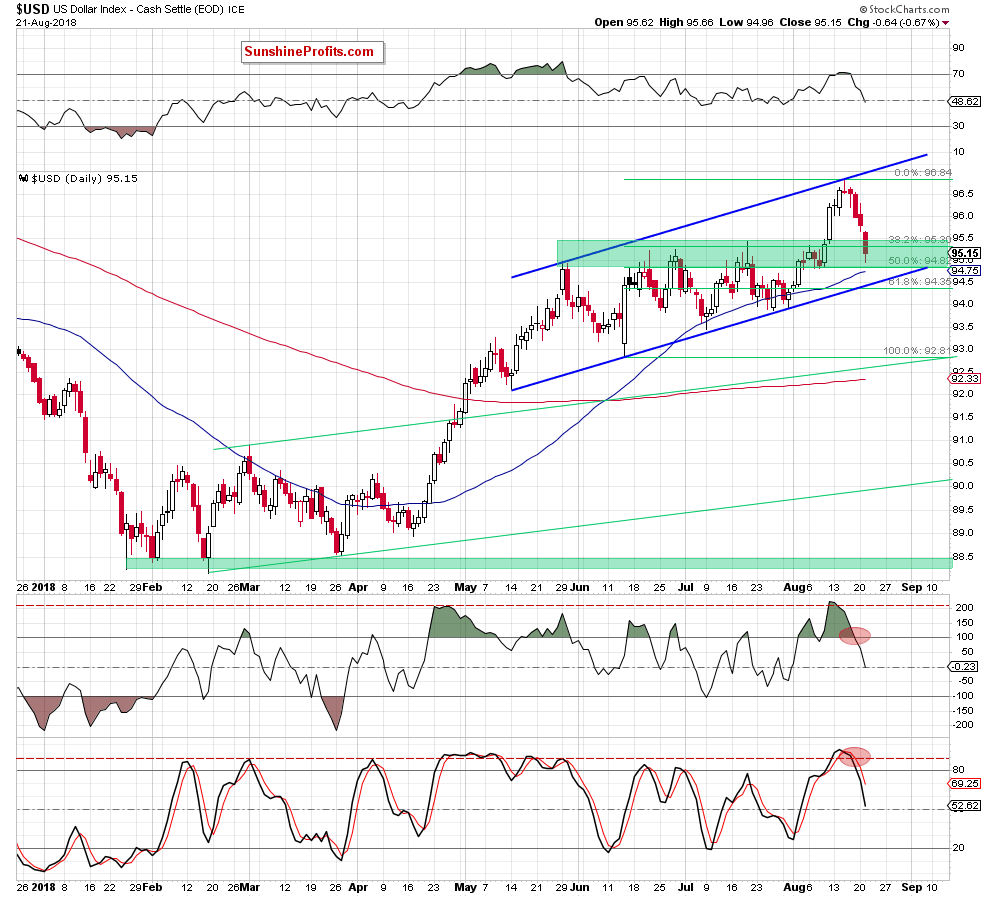
From the daily perspective, we see that the USD Index extended losses during yesterday’s session, which resulted in a drop below the previously-broken June and July 2018 peaks.
In this way, the greenback invalidated the earlier breakout above several intraday highs, which doesn’t bode well for the U.S. currency – especially when we factor in the sell signals generated by the CCI and the Stochastic Oscillator.
In contrast to the indicators that you saw under the EUR/USD chart, they still have space for declines, which increases the probability that the USD Index will test (at least) the lower border of the blue rising trend channel in the very near future.
So, when can we expect a reversal?
Basing on the triangle apex reversal technique, we think that we could see a change of the current direction at the beginning of next week. Why then?
Let's go back to the EUR/USD chart for a moment. As you saw on the daily chart, the upper border of the red declining trend channel creates a quite sizable triangle with the orange rising line based on the June lows.
The intersection of its lines will take place on Monday or Tuesday (we marked it with a pink horizontal line), which increases the probability that we’ll likely see a reversal – especially if EUR/USD and the USD Index reach the above-mentioned targets.
If the situation develops in tune with our assumptions, we’ll re-open short positions in EUR/USD. Until this time, waiting at the sidelines for a confirmation/invalidation of the above is justified from the risk/reward perspective.
Trading position (short-term; our opinion): Connecting the dots, no positions are justified from the risk/reward perspective. We will keep you informed should anything change, or should we see a confirmation/invalidation of the above.
GBP/USD
In the previous week, we commented the situation in the following way:
(…) the lower border of the very short-term red declining trend channel withstood the selling pressure and continues to keep declines in check.
Therefore, in our opinion, as long as this support remains in the cards a bigger move to the downside is not likely to be seen.
(…) a bigger move to the upside will be more likely and reliable only if the exchange rate invalidates the earlier breakdown bellow both green lines and daily indicators generate buy signals. (…)
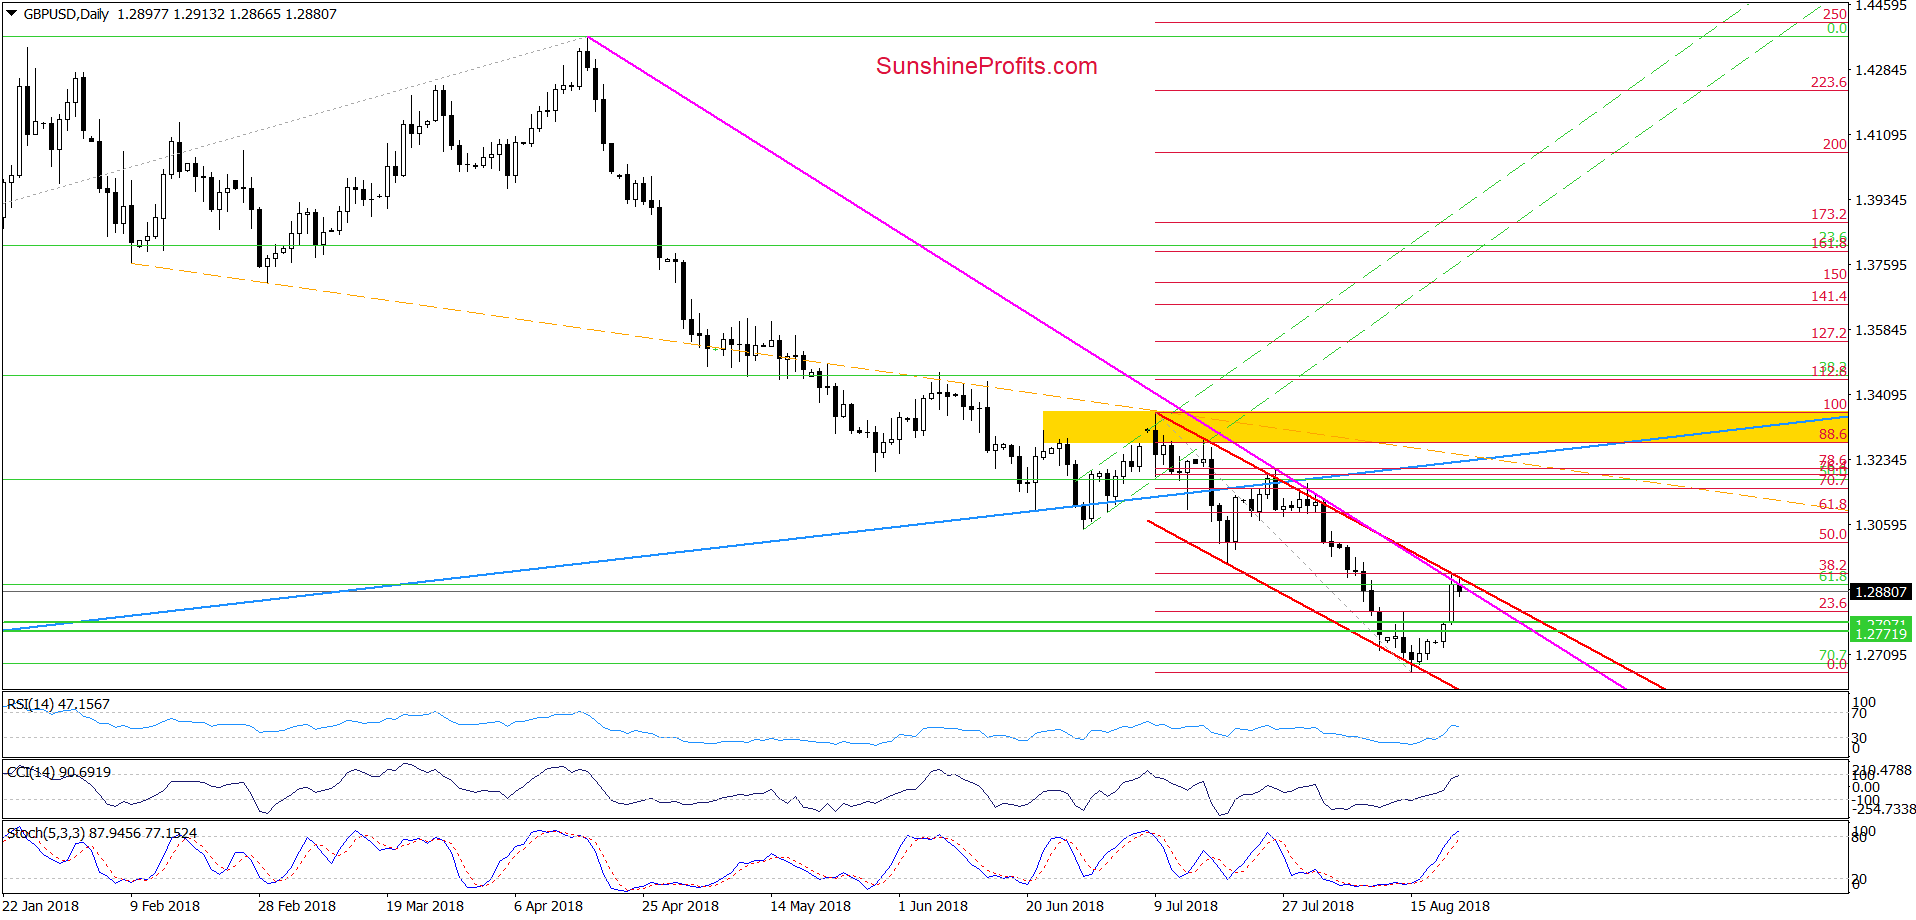
As you see on the daily chart, currency bulls closed Monday’s session above the first of the green lines, which encouraged the buyers to ack and resulted in a sharp move to the upside yesterday.
Thanks to this one-day rally, GBP/USD climbed to the first solid resistance zone created by the 38.2% Fibonacci retracement (based on the July-August declines), the upper border of the red declining trend channel and the medium-term pink declining line based on the April and late-July peaks.
What does it mean for GBP/USD? In our opinion, as long as there is no breakout above it, higher values of the exchange rate are not likely to be seen. Nevertheless, if the greenback shows weakness in the following days, one more upswing should not surprise us (however, as long as we do not see a daily closure above these resistances, it could be only short-lived improvement).
Trading position (short-term; our opinion): No positions are justified from the risk/reward perspective. We will keep you informed should anything change, or should we see a confirmation/invalidation of the above.
USD/JPY
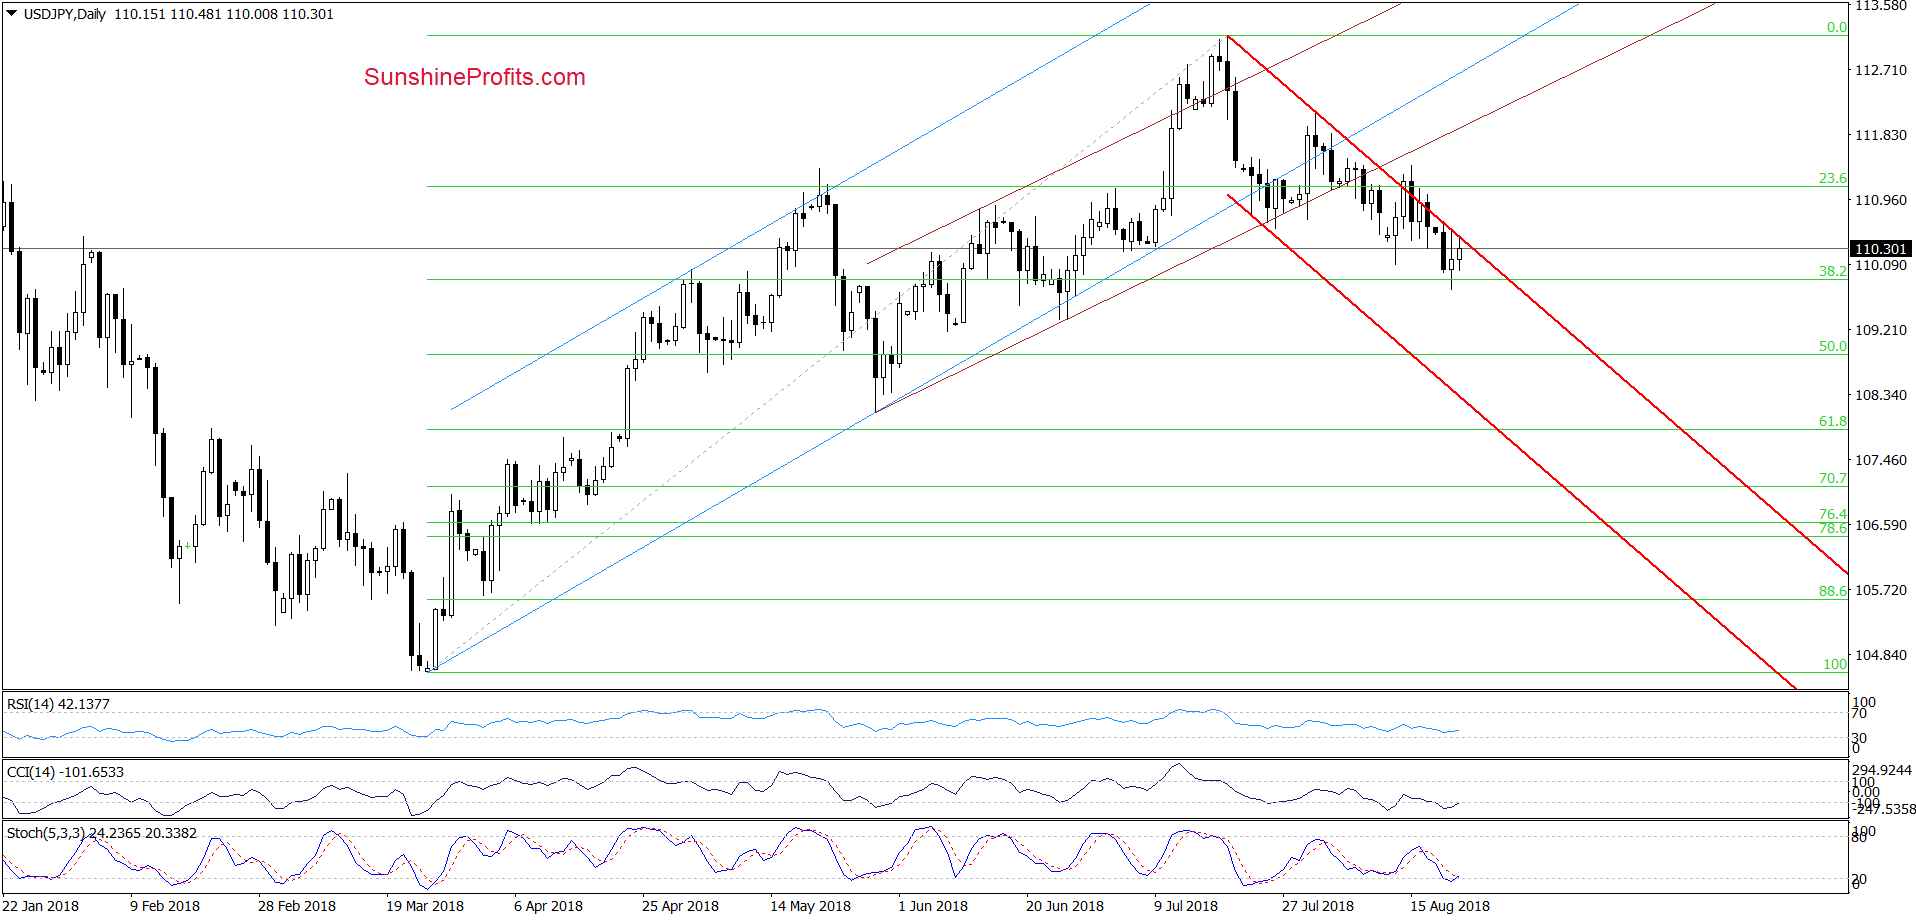
On the daily chart, we see that the overall situation in the short-term hasn’t changed much as USD/JPY is still trading inside the red declining trend channel. This means that our last commentary on this currency pair remains up-to-date also today:
(…) the exchange rate invalidated the earlier tiny breakout for a third time in a row, which doesn’t bode well for higher values of USD/JPY in the very near future – especially when we factor in the sell signal generated by the Stochastic Oscillator.
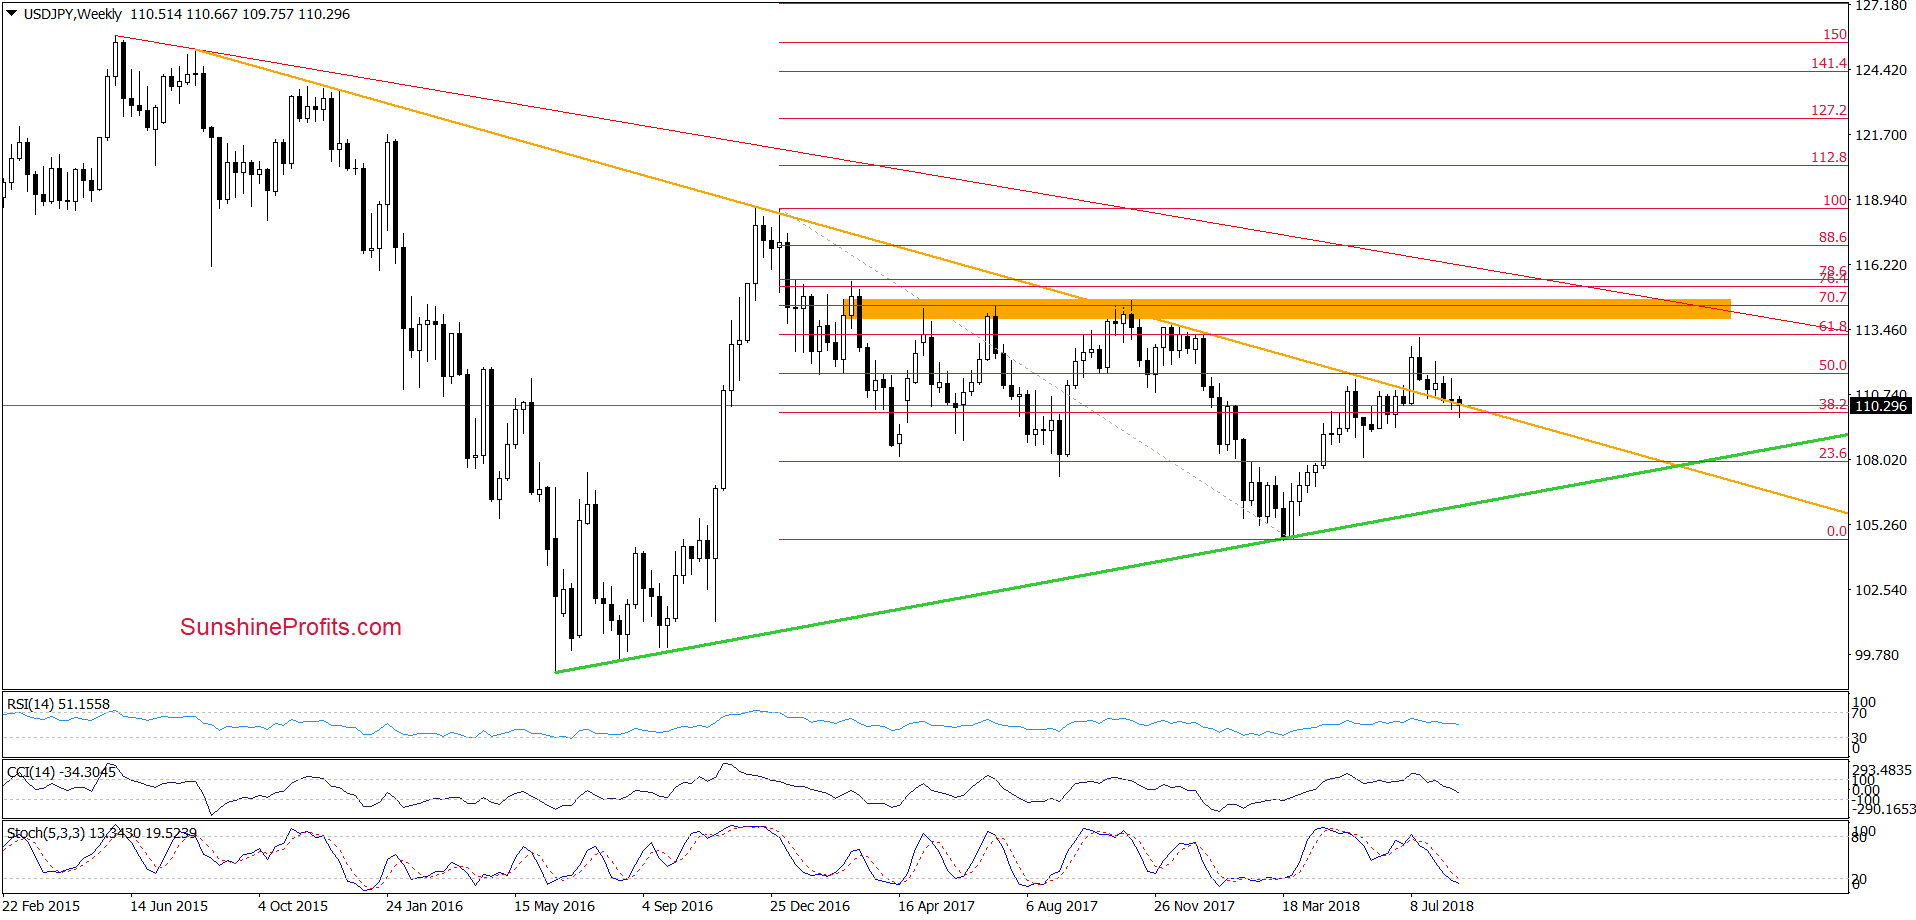
Nevertheless, as long as the buyers’ strong and solid ally (the long-term orange support line seen more clearly on the weekly chart below) continues to keep declines in check a sizable move to the downside is not likely to be seen.
Finishing today’s commentary on this currency pair, please note that USD/JPY closed the previous week above this very important support line, which looks like another verification of the earlier breakout. Therefore, as long as there is no weekly closure under this line one more reversal from here should not surprise us.
Trading position (short-term; our opinion): No positions are justified from the risk/reward perspective. We will keep you informed should anything change, or should we see a confirmation/invalidation of the above.
Thank you.
Nadia Simmons
Forex & Oil Trading Strategist
Przemyslaw Radomski, CFA
Founder, Editor-in-chief, Gold & Silver Fund Manager
Gold & Silver Trading Alerts
Forex Trading Alerts
Oil Investment Updates
Oil Trading Alerts

