

Although the lower border of the declining trend channel managed to stop currency bears in the previous week, their opponents didn’t hold it, which resulted in the breakdown and a daily closure under this support. What does it mean for the AUD/USD future’s moves?
In our opinion the following forex trading positions are justified - summary:
EUR/USD
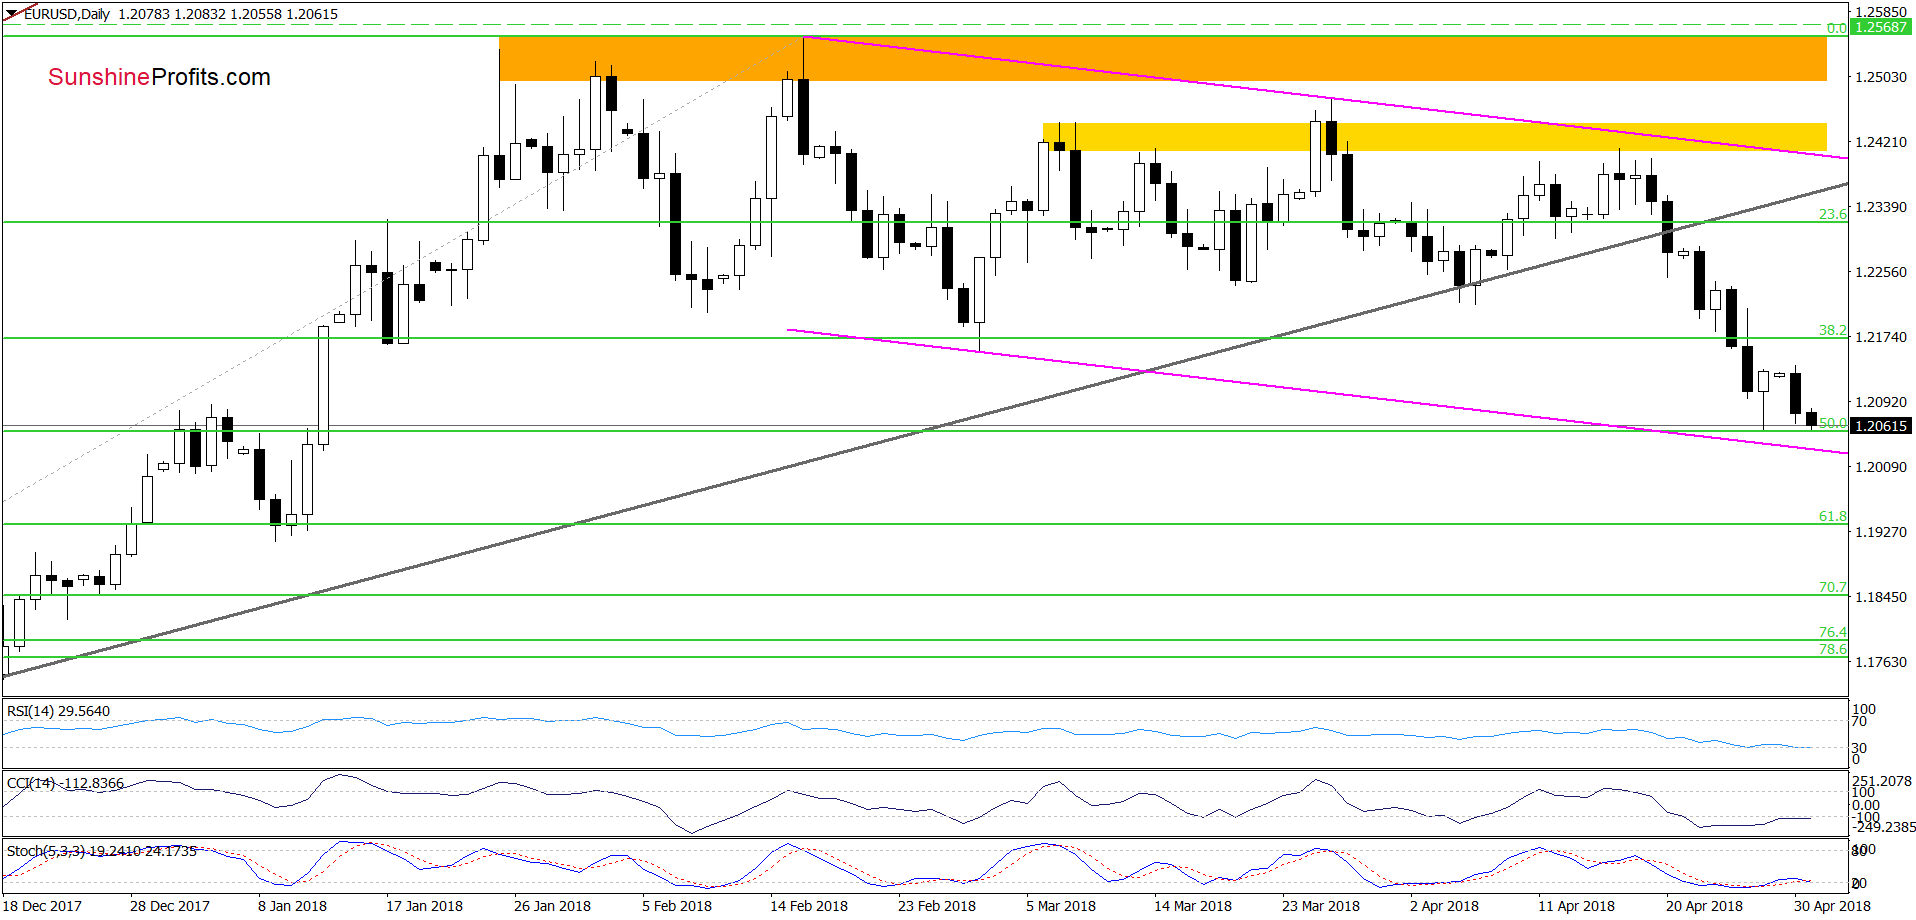
Looking at the daily hart, we see that EUR/USD extended losses earlier today, which means that what we wrote yesterday remains up-to-date:
(…) the exchange rate bounced off the 50% Fibonacci retracement on Friday. Despite this improvement, currency bears took the pair lower earlier today, which increases the probability of a test of the last week’s low or even the lower border of the purple declining trend channel in the coming day(s).
Trading position (short-term; our opinion): No positions are justified from the risk/reward perspective. We will keep you informed should anything change, or should we see a confirmation/invalidation of the above.
USD/CAD
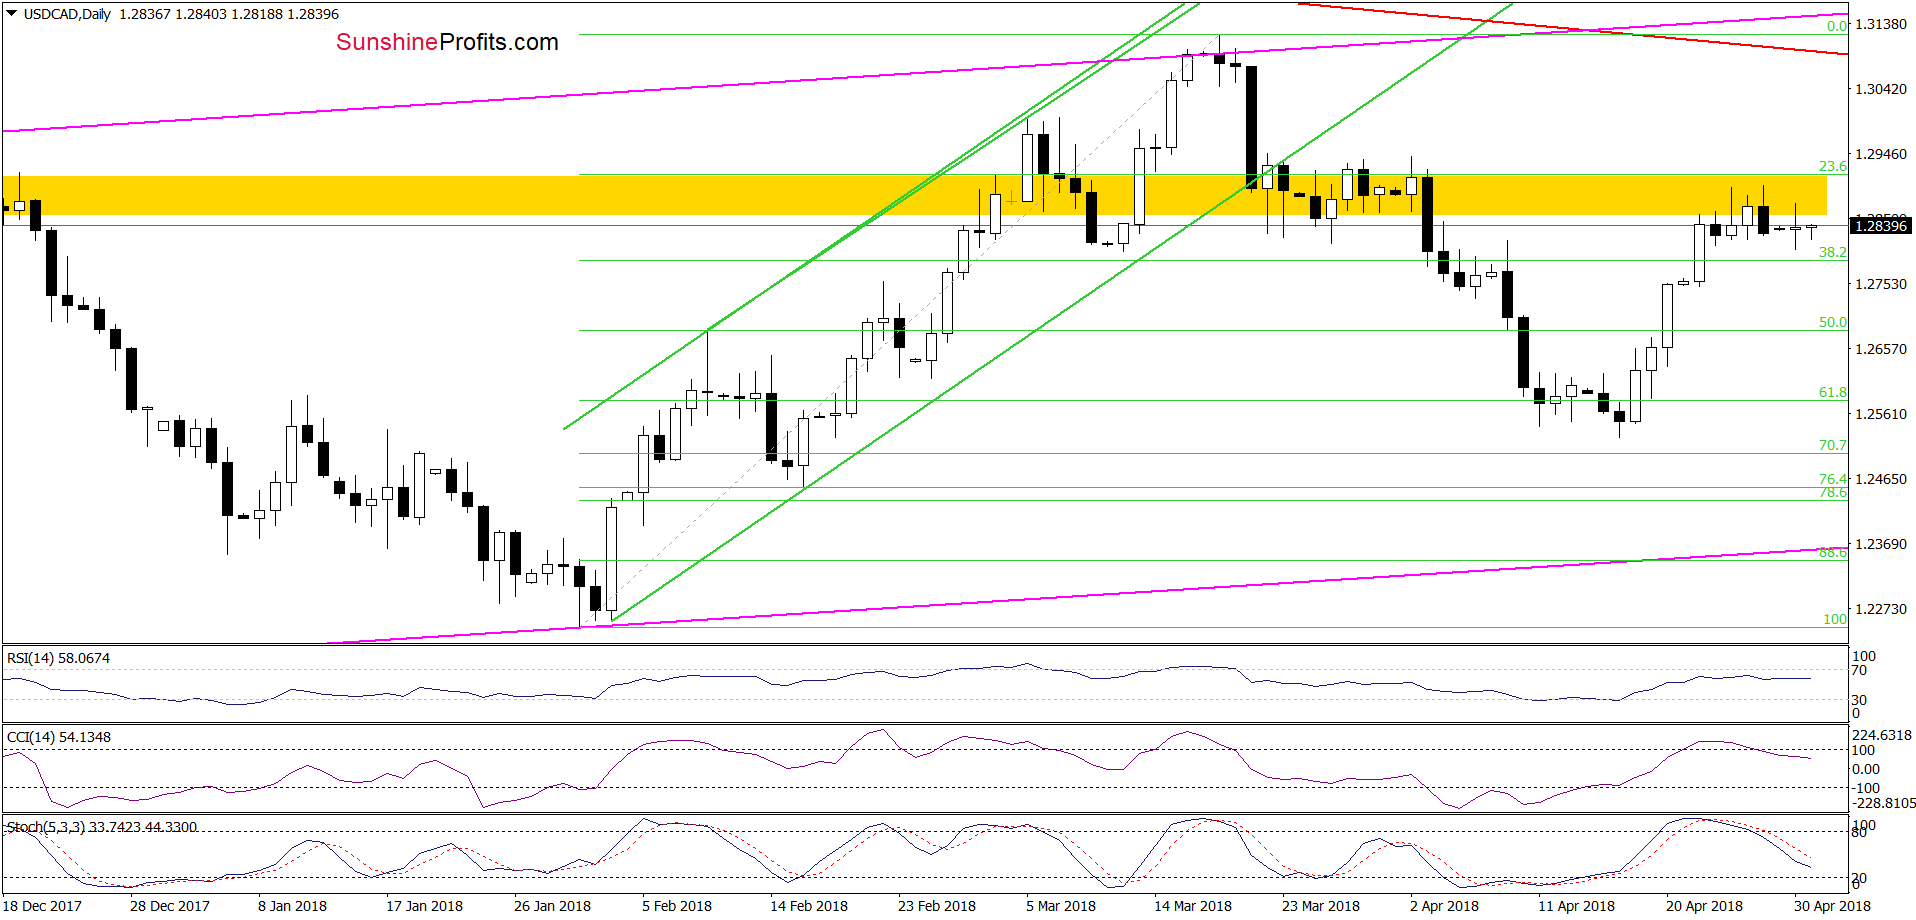
From today’s point of view, we see that the overall situation hasn’t changed much sine several days as USD/CAD is consolidation slightly below the yellow resistance zone (which is currently reinforced by the 61.8% Fibonacci retracement based on the recent March-April decline). This means that as long as there is no breakout above this area, higher values of USD/AD are not likely to be seen.
Finishing this section, we would like to add that if we see any reliable signs of the buyers’ weakness in this area, we’ll consider re-opening short positions.
Trading position (short-term; our opinion): No positions are justified from the risk/reward perspective. We will keep you informed should anything change, or should we see a confirmation/invalidation of the above.
AUD/USD
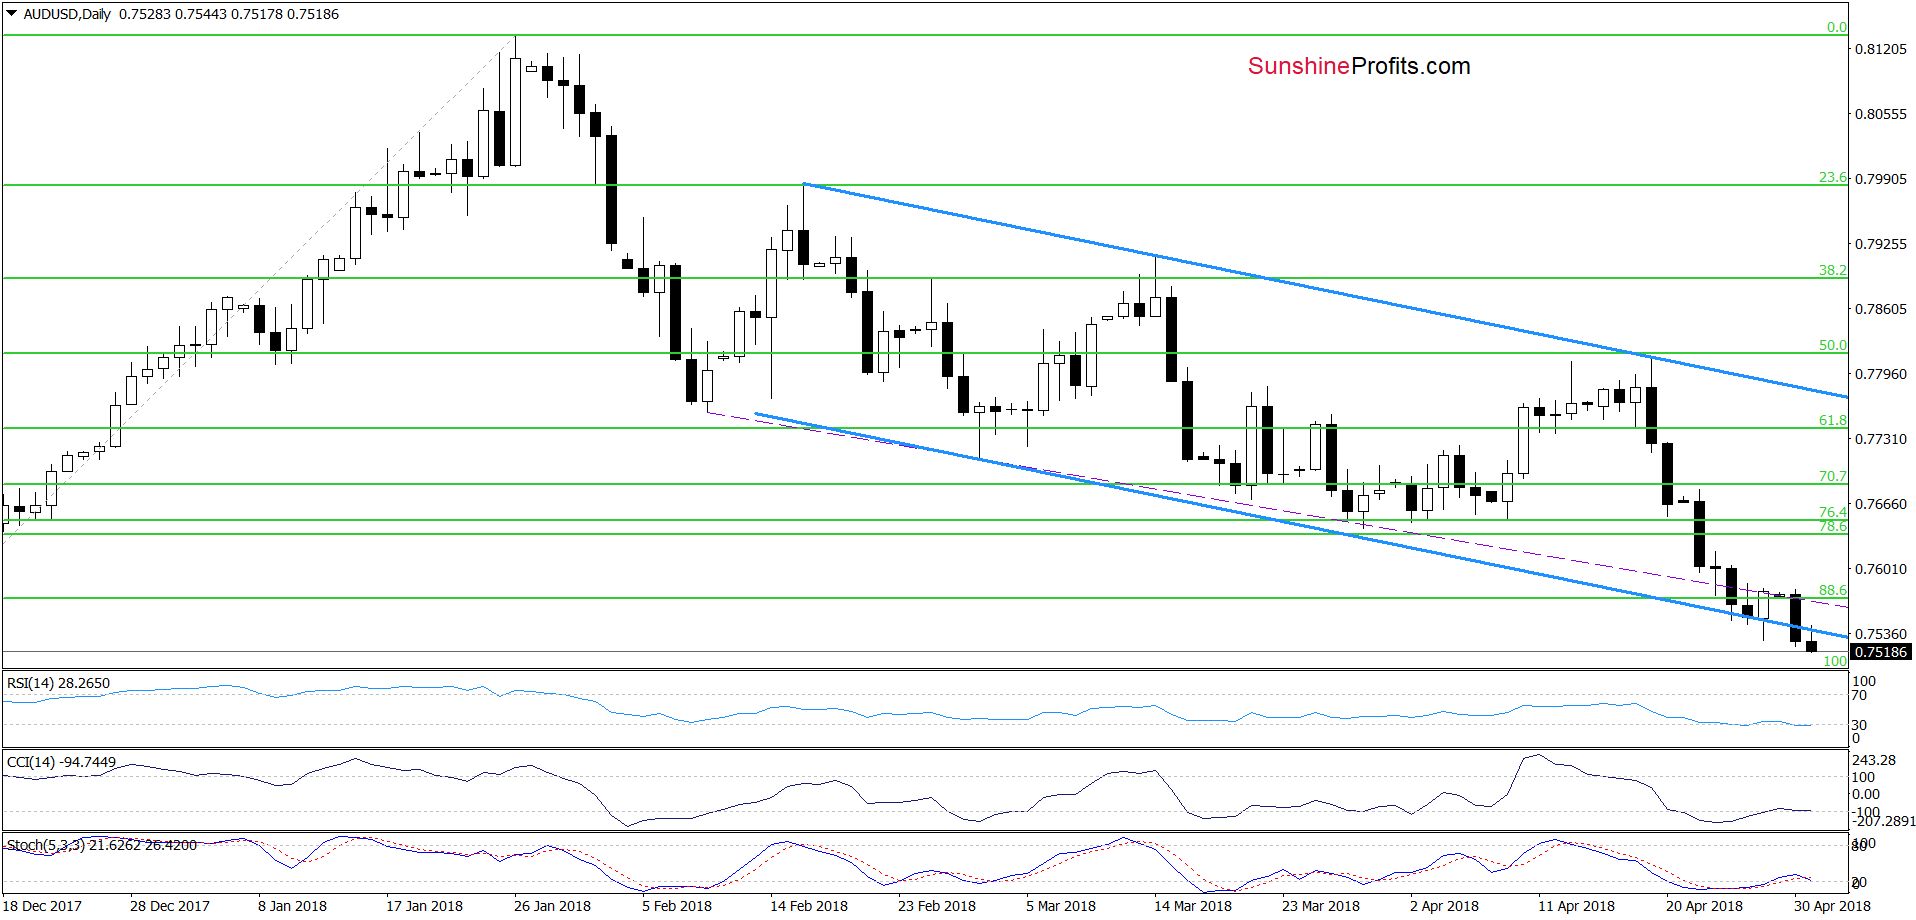
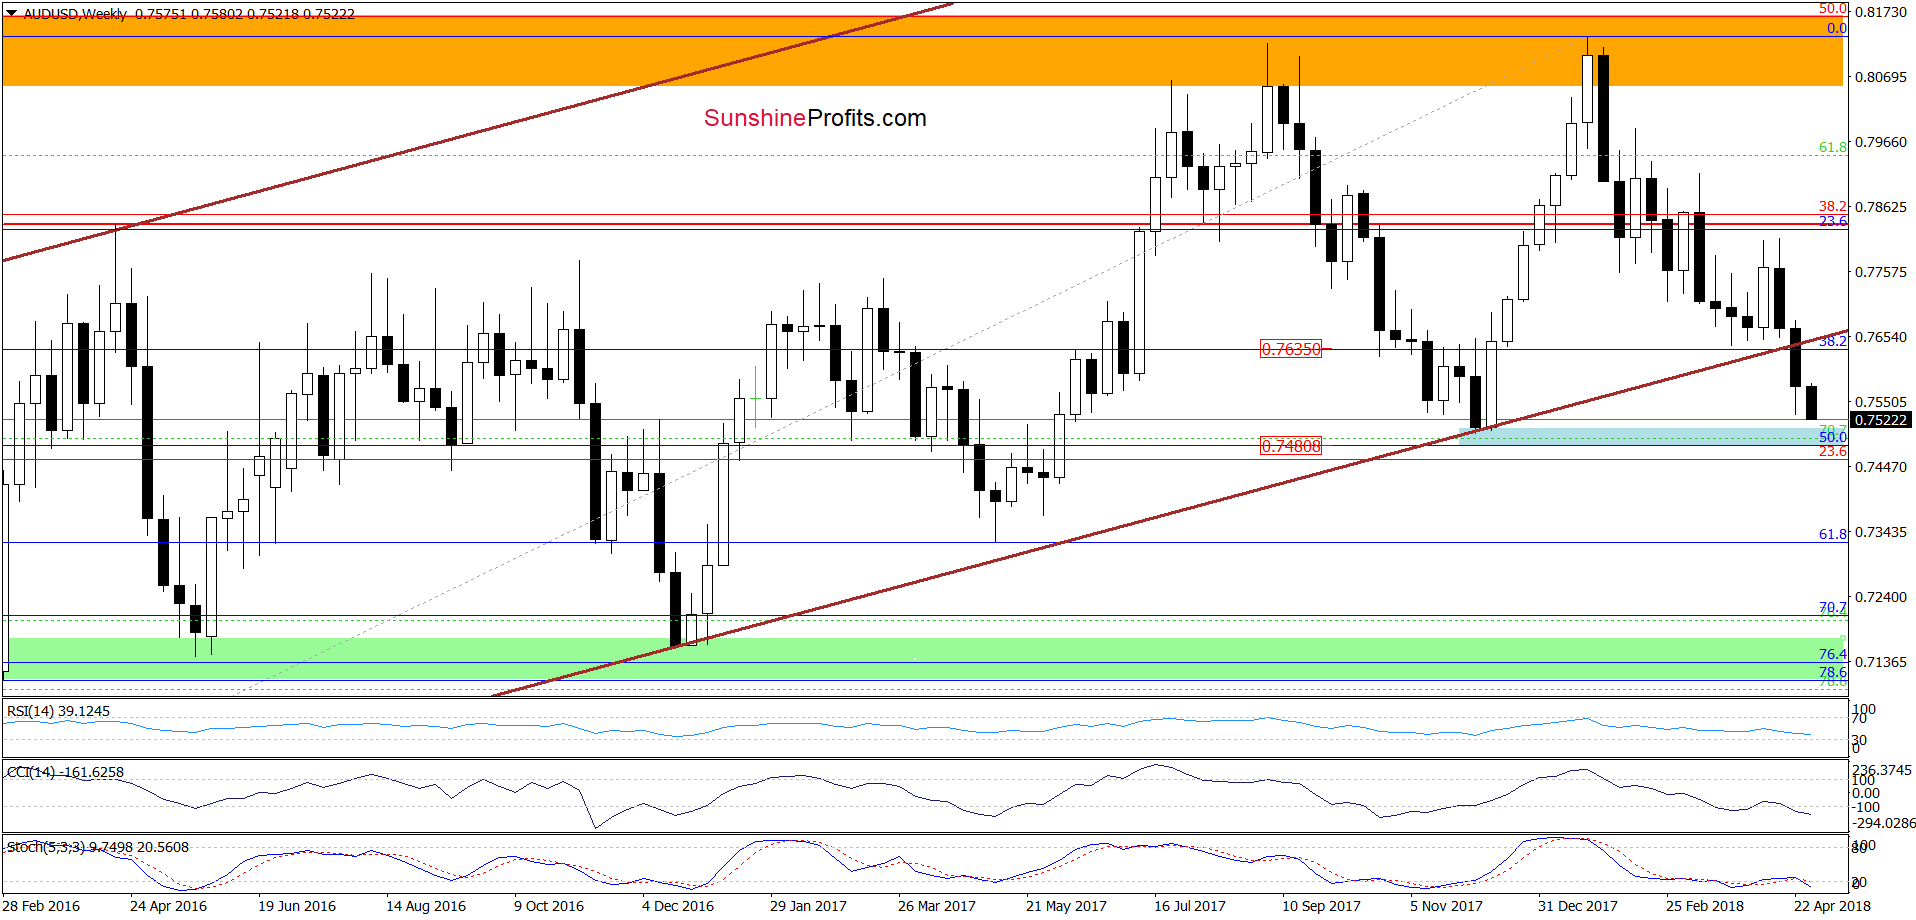
The first thing that catches the eye on the daily chart is the breakdown under the lower border of the blue declining trend channel, which suggests that we’ll see a test of the blue support zone created by the 50% Fibonacci retracement based on the entire 2016-2018 upward move and the December lows (marked on the weekly chart below) in the very near future.
Trading position (short-term; our opinion): No positions are justified from the risk/reward perspective. We will keep you informed should anything change, or should we see a confirmation/invalidation of the above.
Thank you.
Nadia Simmons
Forex & Oil Trading Strategist
Przemyslaw Radomski, CFA
Founder, Editor-in-chief, Gold & Silver Fund Manager
Gold & Silver Trading Alerts
Forex Trading Alerts
Oil Investment Updates
Oil Trading Alerts

