

In our opinion, the following forex trading positions are justified - summary:
- EUR/USD: long (a stop-loss order at 1.1015; the initial upside target at 1.1157)
- GBP/USD: long (a stop-loss order at 1.2720; the initial upside target at 1.2976)
- USD/JPY: short (a stop-loss order at 109.66; the initial downside target at 107.14)
- USD/CAD: long (a stop-loss order at 1.3070; the initial upside target at 1.3300)
- USD/CHF: none
- AUD/USD: none
EUR/USD
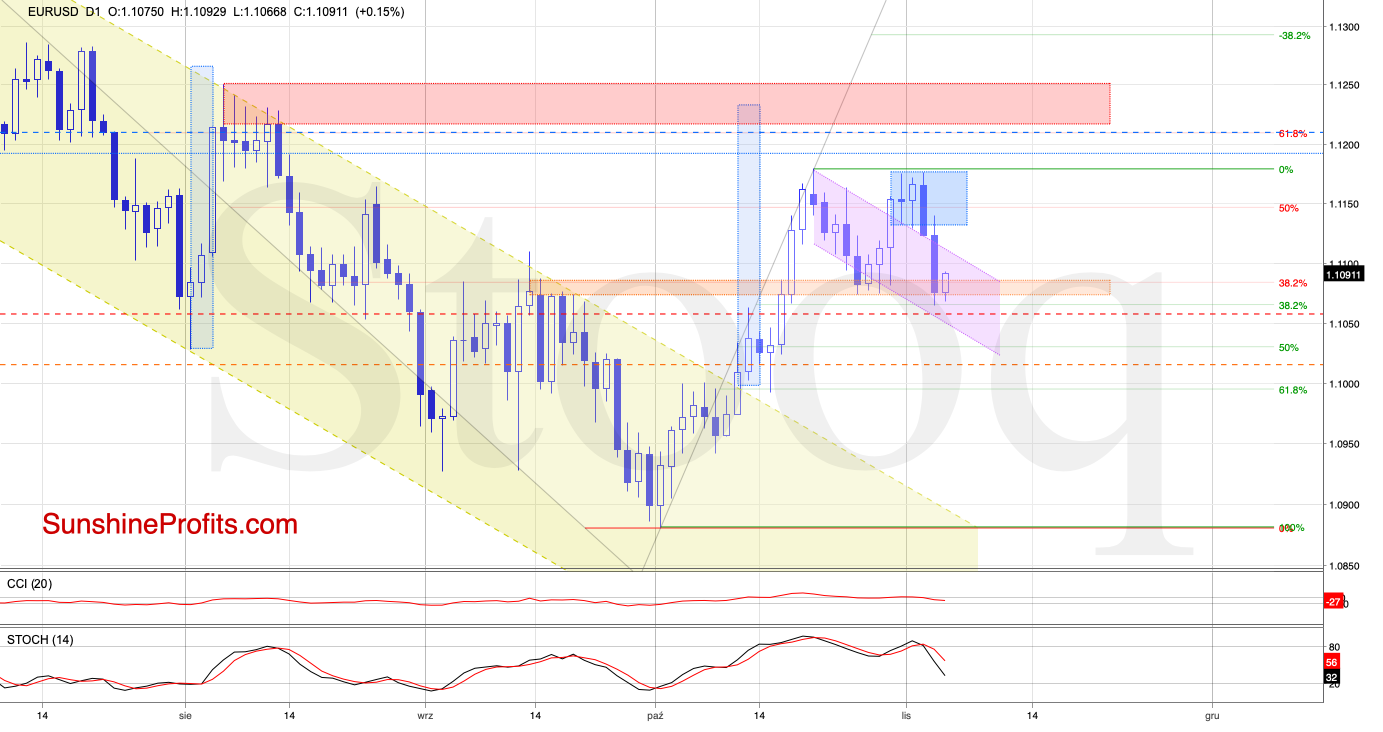
Yesterday, EUR/USD verified the breakdown below the lower border of the blue consolidation. This has triggered further deterioration, and the pair slipped below the upper border of the declining purple trend channel, invalidating its earlier breakout above it.
This is a bearish development, and the exchange rate retested the previously broken orange zone, which serves now as an additional support, and the 38.2% Fibonacci retracement.
These supports were strong enough to withstand the selling pressure, and the pair rebounded earlier today.
Taking this fact into account, we think that further improvement is just around the corner - especially when we factor in the current situation in the USD Index, as discussed further on.
If this is the case and the exchange rate extends gains from here, the first upside target will be the resistance area created by the recent peaks.
Trading position (short-term; our opinion): long positions with a fresh stop-loss order at 1.1015 and the initial upside target at 1.1157 are justified from the risk/reward perspective.
GBP/USD
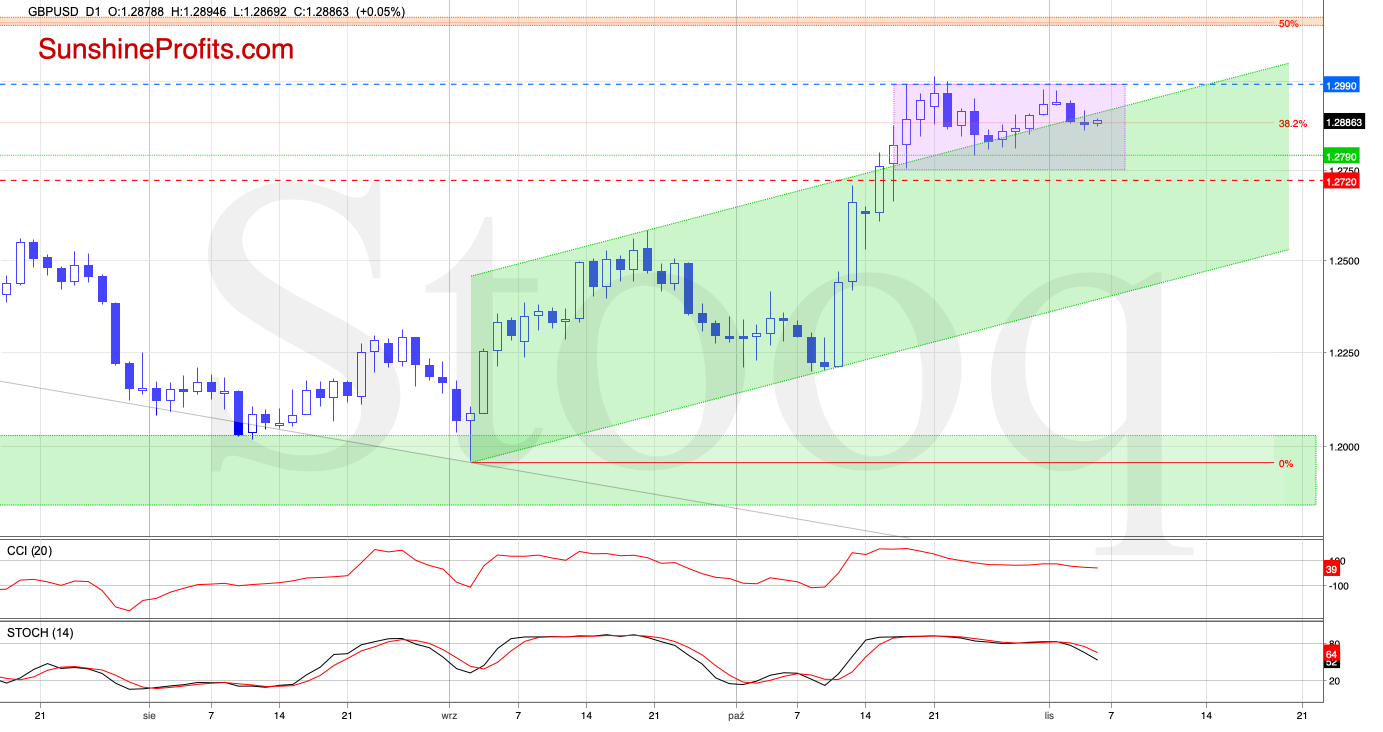
The combination of the previous peaks and the upper border of the purple consolidation triggered a pullback, taking GBP/USD below the previously broken upper border of the rising green trend channel.
While this is a bearish sign, the overall situation in the short term remains almost unchanged as the pair is still trading inside the purple consolidation and well above the Oct. 24 low.
Therefore, one more attempt to move higher may be just around the corner - especially when we take into account the short-term situation in the USD Index, as discussed further on.
Trading position (short-term; our opinion): long positions with a stop-loss order at 1.2720 and the initial upside target at 1.2976are justified from the risk/reward perspective.
AUD/USD
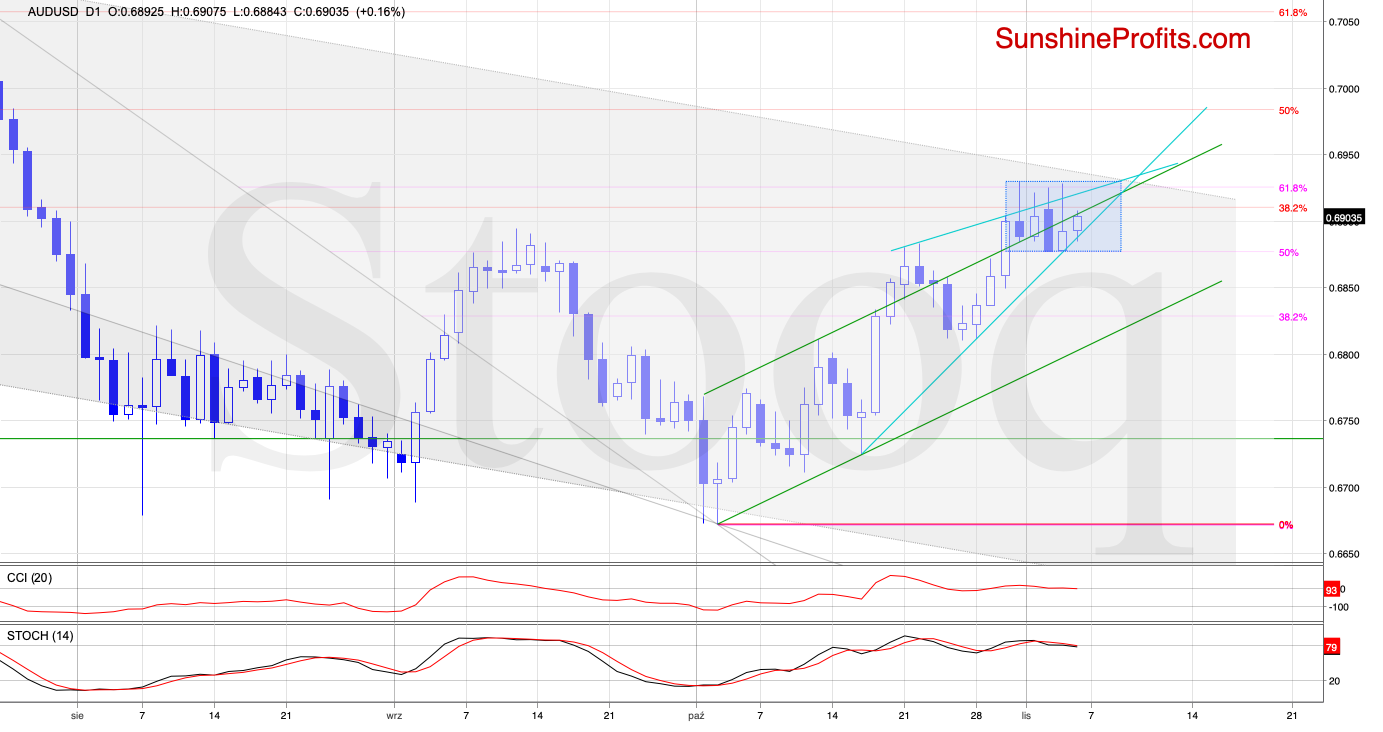
The short term situation hasn't changed much as AUD/USD is still trading inside the blue consolidation and the rising turquoise wedge. Therefore, as long as there is no daily close below the lower border of the formation or a breakout above the upper border of the consolidation, another bigger move is not likely to be seen.
Let's take into account several unsuccessful attempts to break above the 61.8% Fibonacci retracement and the upper border of the rising wedge, and the proximity to the upper border of the declining grey trend channel. As a result, it seems that even if the pair moves higher from here and tests the upper border of the declining grey trend channel, a reversal may be just around the corner.
Trading position (short-term; our opinion): No positions are justified from the risk/reward perspective.
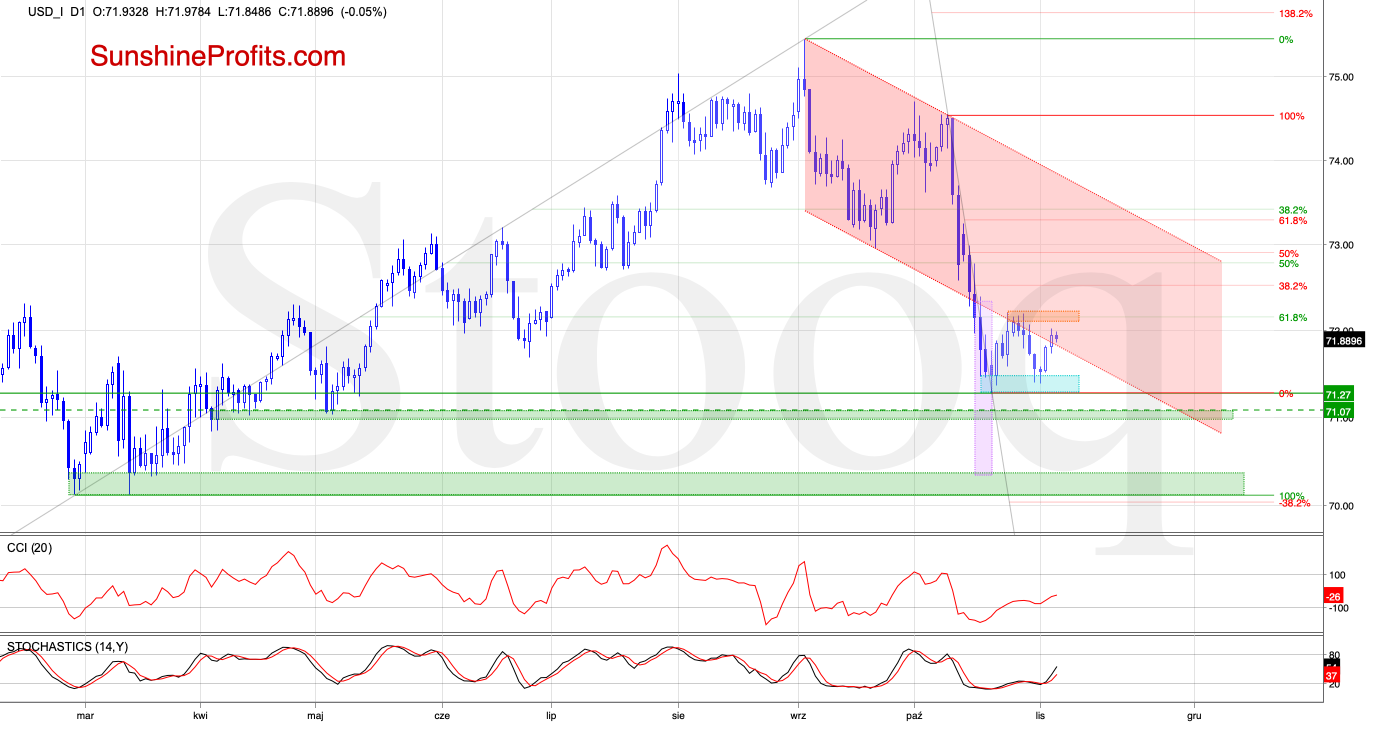
USD Index
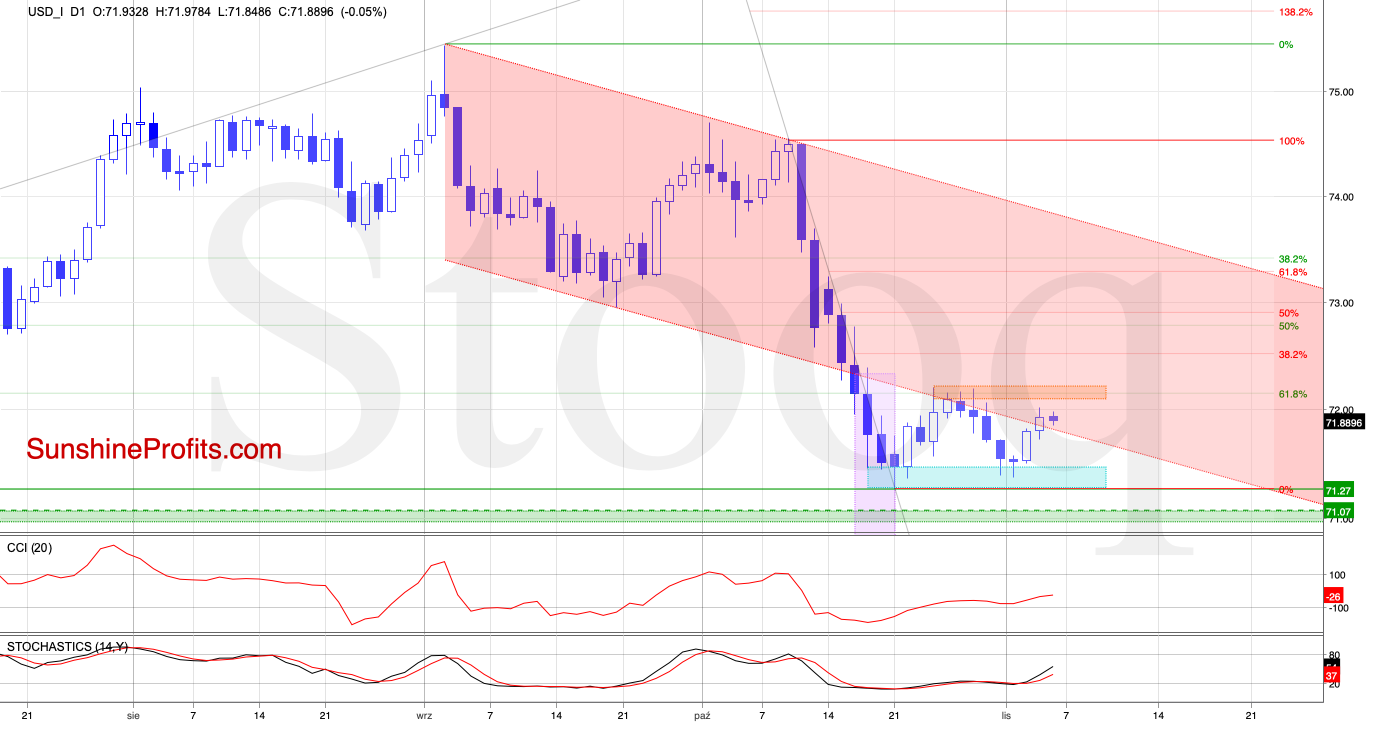
The USD Index broke below the lower border of the red declining trend channel in mid-October, which translated into a drop below the 61.8% Fibonacci retracement. These bearish signs opened the way to lower levels, encouraging the sellers to take the index even lower.
As a result, the index approached the green support area (as seen more clearly on the following chart), which encouraged the bulls to act. The index then rebounded to the previously broken levels: the Fibonacci retracement and the lower border of the trend channel.
However, the bulls didn't manage to push the dollar any higher, which translated into another move to the south. The greenback wasn't to be pushed any lower though, which generated another rebound in recent days.
That's a positive event for the bulls, especially when we take into account the fact that the index closed yesterday above the lower border of the red channel, with the daily indicators generating their buy signals.
But let's keep in mind that we already saw similar price action in October. Additionally, the Fibonacci retracement continues to serve as a resistance, just as the previous peaks do (you can see them marked as an orange resistance zone on the above chart).
Therefore, as long as there is no breakout above the resistance, another move to the downside and at least a retest of the turquoise support zone can't be ruled out in our opinion.
If we consider the above-mentioned moves to (and slightly above) the lower border of the lower border of the trend channel as verifications of the earlier breakdown, the likelihood of another downswing would increase. However, such price action would be more likely and reliable only if the USD Index closes today's session (or one of the following) below the red declining trend channel once again.
What could happen if we see such price action? Let's take a look at the chart below.
If the situation develops in tune with the bearish scenario, and the bulls do not manage to take the index above the orange resistance area, we could see a drop to at least the upper green support zone based on the mid-April and early May lows, which would be in line with the bullish scenario for the euro, British pound and Australian dollar.
Thank you.
Nadia Simmons
Forex & Oil Trading Strategist

