

During the last week, currency bulls not only managed to break through the neck line of a pro-growth formation, but also climbed above a short-term resistance line based on previous peaks. This encouraging rally was, however, interrupted by combinations of factors that could stop them for longer. Will it be so? Or maybe the last pullback is just gathering forces before the next move to the north?
- EUR/USD: short (a stop-loss order at 1.1878; the initial downside target at 1.1343)
- GBP/USD: none
- USD/JPY: long (a stop-loss order at 111.37; the next upside target at 113.45)
- USD/CAD: none
- USD/CHF: none
- AUD/USD: none
EUR/USD
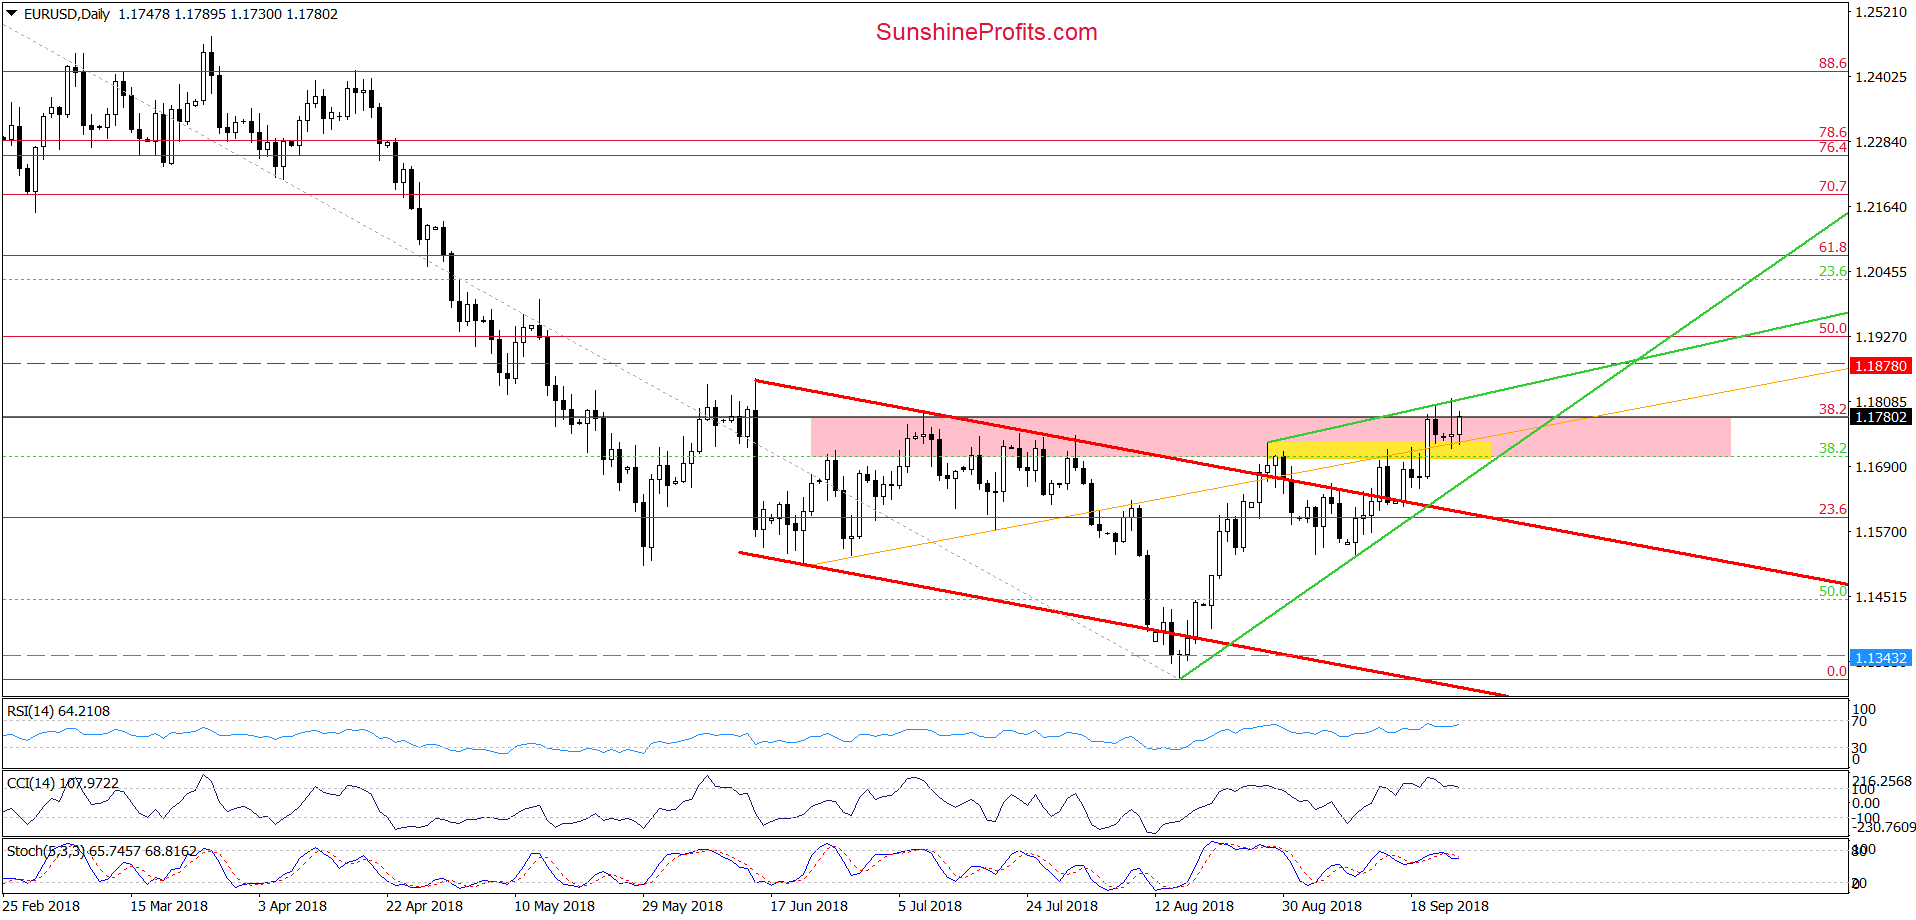
Yesterday, EUR/USD re-tested the 38.2% Fibonacci retracement (based on the entire February-August downward move) and the upper line of the pink resistance zone once again, but then pulled back (similarly to what we saw on Friday) and erased some losses earlier today. This is a repeat of what we already saw in previous days, which means that what we wrote in our Monday’s alert remans up-to-date also today:
(…) we continue to think that lower values of the exchange rate are just around the corner - especially when we add an additional resistance (the green resistance line based on the previous peaks) and the current situation in the medium term.
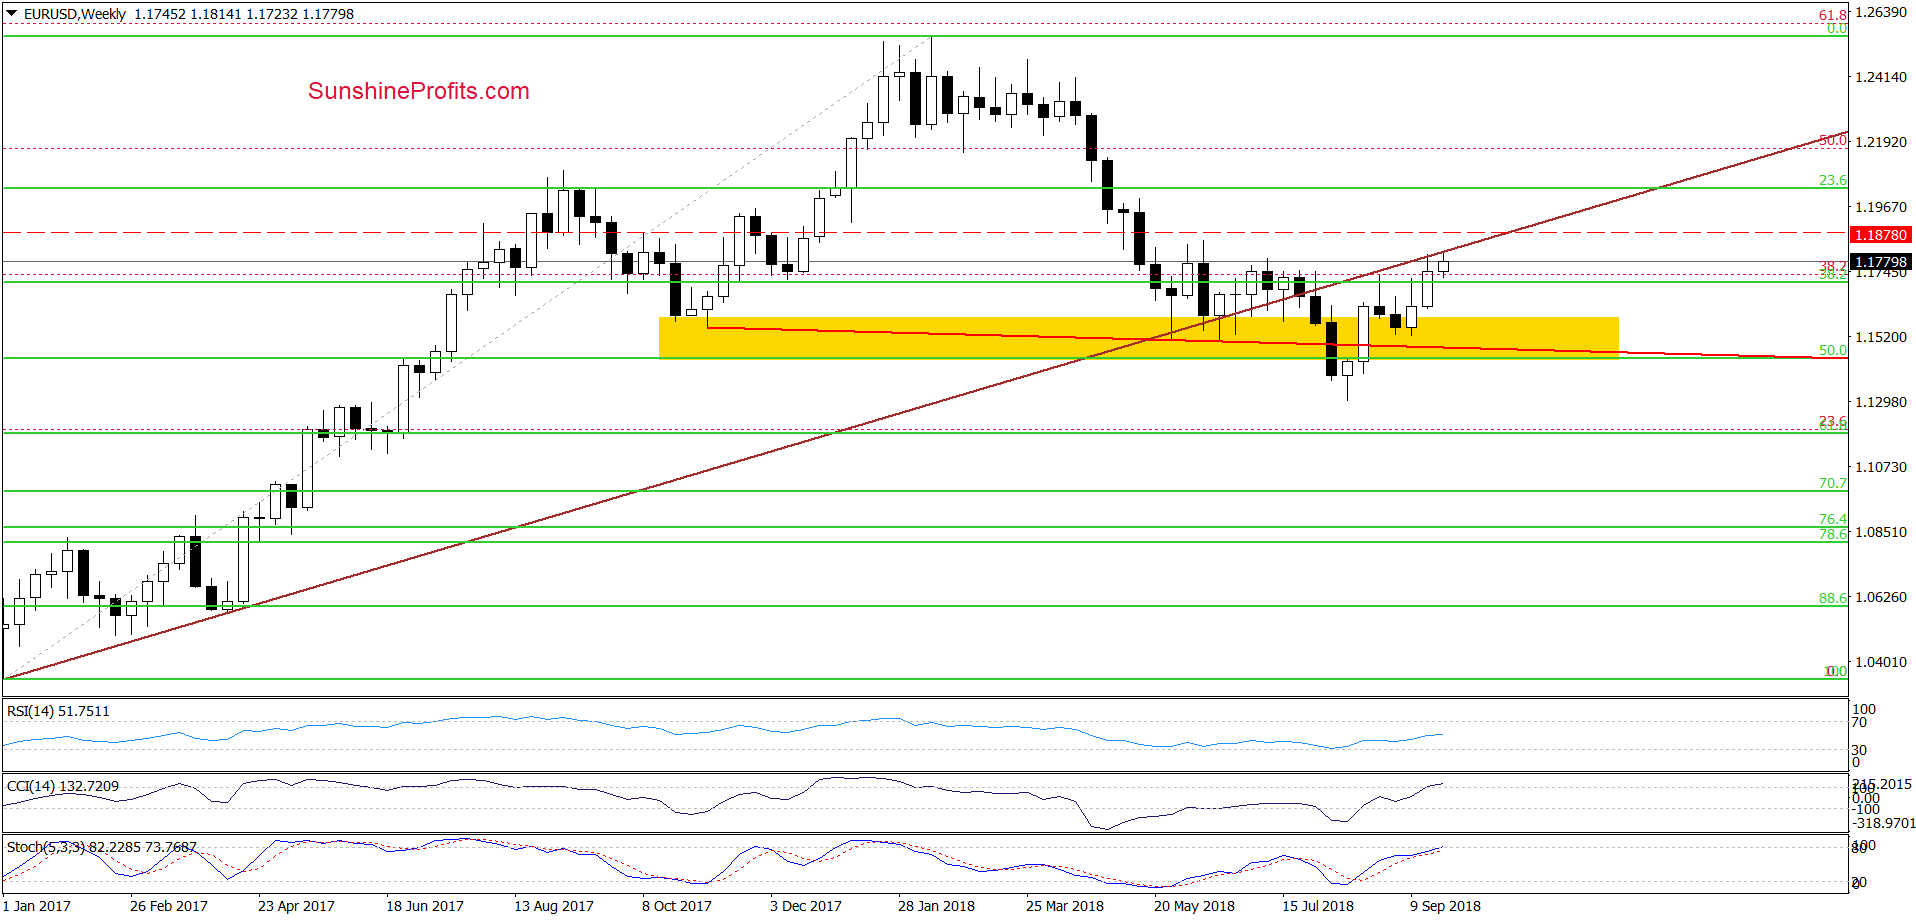
As you see on the weekly chart, EUR/USD climbed to the previously-broken long-term brown line, but then pulled back and closed the week below it, which looks like a verification of the late-July breakdown.
Earlier today, currency bulls triggered one more move to the north, which suggests that we could see another verification in the very short term. Nevertheless, in our opinion, as long as there is no invalidation of the breakdown under this line the way to higher levels is closed and one more reversal is very likely – especially when we factor in the similarity to the past about which we wrote on Friday:
(…) similar price action we saw at the end of August. Back then, the proximity to this important resistance encouraged currency bears to show their claws, which turned into decline.
This time, the sellers have on their side one more argument – the above-mentioned 38.2% Fibonacci retracement, which together with the upper line of the pink resistance zone and the long-term brown resistance line will likely stop further improvement in the very near future.
Taking all the above into account, we believe that short positions are justified as a bigger move to the downside is just around the corner. Therefore, if the pair closes today’s session below the above-mentioned resistances, we’ll see a test of the green support line based on previous lows in the very near future.
Trading position (short-term; our opinion): Short positions with a stop-loss order at 1.1878 and the initial downside target at 1.1343 are justified from the risk/reward perspective.
USD/CAD
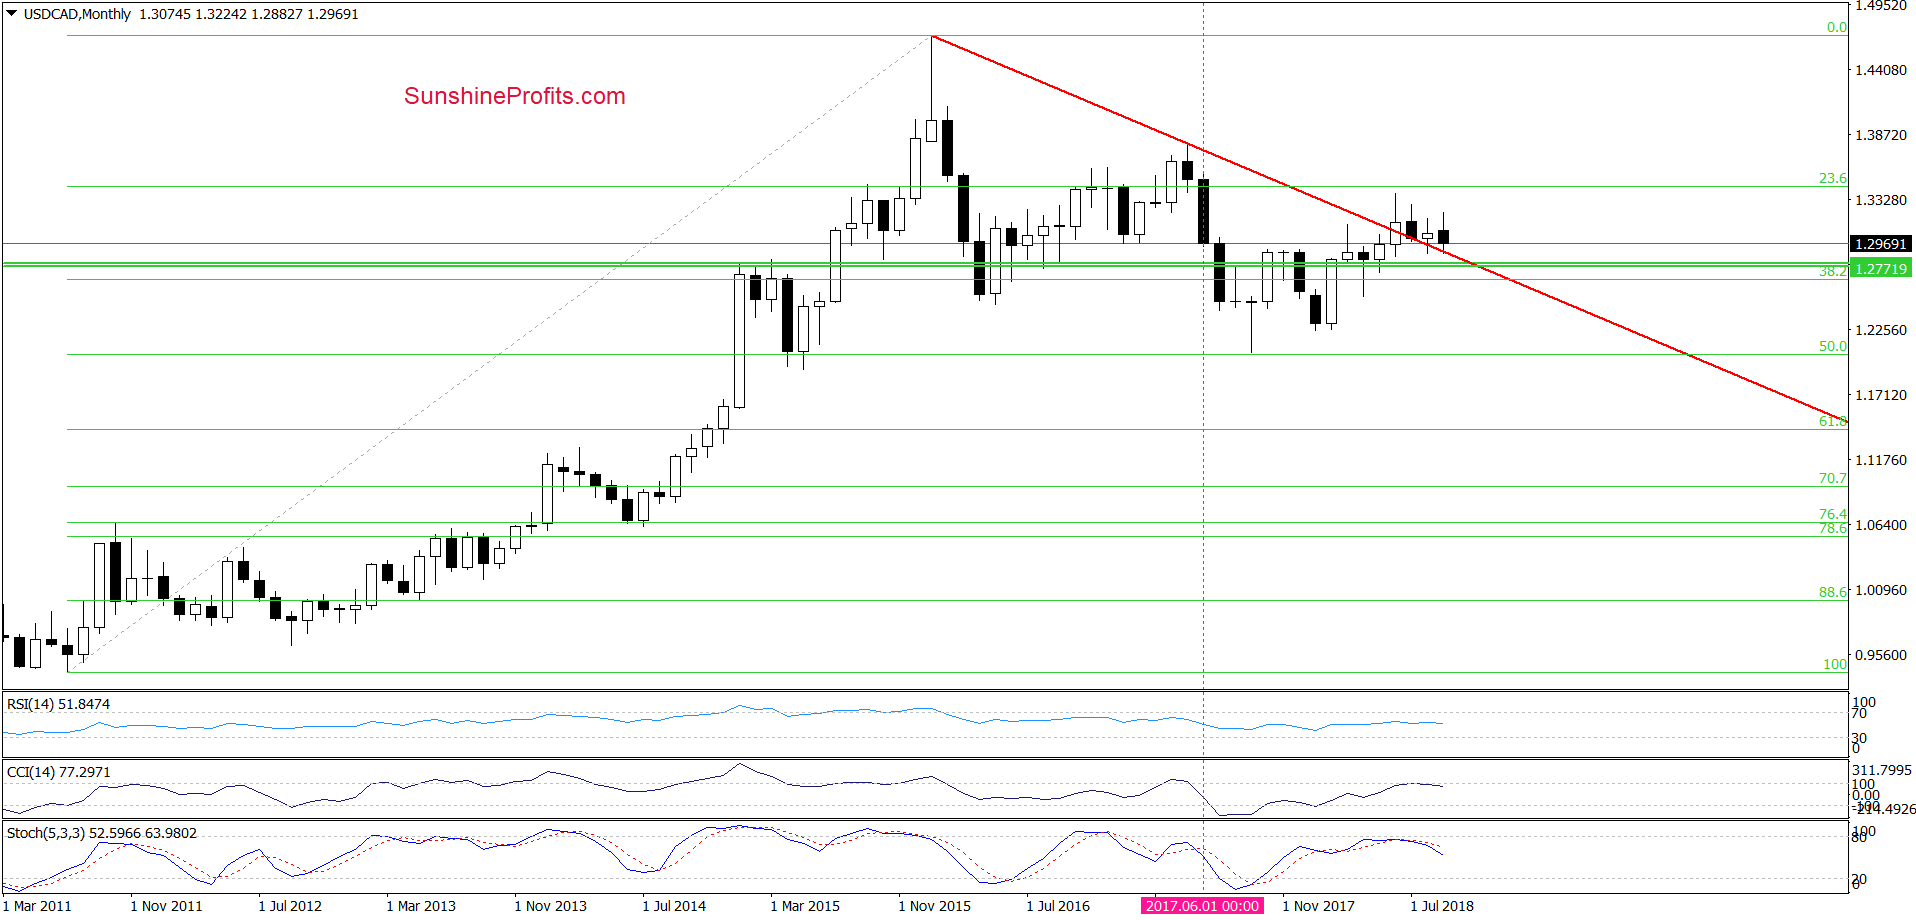
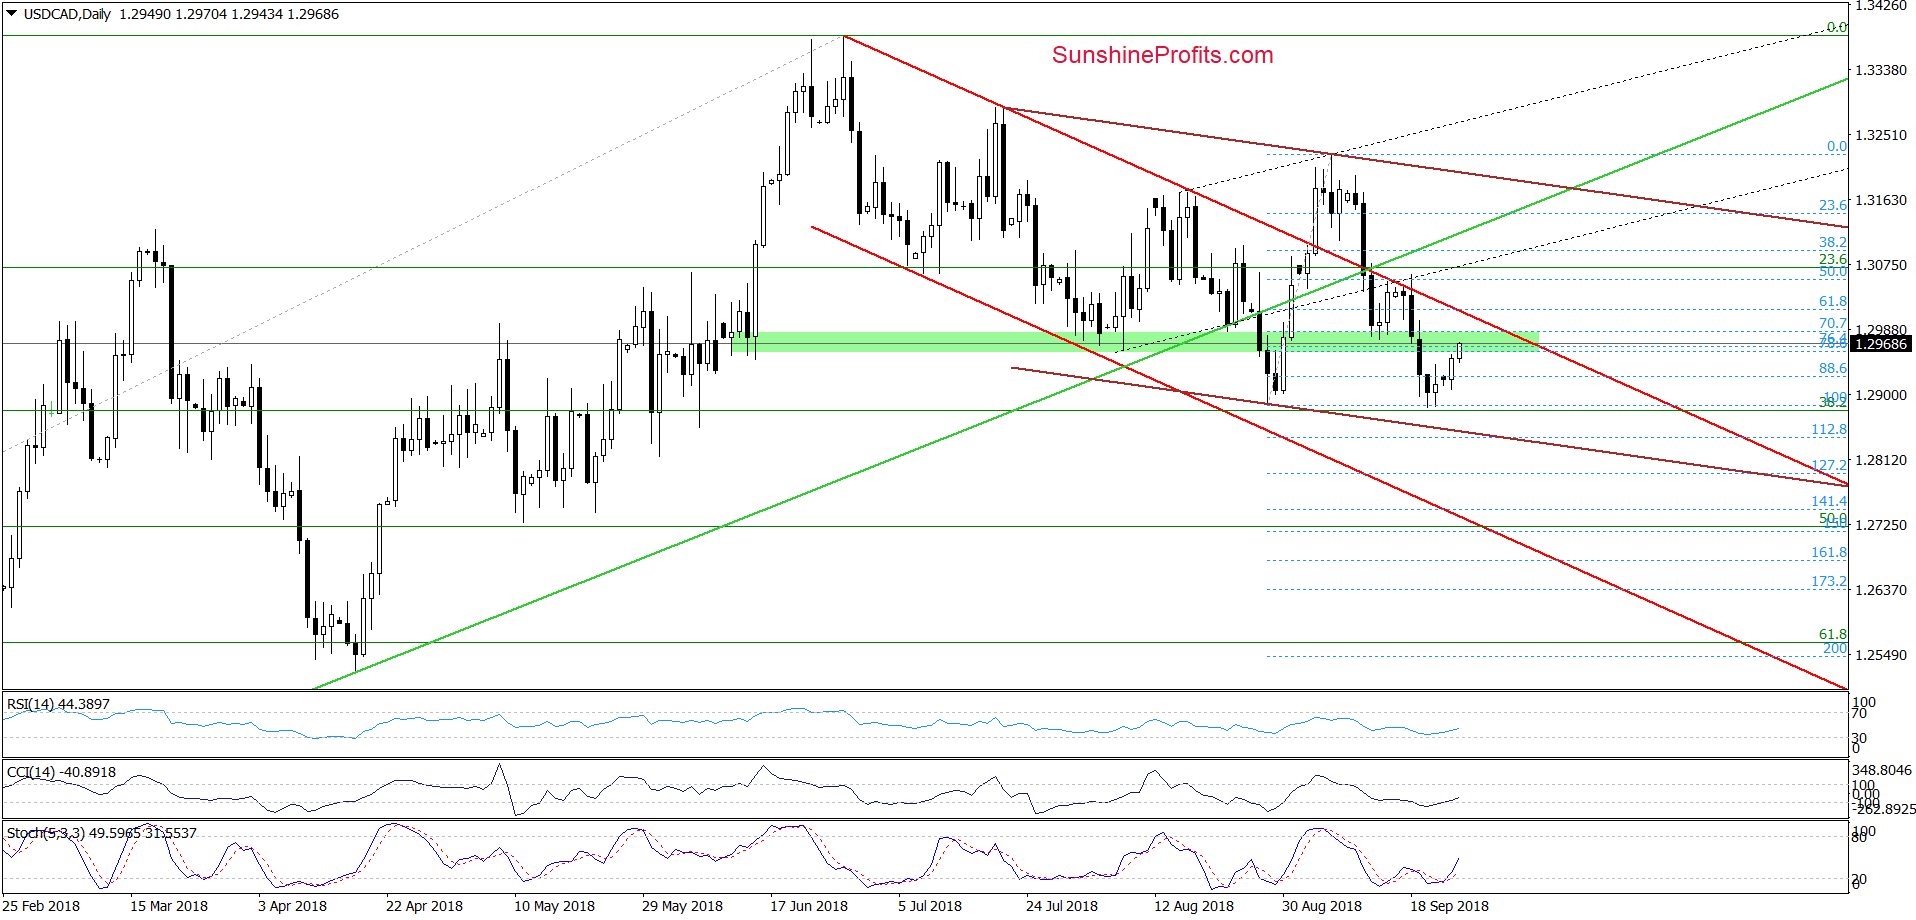
From today’s point of view, we see that the proximity to the previously-broken long-term red declining support line (seen on the monthly chart), the late-August lows and the lower border of the brown declining trend channel (marked on the daily chart) encouraged currency bulls to act in recent days, which resulted in a comeback to the green area, which serves as the nearest resistance.
Will it stop the buyers? Taking into account the current position of the daily indicators (the CCI and the Stochastic Oscillator), it seems that further improvement is just around the corner. Nevertheless, in our opinion, a pro-growth scenario (and a bigger move to the upside) will be more likely and reliable only if USD/CAD manage to break above the upper border of the red declining trend channel.
Until this time, one more downswing can’t be ruled out – especially when w factor in the fact that there are long-term sales signals generated by the CCI and the Stochastic Oscillator, which last time (in June 2017) preceded sizable declines. Therefore, waiting at the sidelines for signs of currency bulls’ strength seems to be the best decision at the moment.
Trading position (short-term; our opinion): No positions are justified from the risk/reward perspective. We will keep you informed should anything change, or should we see a confirmation/invalidation of the above.
AUD/USD
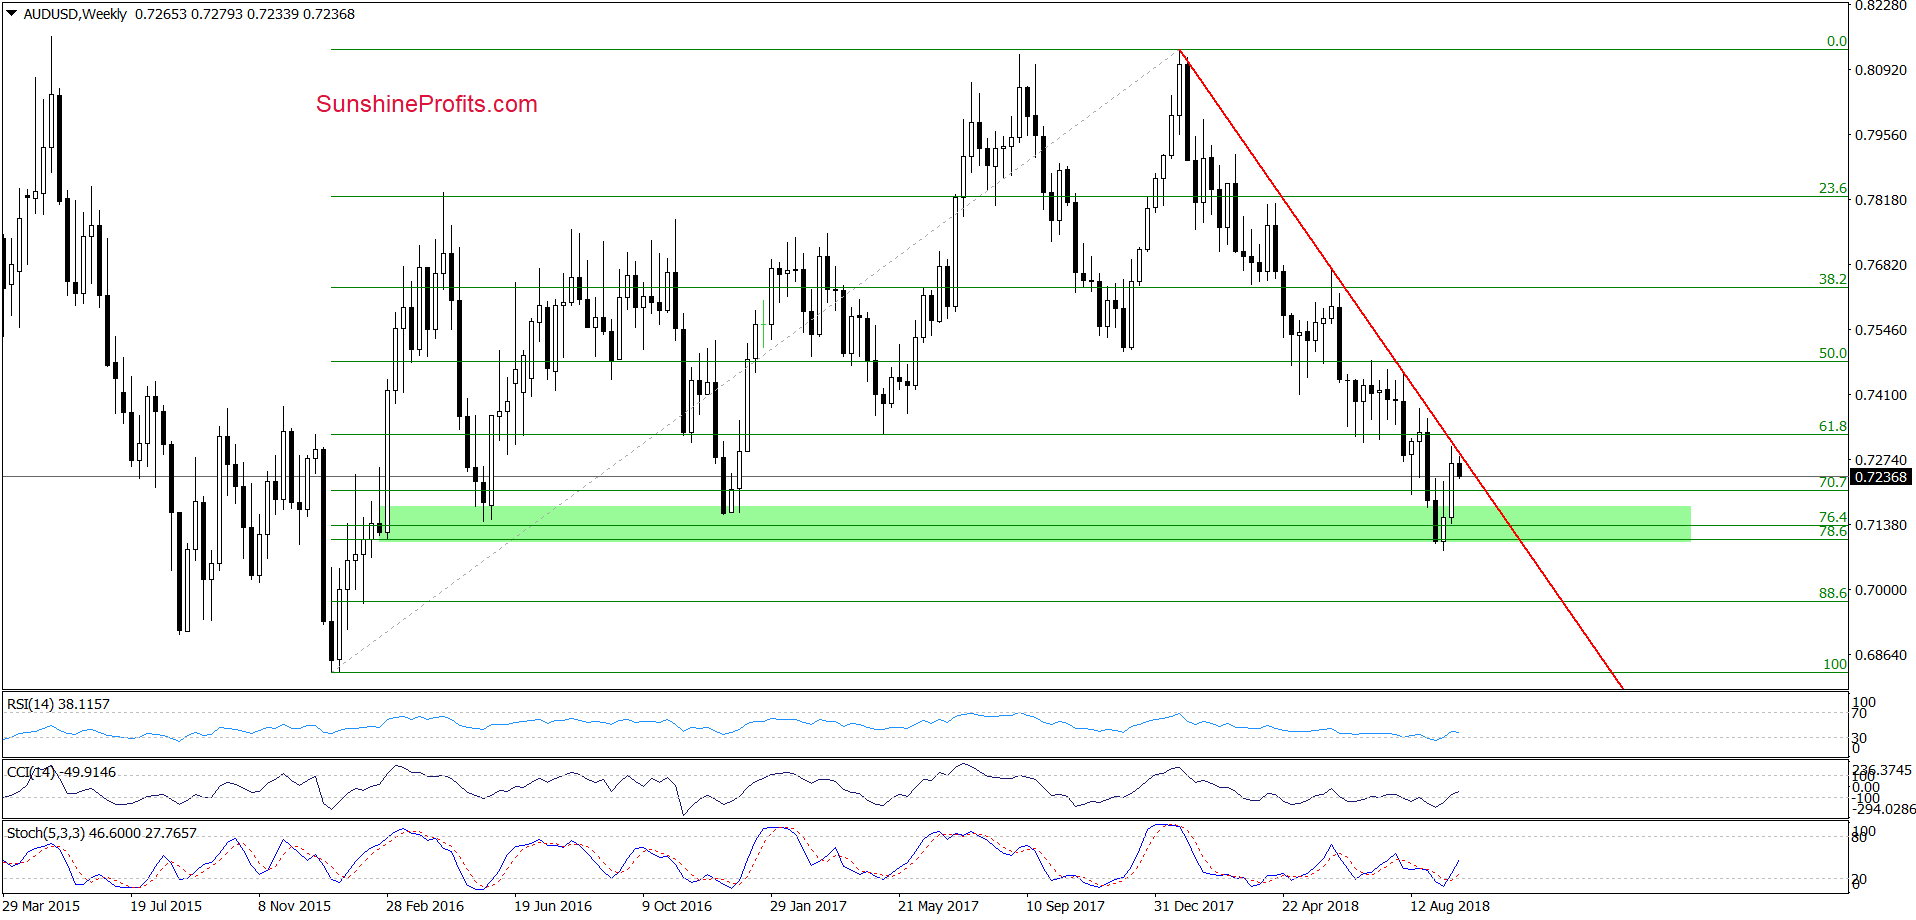
Looking at the medium-term chart, we see that although currency bulls pushed AUD/USD quite sharply higher in the previous week, the upper border of the red declining trend channel stopped them, triggering a pullback this week.
How did this price action affect the very short-term chart? Let’s take a look at the daily chart below to find out.
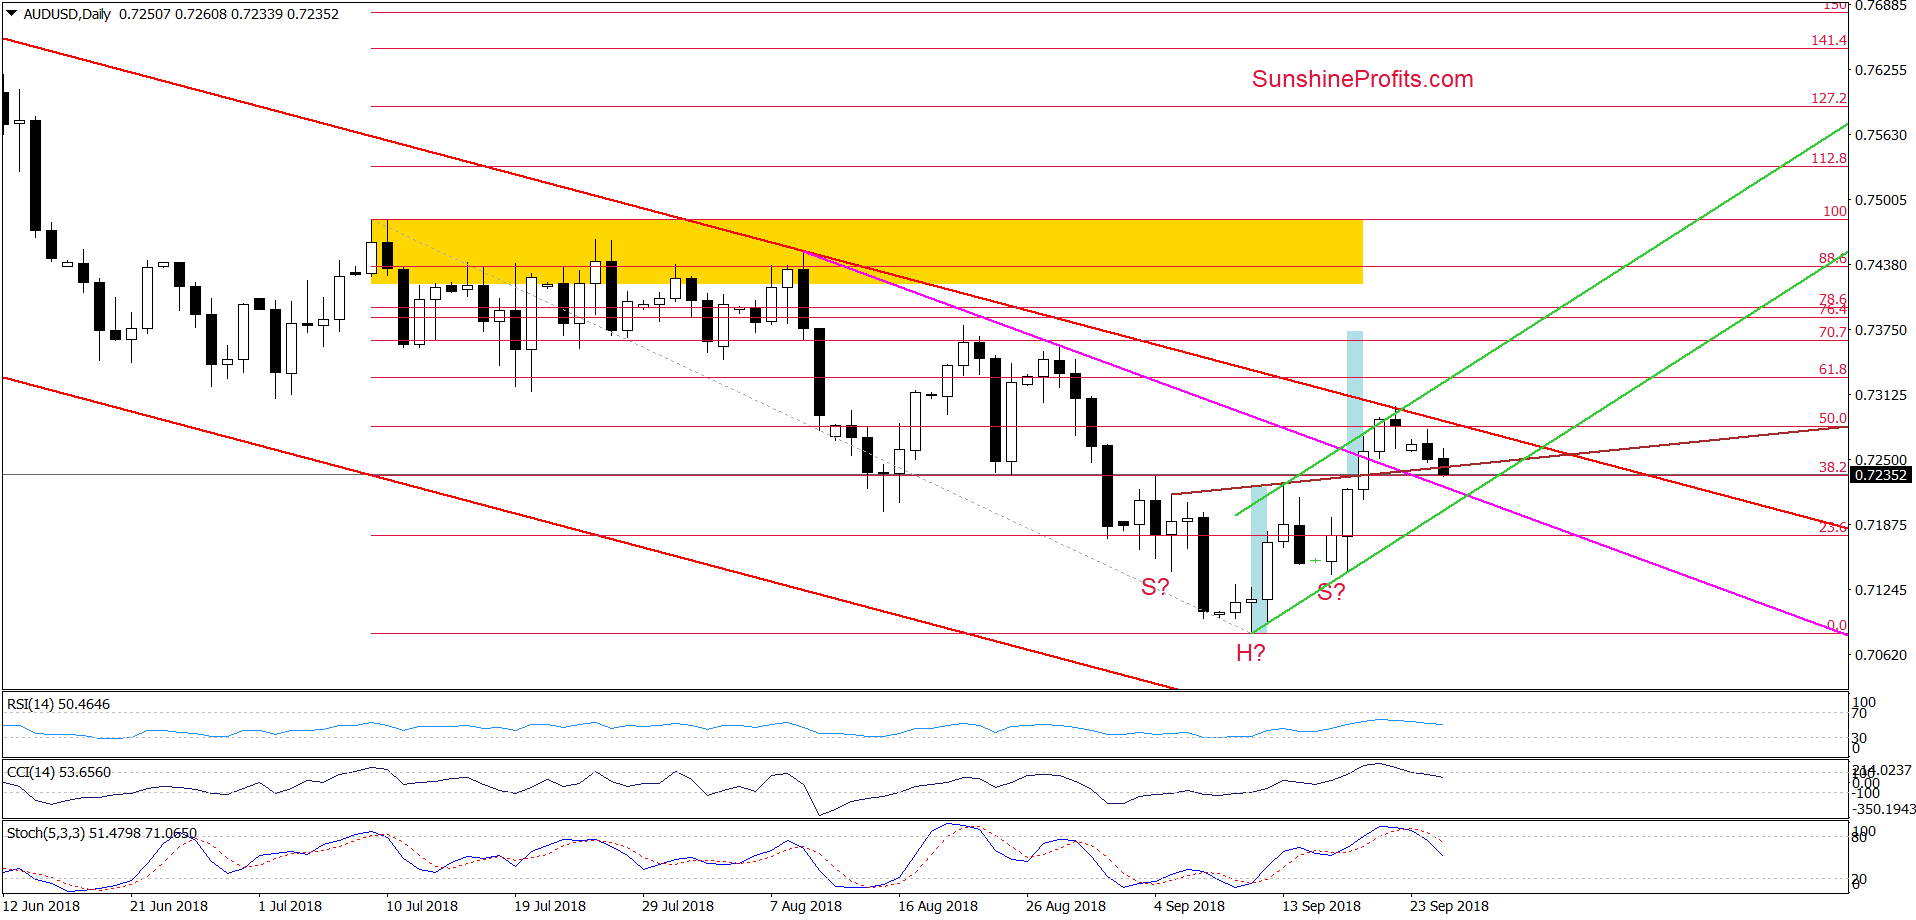
From this perspective, we see that although the buyers took the exchange rate above the brown resistance line based on previous highs (a neck line of a reverse head and shoulders formation) and broke above the pink resistance line, the above-mentioned upper line of the red declining trend channel in combination with the upper border of the very short-term green rising trend channel encouraged currency bears to fight for lower values of AUD/USD.
Thanks to their attack, the pair slipped under the previously-broken neck line of the pro-bullish formation, which doesn’t look encouraging at the moment of writing this alert – especially when we factor in the sell signals generated by the daily indicators.
Nevertheless, the current situation will turn into bearish if the exchange rate closes today’s session under this line and the pink support line. If we see such price action, the way to the lower border of the green trend channel will be open.
What could happen if AUD/USD declines below it? We’ll consider opening short positions, because the pair will likely extend losses in the following days (maybe even test the green support zone marked on the weekly chart). We will keep you informed should anything change, or should we see a confirmation/invalidation of the above.
Trading position (short-term; our opinion): No positions are justified from the risk/reward perspective.
Thank you.
Nadia Simmons
Forex & Oil Trading Strategist
Przemyslaw Radomski, CFA
Founder, Editor-in-chief, Gold & Silver Fund Manager
Gold & Silver Trading Alerts
Forex Trading Alerts
Oil Investment Updates
Oil Trading Alerts

